

Scott Olson
Two months ago, I wrote on Bloomin’ Brands (NASDAQ:BLMN), noting that the stock had a tough second half of the year ahead given the difficult macro backdrop and persistent inflationary pressures. While we’ve seen some improvement in industry-wide traffic since then, inflationary pressures have not improved much, taking a bite out of margins for most operators. This backdrop has favored owning quick-service names with lower average checks and, in general, companies with a high proportion of their system franchised, such as Restaurant Brands International (QSR), not the mostly company-owned models like Bloomin’ Brands (“Bloomin”).
However, the company put up slightly better Q2 results than I expected, with a decent quarter out of Fleming’s and comp sales down across other US brands, but less than I anticipated. The good news is that the company continues to work towards ways to claw back margins, and it’s possible we have seen peak inflation, setting the company up for easier H1 2023 comps. That said, I still don’t see enough margin of safety just yet, with the ideal buy-point being 12% lower and closer to technical support.
Bloomin’ Brands (Company Presentation)
Q2 Results
Bloomin’ Brands released its Q2 results last month, reporting quarterly revenue of $1,125 million, a 4% increase from the year-ago period. While this paled in comparison to double-digit sales growth from Texas Roadhouse (TXRH), Ruth’s Hospitality (RUTH), and Cheesecake Factory (CAKE), it was slightly better than I expected, given the weak traffic trends for casual dining in the period. The result was that Bloomin; raised its FY2022 revenue guidance to $4,425 million at the mid-point from $4,375 million, helping the stock to put together a post-earnings rally.
Bloomin’ Brands – Quarterly Revenue (Company Filings, Author’s Chart)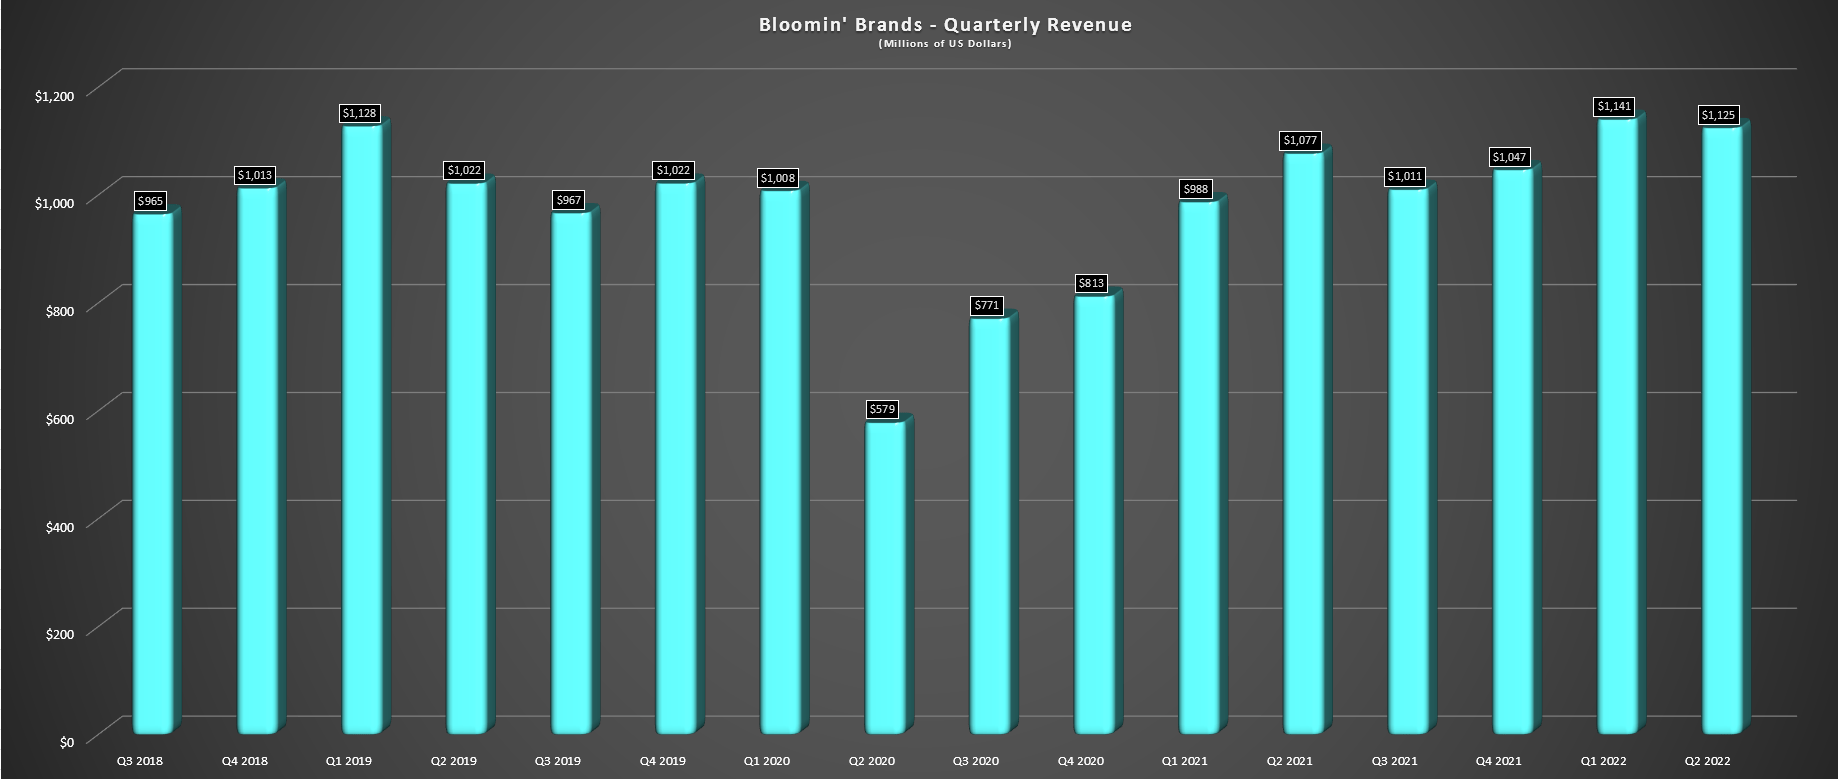
However, as I noted in my previous update, rallies above $21.00 would likely provide profit-taking opportunities, given that the industry was not out of the woods yet from a headwind standpoint, still experiencing a very difficult macro backdrop. This was evidenced by negative same-store sales at Outback, Carrabba’s, and Bonefish Grill of 1.1%, 1.0%, and 1.1%, respectively, despite 5.0%+ pricing in the period. Fortunately, the company’s business in Brazil bounced back strongly after COVID-19 restrictions last year, and Fleming’s also had a decent quarter, with comp sales up 6.0% year-over-year.
Bonefish Grill Offerings (Company Presentation)
Digging into the quarter a little closer, the company’s total US business reported negative comp sales growth of 0.40% in the period, with traffic declines significantly outpacing menu pricing. However, off-premise sales have remained sticky at 12% of US revenue in the period, and curbside pick-up, which makes up most of off-premise, has similar margins to in-restaurant dining. Bloomin’ is also looking to increase sales with its catering business, launching nationwide catering with Bonefish Grill in August. If successful, this could provide a small boost to sales, helping to offset the traffic declines experienced industry-wide throughout most of the summer.
Looking at international sales, Outback Brazil reported 96% comp sales growth and ~28% growth vs. 2019, a solid performance from this geography that dragged on the company’s results last year. Meanwhile, average weekly unit volumes are up 14% on a constant currency basis to $61,200. Moving back to the US, the stand-out performer for the company has been Fleming’s, which has seen average weekly unit volumes increase by over 30% from Q2 2019 levels to ~$113,000. Bonefish Grill has been the laggard by a wide margin, and we could see a slight impact in Q3 from Hurricane Ian, where the company has nearly 30% of its locations.
Margins & Earnings Trend
While sales performance was better than expected, margins continued to remain under pressure, as evidenced by the below chart. As shown below, restaurant-level operating margins dipped to 15.5% year-over-year vs. 20.3%. Still, given the help from a simplified menu and incremental contribution from off-premise, margins remain in line with Q2 2019 levels, which is more than can be said for industry laggards like Shake Shack (SHAK), Red Robin (RRGB), and several others. With further innovation on deck, such as advanced grills/ovens to improve food quality and productivity and potentially speed up table turns, Bloomin’ remains confident in its 8.0% operating margin target.
Bloomin’ Brands – Restaurant Level Operating Margins (Company Filings, Author’s Chart)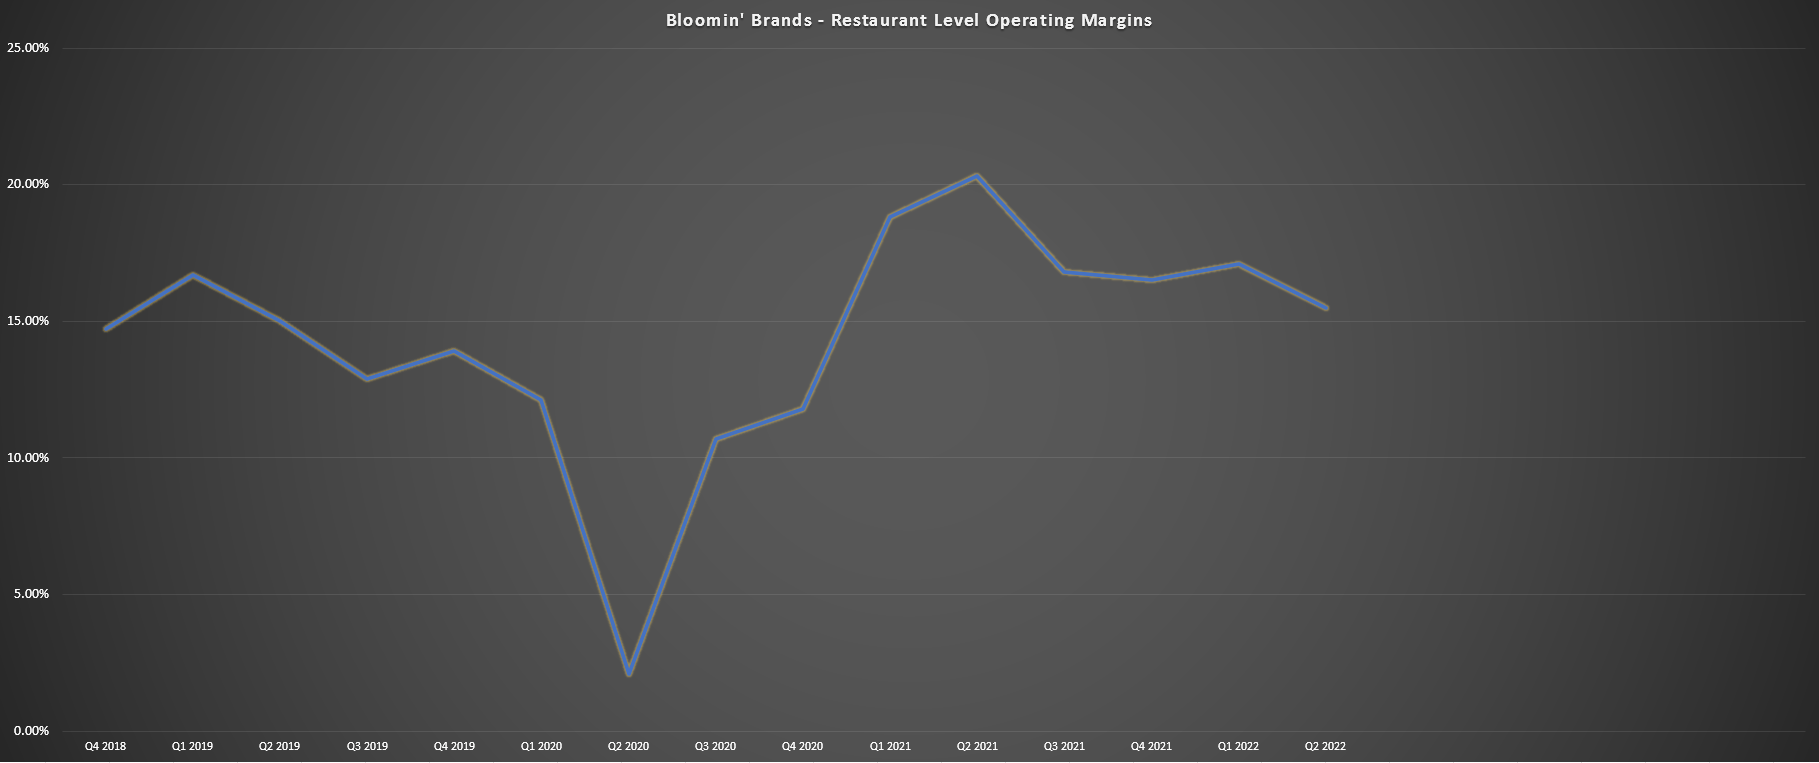
As discussed by the company, the decline in margins year-over-year was related to higher advertising expenses, utility costs, commodity inflation, and wage inflation. While further improvements in advertising expenses and wage inflation will be hard to offset given that spending is down but aiming to be more effective and cutting wages certainly isn’t an option, there are some green shoots from a commodity inflation standpoint. This is because many brands have discussed that they are starting to see some moderation in some areas, including beef and chicken wings, called out by Bloomin’ Brands. As shown below, we saw a slight sequential decline in August, though dairy prices have remained elevated, with butter and milk up high double digits.
Food Costs (National Restaurant Association, BLS)
Assuming we have seen peak inflation in Q2 for some items and that Bloomin’s margins were hit harder than peers due to more conservative pricing to accentuate its value proposition, Bloomin’ should be up against easier comps in H1 2023. This is because it will benefit from slightly higher pricing and potentially some moderation in commodities and a cool-down in the rate of wage inflation, which could allow for a beat vs. the constant guide higher in cost of goods sold that investors are becoming used to in the industry. So, the insurmountable year-over-year comps (2022 vs. 2021) might be flipping.
That said, the big wild card is industry-wide traffic, which bounced back in August but could remain under pressure with consumers getting hit from all angles. The only real area of relief has been gas, with prices plunging from their peak at $5.00/gallon, but this has been offset by higher mortgage costs and higher grocery costs. The major headwind is the reverse wealth effect, with consumers getting used to weaker home prices and red ink in their investment accounts, possibly making them less likely to rush out for dinner and spend $50.00 – $100.00, depending on their party size.
Personal Savings Rate (St. Louis Fed)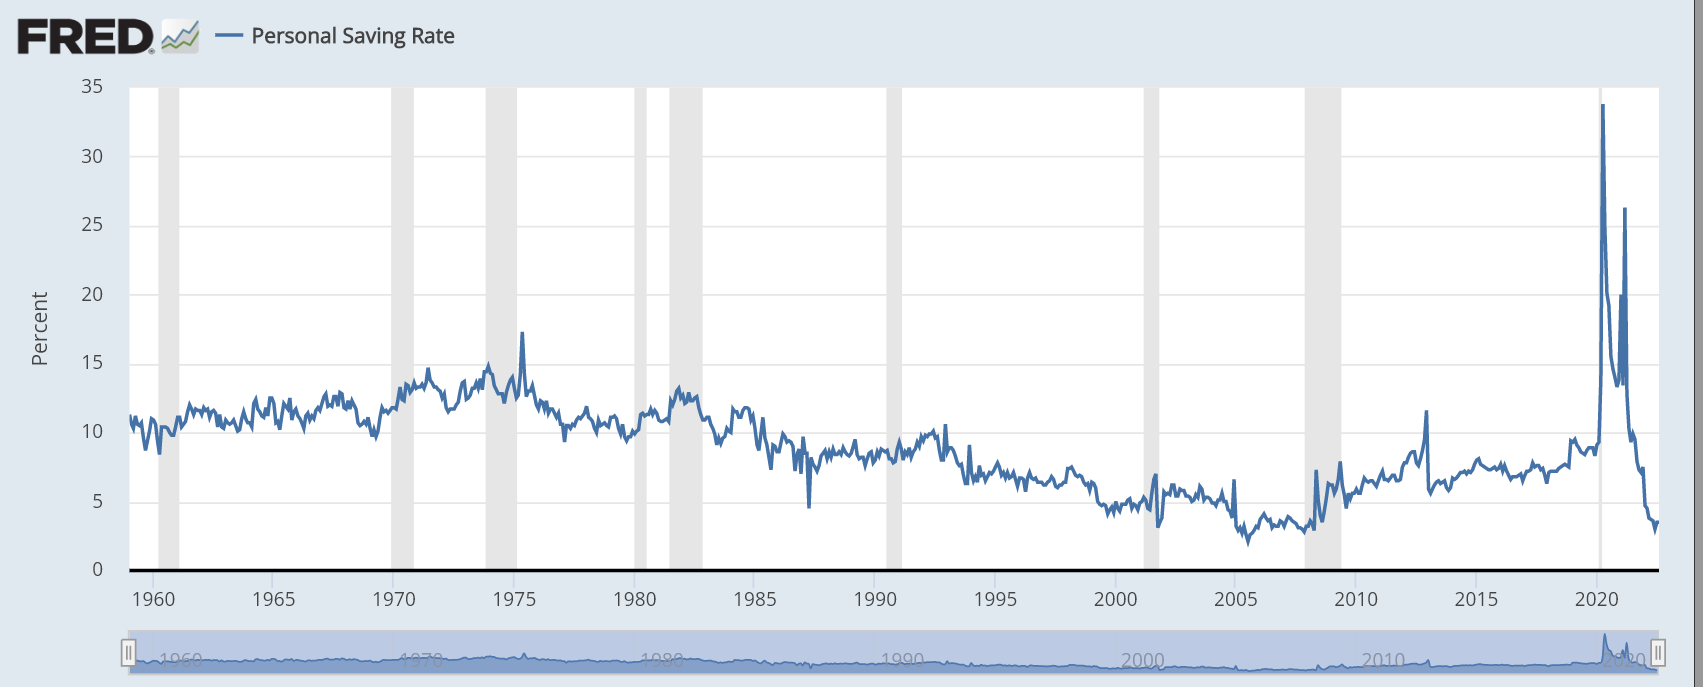
So, while there could be easier comps from a margin standpoint, the key will be traffic, which is difficult to forecast with a more cash-strapped consumer. Let’s look at Bloomin’s valuation and see whether this is priced into the stock:
Valuation & Technical Picture
Looking at the chart below, Bloomin Brands has historically traded at ~13.4x earnings (7-year average) and closer to 14.0x earnings since its IPO debut. Assuming we used these historical multiples to value the company today, Bloomin would be trading at a deep discount to fair value, sitting at just 7.5x FY2022 earnings estimates. However, given the extremely challenging environment that the industry has found itself in, I believe a more conservative earnings multiple is 10, translating to a fair value for the stock of $24.30, assuming it meets FY2022 earnings estimates.
BLMN Historical Earnings Multiple (FAST Graphs)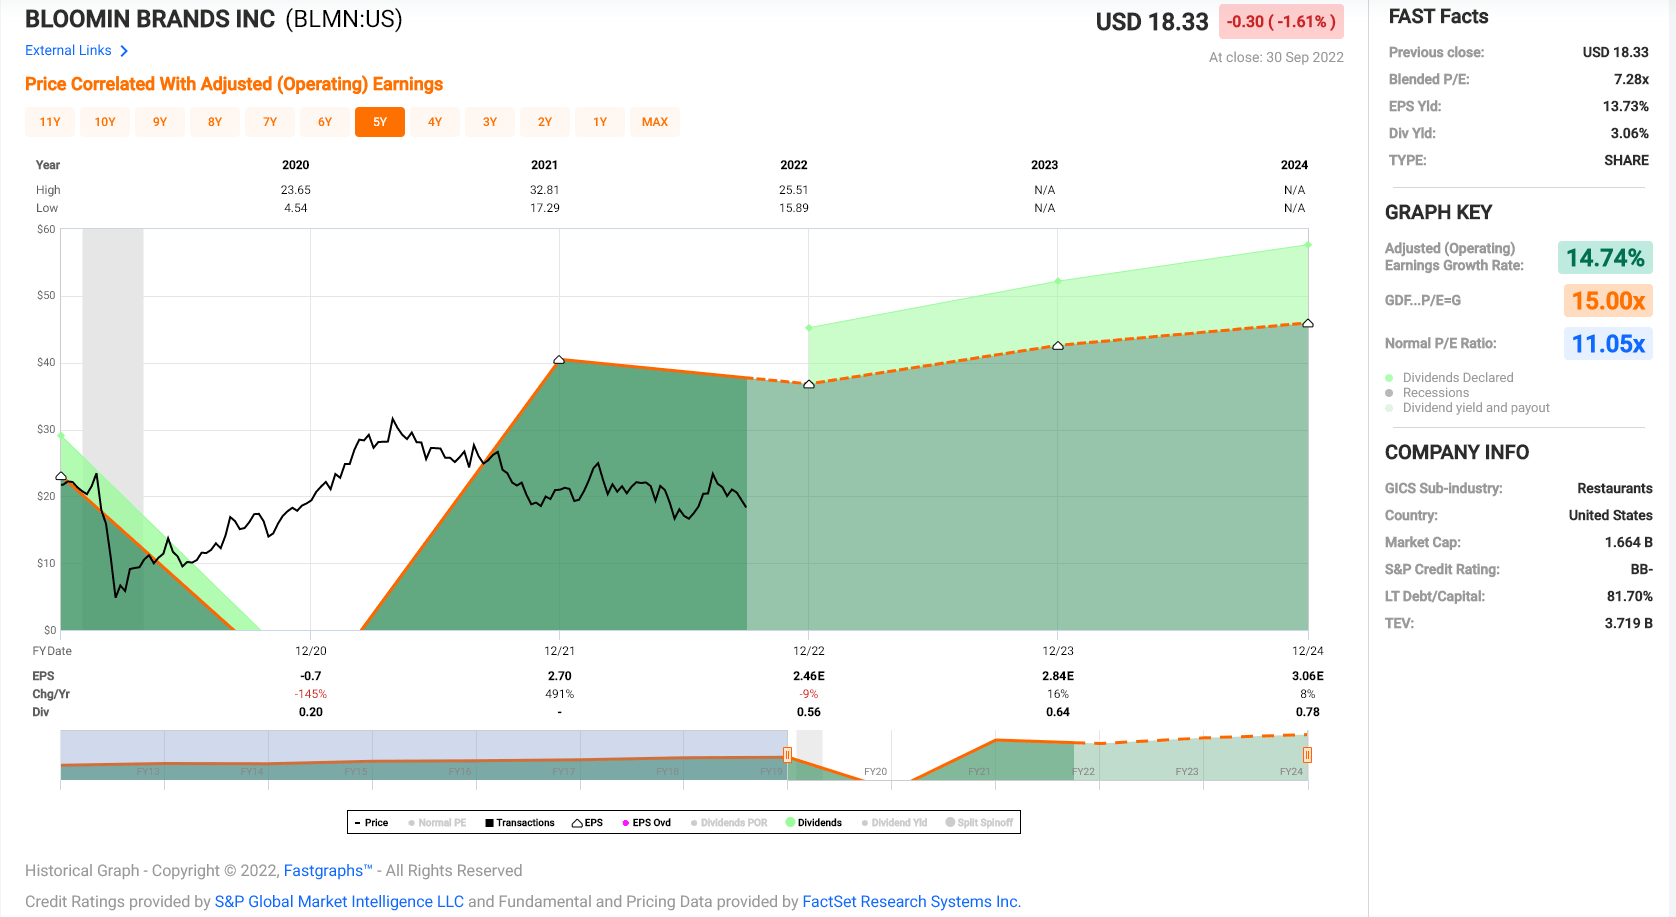
While this points to more than a 30% upside after the stock’s recent correction, I prefer a minimum 35% discount to fair value to justify entering new positions in small-cap stocks, placing the low-risk buy zone for BLMN at $15.80 or lower, or 13% below current levels. Obviously, there’s no guarantee that the stock heads this low, but in a cyclical bear market for the major market averages, I prefer getting the most attractive price or not paying at all, especially when buying a name that is not an industry leader. In the case of a name like McDonald’s (MCD), I would be more than willing to be a little less conservative with my entry price.
BLMN Daily Chart (TC2000)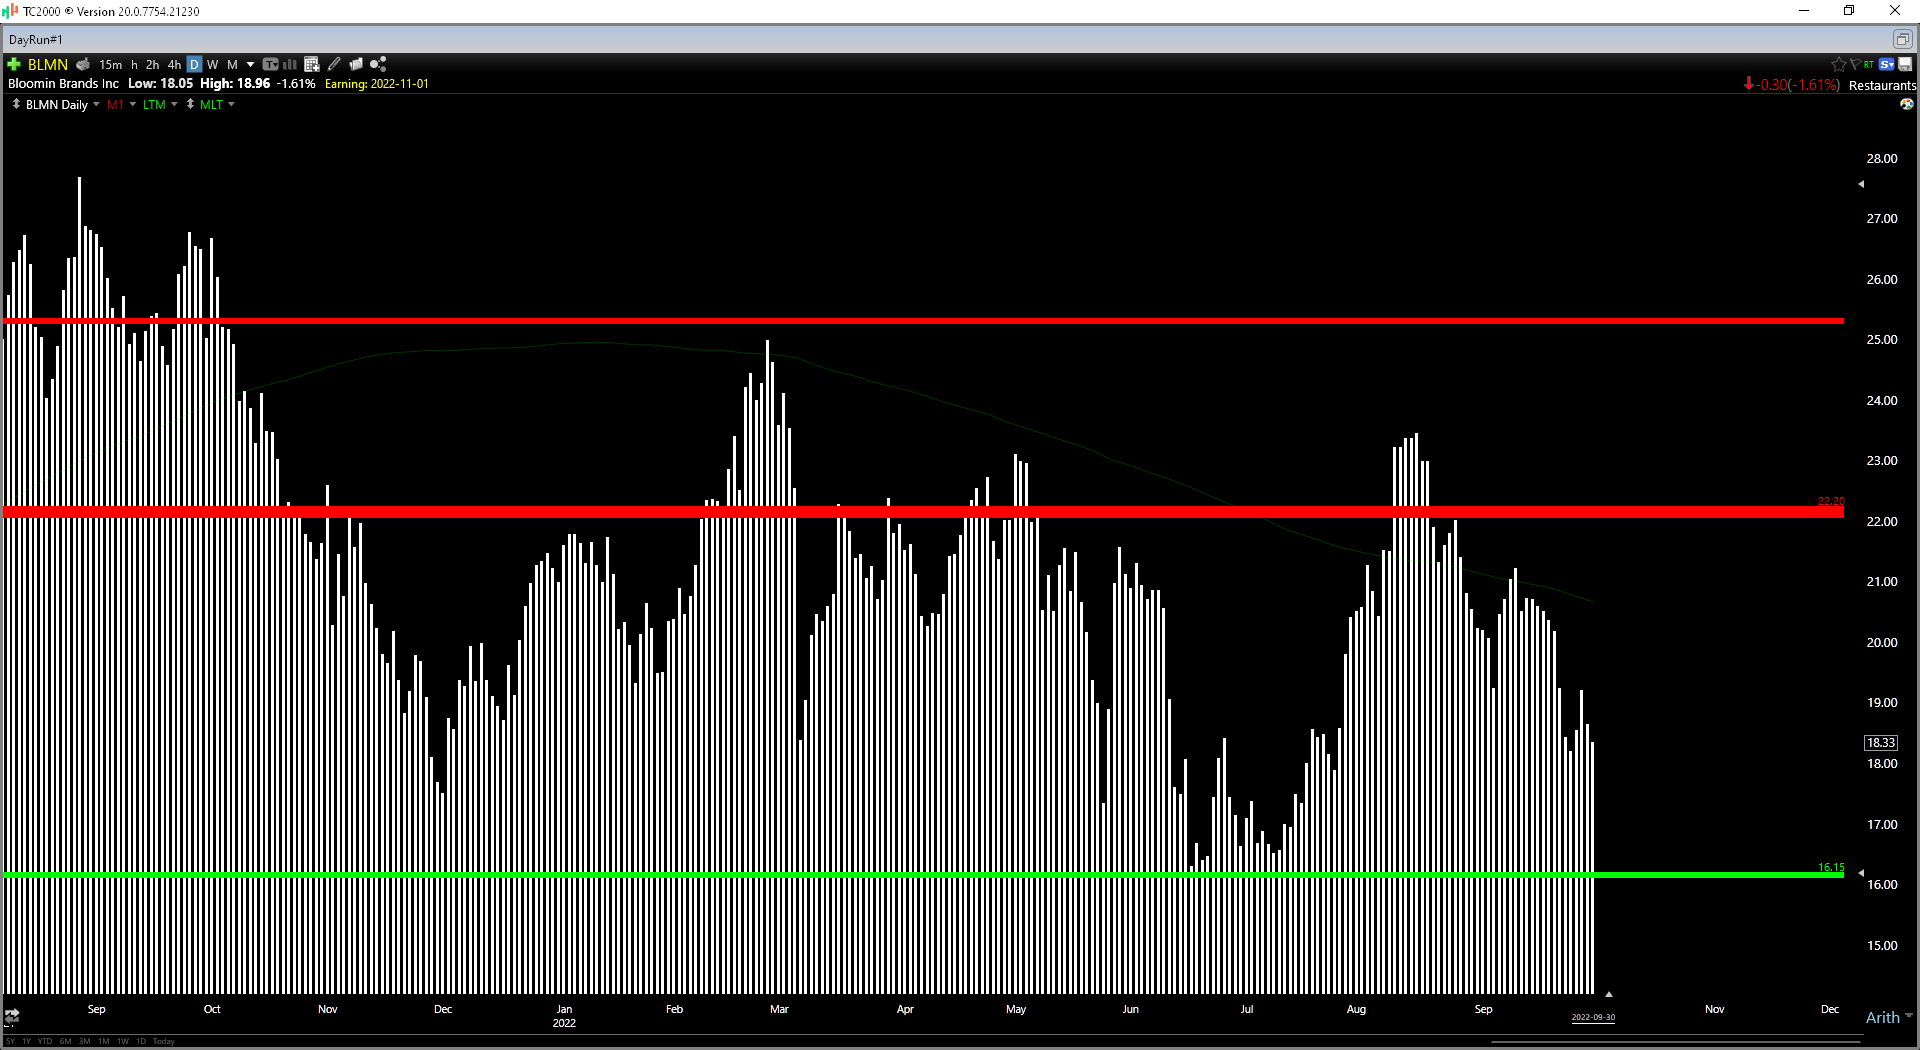
Moving to the technical picture, we’ve seen an improvement, with Bloomin’ Brands reversing back above broken support at $17.90 to remove this new resistance level. Meanwhile, the stock has a new upper support level at $16.15. However, even with this slight upgrade to the technical outlook, the stock is still sandwiched between resistance at $22.20 and support at $16.15, and the goal in a cyclical bear market is to buy as close to support as possible, or ideally on an undercut of support with a confirmed reversal back above this level. So, while BLMN’s reward/risk ratio has improved from my July update, I see the ideal buy-point coming in at $16.00 or lower.
Summary
Bloomin’ had a better Q2 report than I anticipated, and while the margin performance left a lot to be desired, the theme in most Q2 Conference Calls is that we may have seen peak inflation in Q2. At the same time, gas prices are well off their highs, and while the average consumer is still working with a much tighter budget, this is one small win at a time when one is needed. Hence, it’s possible that this could buoy demand in the industry going into a cash-strapped holiday season.
However, while Bloomin’ is very reasonably priced at $18.30, I still don’t see enough margin of safety just yet, especially given the difficult macro backdrop that could persist into 2023. So, if I were looking for value out there, I see Capri Holdings (CPRI) as the more attractive bet, with much stronger margins, the stock sitting right on support, and trading at ~5.6x FY2023 earnings estimates. That said, if BLMN were to dip below $16.00 before November, I would consider the stock from a swing-trading standpoint.
Be the first to comment