

Roman Tiraspolsky/iStock Editorial via Getty Images
Blackstone (NYSE:BX) is the largest alternative asset manager in the world, with more than $900 billion invested in private equity, real estate, credit, and hedge funds. Since reaching the 12-month high closing price of $148.88, on November 22, 2021, BX has fallen 35% to reach the current level of $97.14. Even with the substantial decline, BX’s longer-term trailing total returns are very high. The 3-, 5-, and 10-year annualized total returns are 33.3%, 27.2%, and 25.4% per year, respectively.
Seeking Alpha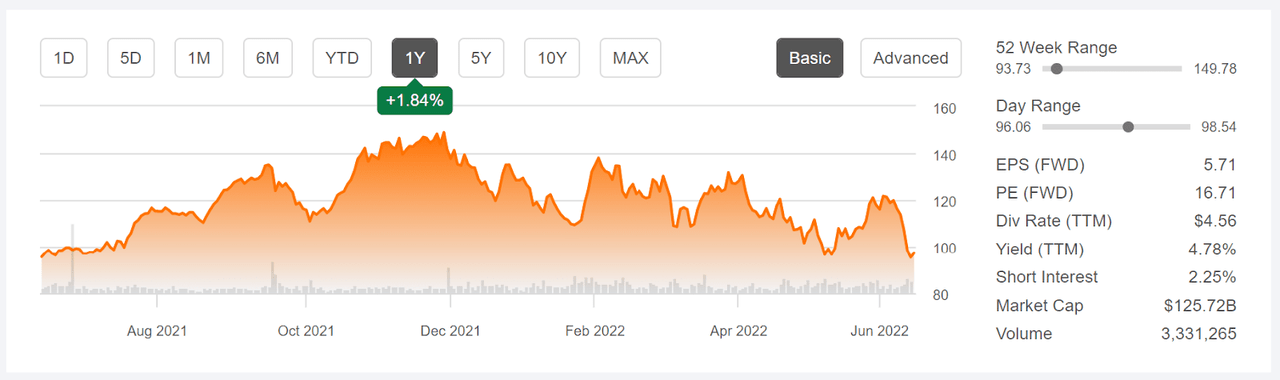
12-Month price history and basic statistics for BX (Source: Seeking Alpha)
Blackstone’s earnings have increased at a rapid clip, with Q1 EPS increasing more than 60% from a year ago. Management stated that the firm’s portfolio is well-positioned to maintain earnings growth in an inflationary environment with rising interest rates. The consensus outlook for EPS growth over the next 3 to 5 years is 17% per year.
ETrade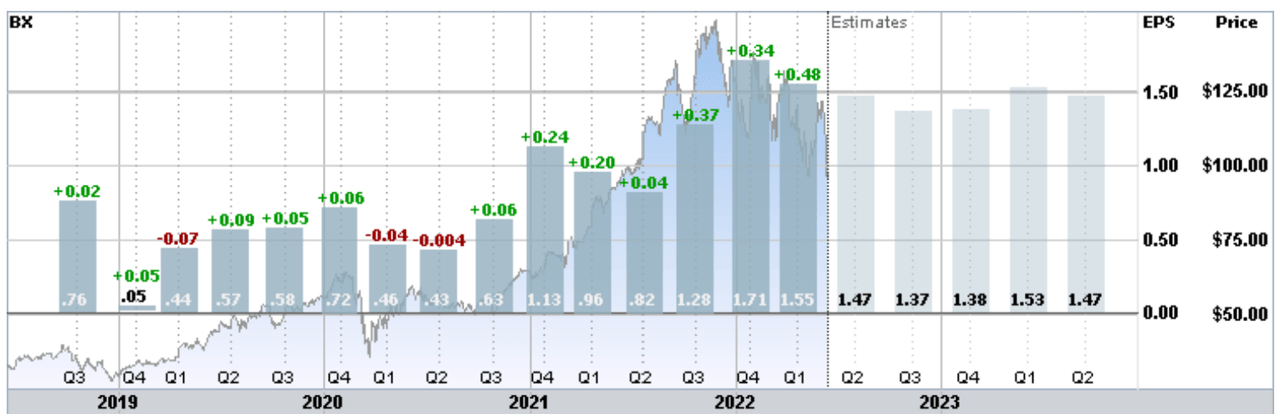
Trailing and estimated future quarterly EPS for BX. Green (red) values are amounts by which EPS beat (missed) expectations (Source: ETrade)
I have analyzed BX’s sensitivity to changes in interest rates by examining the rolling correlation between the share returns and percentage changes in the 10-year Treasury yield (using monthly returns). Over the past 10 years, the correlation between the 1-month return on BX and the 1-month percentage change in the 10-year Treasury yield is 4%–close to zero. The correlation between the 3-month return on BX and the 3-month percentage change in the Treasury yield for the past 10 years is 11%.
Geoff Considine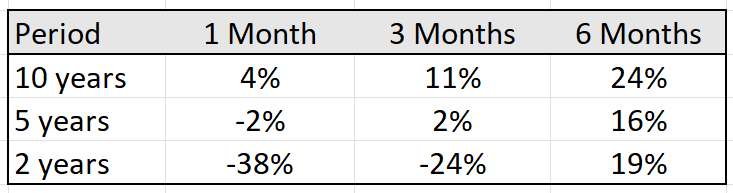
Correlations between 1-, 3-, and 6-month return on BX and percentage change in the 10-year Treasury yield for the past 10-, 5-, and 2-year periods (Source: Author’s calculations using historical data from Yahoo! Finance)
Over the past 5 years, the correlation between share return and the Treasury yield is also very small. For the trailing 2-year period, however, there is a fairly large negative correlation between 1- and 3- month share returns and 1- and 3-month changes in the Treasury yield. For the 6-month period, however, the correlation remains slightly positive. There appears to be a short-term negative correlation between BX return and changes in the Treasury yield (when yields rise, the shares fall and vice versa) over recent years, but this disappears when we look at longer-term returns. This result suggests that the market may be overreacting to interest rate changes in the short term, but that the share price normalizes on time scales that include one or more quarterly reports (some 3-month periods will be between monthly reports).
BX has a TTM dividend yield of 4.78% and a forward yield of 5.53%. The 3-, 5-, and 10-year dividend growth rates are 28.1%, 16.7%, and 24.5% per year, respectively.
Along with looking at fundamentals when analyzing a stock, I also rely on two forms of consensus outlooks. The first is the well-known Wall Street analyst consensus outlook. As long as the spread in individual price targets is not too high, the consensus 12-month price target tends to have predictive value. The second form of consensus outlook that I consider is the market-implied outlook, which represents the implicit consensus view from the options market.
For readers who are unfamiliar with the market-implied outlook, a brief explanation is needed. The price of an option on a stock is largely determined by the market’s consensus estimate of the probability that the stock price will rise above (call option) or fall below (put option) a specific level (the option strike price) between now and when the option expires. By analyzing the prices of call and put options at a range of strike prices, all with the same expiration date, it is possible to calculate a probabilistic price forecast that reconciles the options prices. This is the market-implied outlook. For a deeper explanation and background, I recommend this monograph published by the CFA Institute.
Wall Street Consensus Outlook for BX
ETrade calculates the Wall Street consensus outlook for BX by aggregating ratings and price targets from 10 ranked analysts who have published their views over the past 3 months. The consensus rating is bullish, and the consensus 12-month price target is $147.56, 52.6% above the current share price. The lowest of the analyst price targets is 21% above the current share price.
ETrade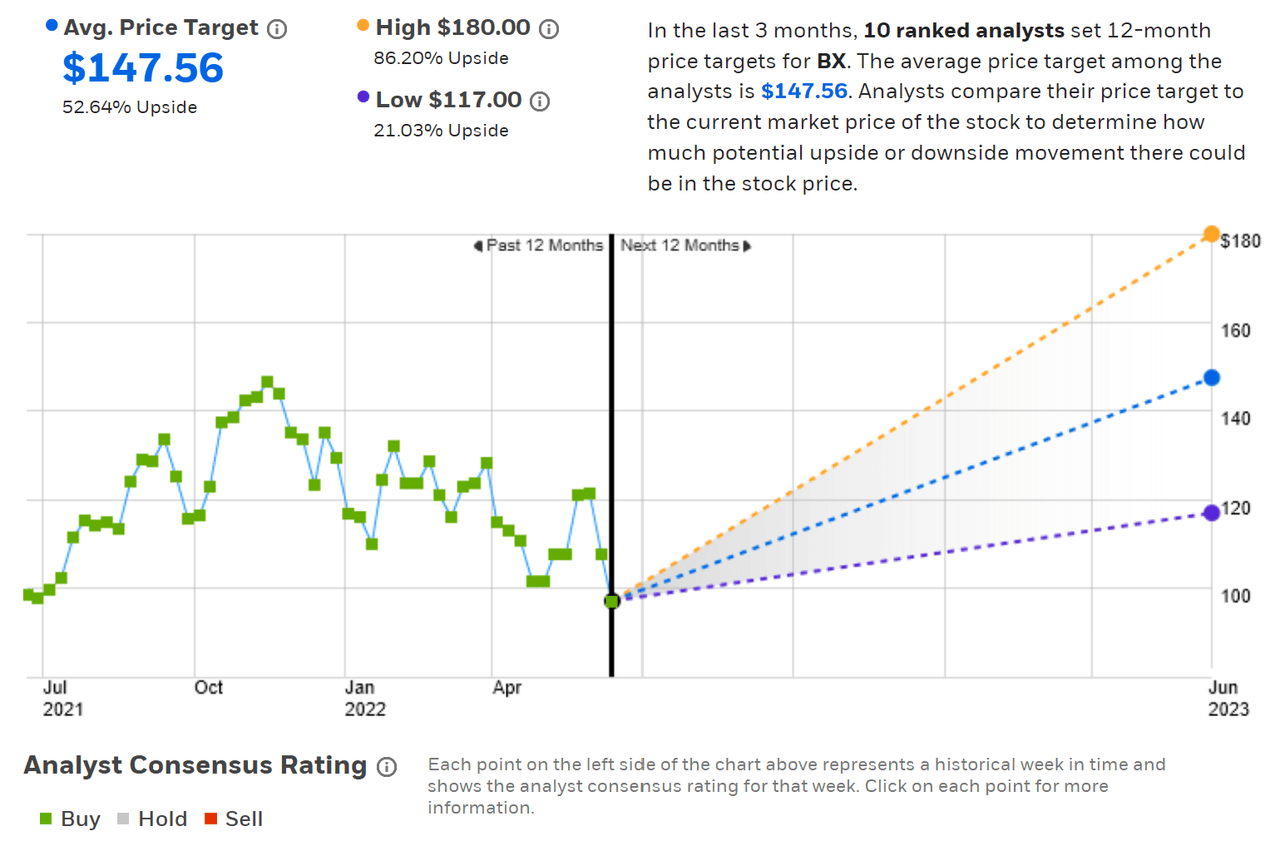
Wall Street analyst consensus rating and 12-month price target for BX (Source: ETrade)
Seeking Alpha’s version of the Wall Street consensus is calculated using ratings and price targets from 16 analysts who have published opinions over the past 90 days. The consensus rating is bullish, and the consensus 12-month price target is 50.6% above the current share price.
Seeking Alpha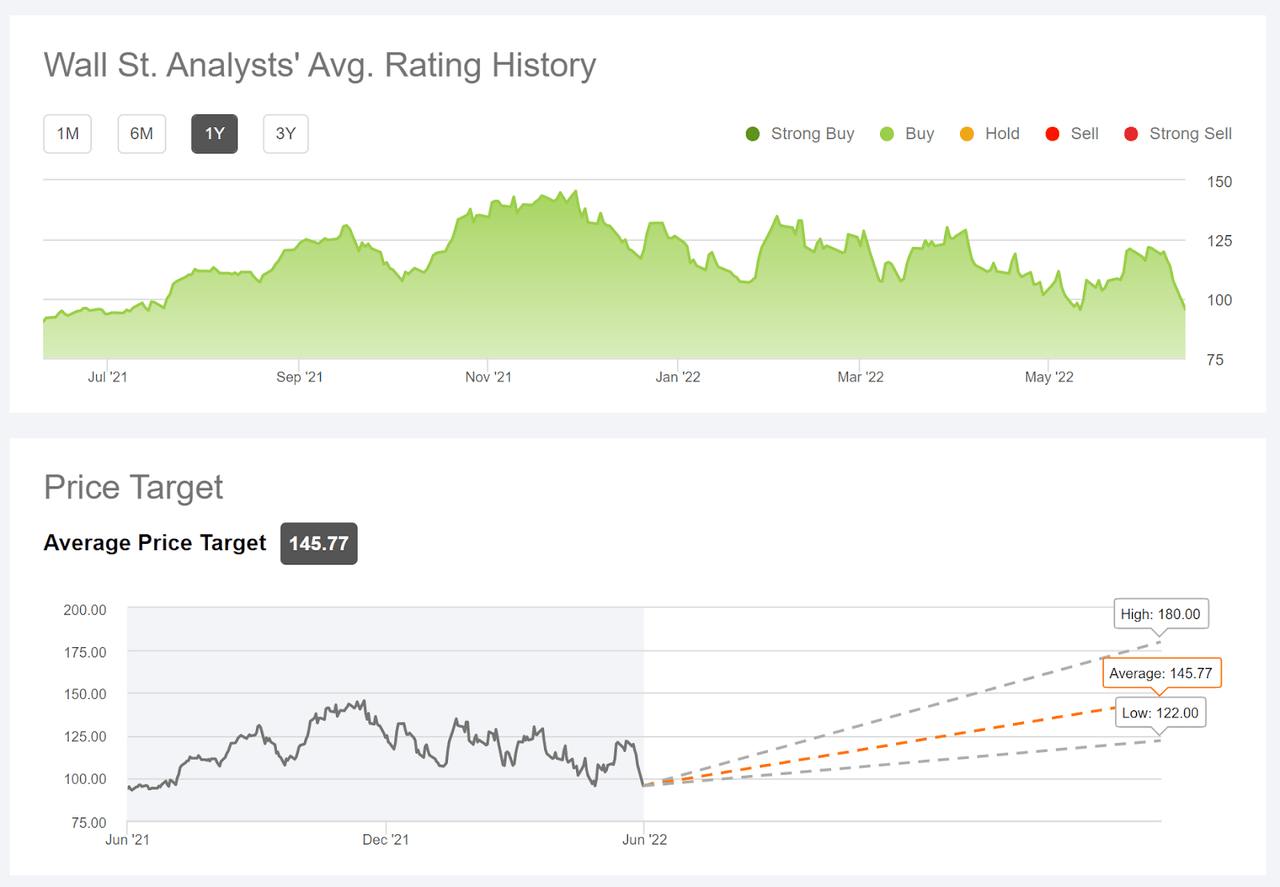
Wall Street analyst consensus rating and 12-month price target for BX (Source: Seeking Alpha)
The prevailing view among the Wall Street analysts who follow BX is that the shares have been oversold in the current market drop. The current spread between the consensus price target and the share price is unusually large as compared to the range of values over the past 5 years.
Market-Implied Outlook for BX
I have calculated the market-implied outlook for BX for the 7.2-month period between now and January 20, 2023, using the prices of call and put options that expire on this date. I selected this specific expiration date to provide a view through the end of the year and because the options that expire in January tend to be among the most actively traded.
The standard presentation of the market-implied outlook is a probability distribution of price return, with probability on the vertical axis and return on the horizontal.
Geoff Considine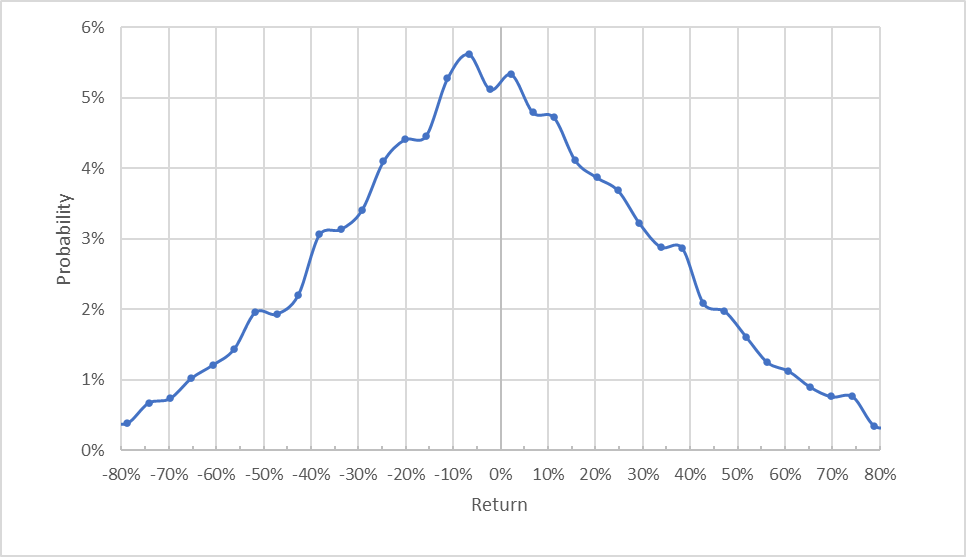
Market-implied price return probabilities for BX for the 7.2-month period from now until January 20, 2023 (Source: Author’s calculations using options quotes from ETrade)
The market-implied outlook to early 2023 is generally symmetric, with comparable probabilities for positive and negative returns of the same magnitude, although the peak in probability is slightly tilted to favor negative returns. The maximum probability corresponds to a price return of -7%. The expected volatility calculated from this outlook is 49% (annualized).
To make it easier to compare the relative probabilities of positive and negative returns, I rotate the negative return side of the distributions about the vertical axis (see chart below).
Geoff Considine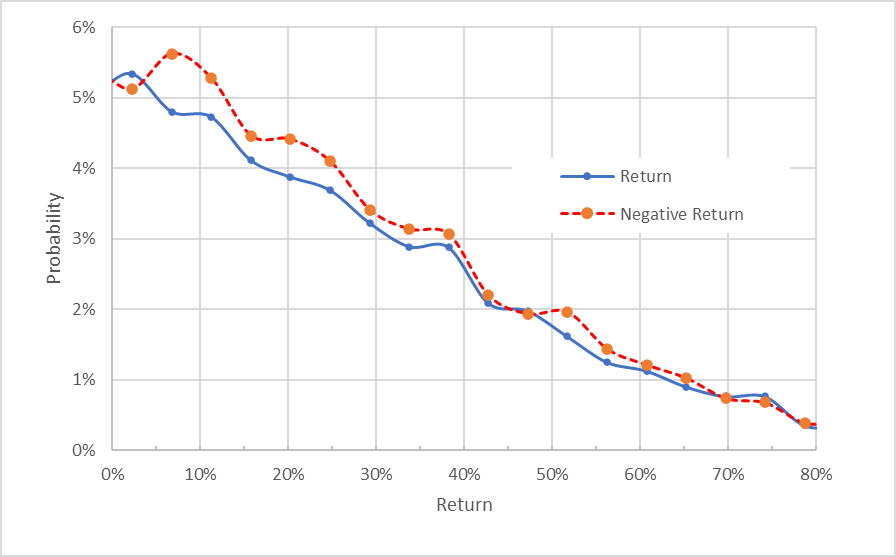
Market-implied price return probabilities for BX for the 7.2-month period from now until January 20, 2023. The negative return side of the distribution has been rotated about the vertical axis (Source: Author’s calculations using options quotes from ETrade)
This view shows that the probabilities of negative returns are slightly elevated relative to positive returns of the same size, although this effect diminishes for larger magnitude outcomes.
Theory indicates that the market-implied outlook should be somewhat negatively biased because investors, in aggregate, are risk averse and thus tend to pay more than fair value for downside protection. There is no way to measure whether this effect is present, but the potential for a negative bias means that this market-implied outlook is best interpreted as neutral.
Summary
Blackstone has seen its share price fall by more than 35% since hitting an all-time high late in 2021, even though the recent quarterly earnings have been strong and considerably higher than in previous years. Management is confident that the company’s portfolio is well-positioned for high inflation and rising interest rates, but the sell-off suggests that the market is not convinced. The Wall Street analyst consensus rating for BX is bullish, as it has been for all of the past year. The consensus 12-month price target is 51.6% above the current share price (averaging the numbers from ETrade and Seeking Alpha) for an expected total return of around 56% over the next year. As a rule of thumb for a buy rating, I want to see an expected total return that is at least half the expected annualized volatility (49%). Even cutting the consensus price target in half, BX exceeds this threshold. The market-implied outlook for BX is neutral. Considering the earnings growth trajectory, the bullish Wall Street outlook, and the neutral market-implied outlook, I am assigning a buy / bullish overall rating for BX.
Be the first to comment