

kanawatvector
The BlackRock Science and Technology Trust (NYSE:BST) is a closed-end fund (CEF) that was obliterated in 2022. YTD BST has declined -31.52% as it’s underperformed the SPDR S&P 500 Trust ETF (SPY) and the Invesco QQQ ETF (QQQ). BST has been an appealing CEF as it’s managed by BlackRock (BLK) and invests at least 80% of its total assets in equity securities issued by science and technology companies. This strategy hasn’t worked out well in 2022, as this fund focuses a portion of its assets on companies with rapid and sustainable growth. A portion of its portfolio is dedicated to science and technology companies with advantageous dividend yields, and its managers utilize writing covered calls to generate additional income. BST’s steep decline has pushed its dividend yield to 8.48%, which makes it an interesting income play for the moment while investors wait for a rebound in the markets.
Seeking Alpha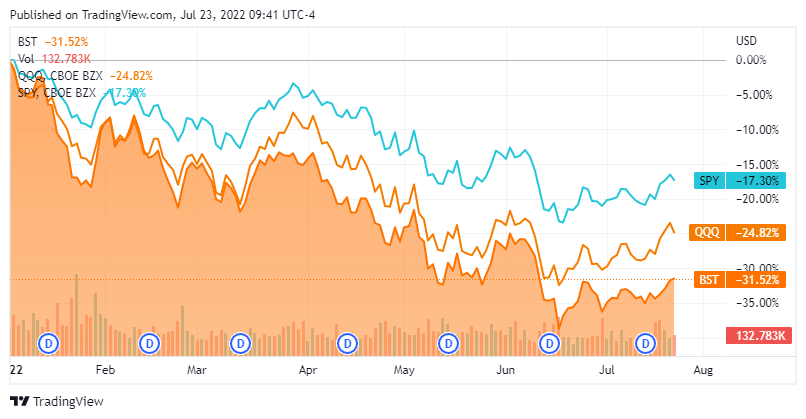
BST could be bottoming and this may be the time to start a position or dollar cost average into an existing one
Pre-covid, BST had formulated a track record of outperforming both SPY and QQQ. Once the covid-crash rebound started in mid-2020 BST outperformed SPY until the end of 2021, then in 2022 has declined further than both SPY and QQQ. The past 2 weeks have looked as if a potential bottom is forming, and now may be the time to consider BST.
Seeking Alpha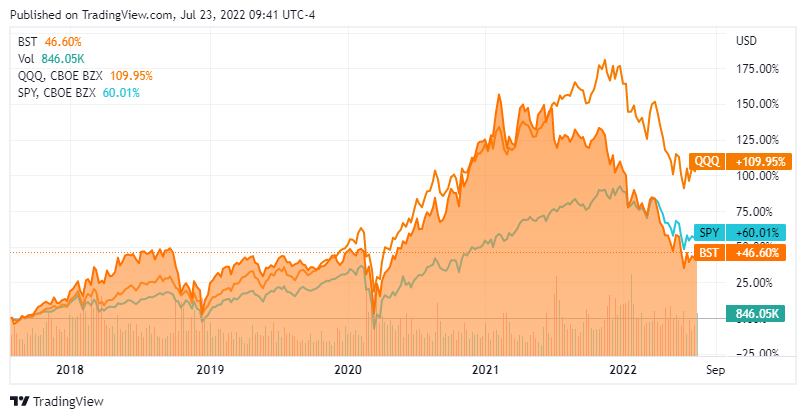
A market is usually not considered a true “bear” market unless it has fallen 20%. In a bear market, share prices are continuously dropping. This results in a downward trend that investors believe will continue. Outside of energy, many investments have declined, and we have been living in a bear market while some would contest that it’s actually a recession. History has shown that bear markets have proven to be good buying opportunities for long-term investors, but the opportunity may not unfold for some time.
Investopedia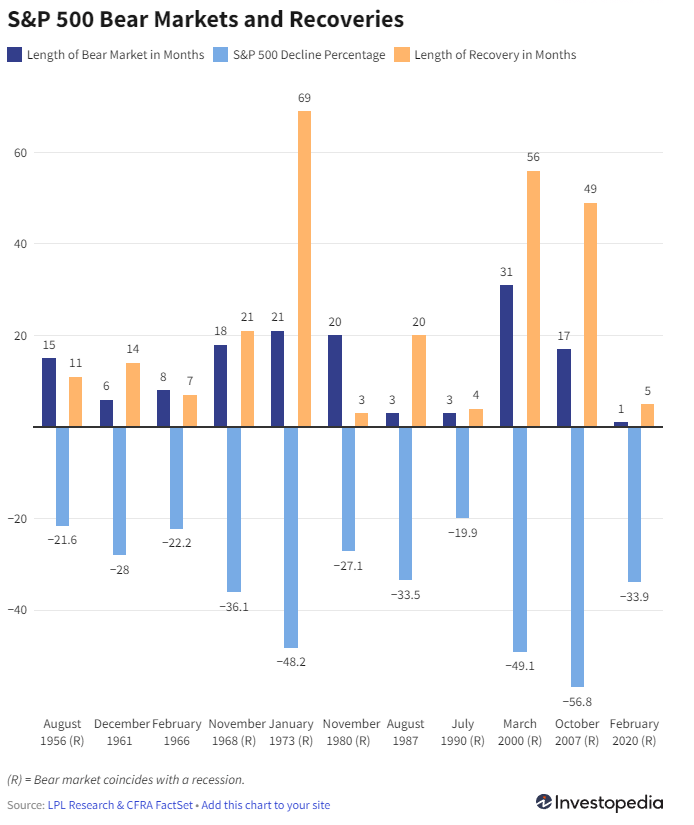
Excluding the current bear market, since 1956, the previous 11 bear markets have had an average length of 13 months, with 3 bear markets lasting fewer than 5 months. The longest bear market was in 2000, as it lasted just over 2.5 years (31 months). The average decline was -34.2%, with the steepest decline coming in 2007 at -56.8%.
The bull markets which have followed these bear markets have consistently generated positive returns. In the previous 11 bull markets, the average return has been 158.21%, with the last 5/6 bull markets reaching triple-digit returns. The smallest bull market since 1970 has generated a 64.8% return which was an additional 31.3% from the amount the S&P fell during the previous bear cycle.
CNBC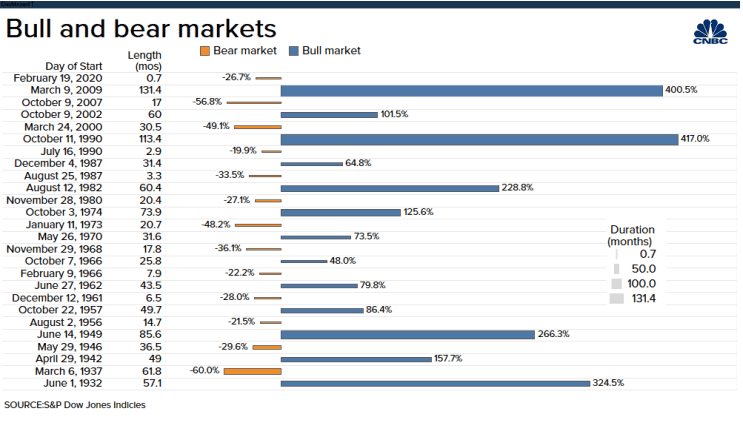
We’re on the cusp of a make-or-break earnings week with Apple (AAPL), Amazon (AMZN), Alphabet (GOOG) (GOOGL), Meta Platforms (META), and Microsoft (MSFT) all reporting. The commodity markets are starting to cooperate with the markets as the 9.1% CPI print could have indicated a top in inflation. We have seen the annual core inflation rate slow for the 3rd consecutive month in June to 5.9%, which is the lowest it’s been since January. The core inflation rate tracks changes in prices that consumers pay for a basket of goods which excludes food and fuel costs.
Trading Economics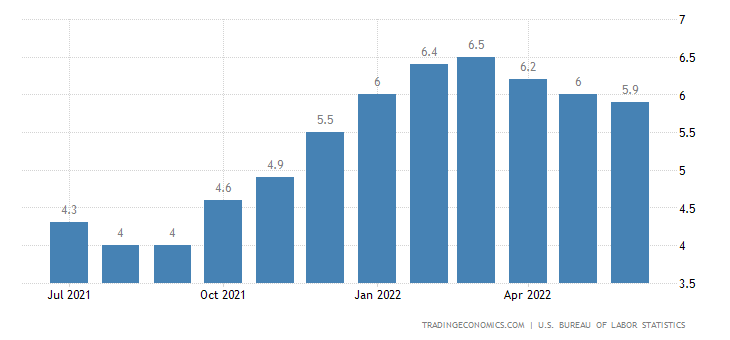
Many different segments of the energy market have declined over the past month, and the declines haven’t made their way to the consumer yet:
- Crude -6.77%
- Gasoline -11.97%
- Heating oil -18.06%
- Ethanol -10.96%
- Propane -5.69%
The same thing is occurring throughout the metals, agricultural and industrial markets. Here are some key metrics that have declined in the past month:
- Steel -10.73%
- Copper -10.44%
- Iron Ore -11.97%
- Soybeans -4.83%
- Wheat -20.04%
- Milk -7.29%
- Orange Juice -8.03%
- Coffee -11.08%
- Oat -17.80%
- Corn -15.37%
AAPL, MSFT, GOOGL, and AMZN make up 16.08% of BST. AAPL and AMZN have both appreciated by more than 10% from their lows in the past month, and if it wasn’t for Snap’s (SNAP) earnings, all 4 of these companies would probably be in positive territory over the past month. Ultimately BST is going to follow the markets, and the markets may be signaling that we have bottomed. There are certainly several variables that could impact the start of a sustained rally. If big tech can generate good earnings with upbeat forecasts, it may be enough to solidify the start of a meaningful rally as commodities have been coming off of their highs.
Seeking Alpha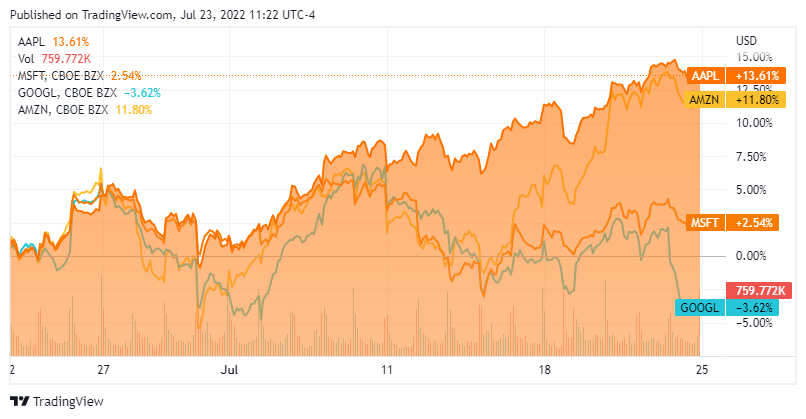
BST provides interesting prospects for capital appreciation and income mixed into one fund
In 2022 nothing has really worked, and many ETFs and CEFs have declined in value. Now is the time to do the research and see which ones are in a position to rally when the markets turn. BST invests in equity securities, including common stocks, preferred stocks, convertible securities, warrants, depositary receipts, ETFs, and equity interests in REITs and MLPs. BST looks to follow a call options writing strategy intended to generate current gains from options premiums and to enhance risk-adjusted returns. The strategy involves writing both covered and other call options.
BST currently has a gross expense ratio of 1.05%. The fund has $1.14 billion of net assets spread across 116 holdings. The majority of its holdings originate in the U.S as 76.75% of its portfolio is from domestic companies. Its largest international sectors are China (3.07%), the Netherlands (2.11%), and South Korea (1.98%). BST has diversified global exposure and looks for emerging winners throughout the technology sector regardless of its market cap.
BST’s appreciation objective has certainly been impacted during the market’s decline, but its income generation aspects have remained intact. To date, BST has declared 7 distributions of $0.25 each and, by the end of July, will have paid $1.75 to its shareholders throughout the year. BST has an annual distribution of $3, which is an 8.59% yield. BST has grown its distribution for 7 consecutive years and two large dividends in December of 2020 and 2021. BST has a 5-year distribution growth rate of 19.53% and is on track to deliver monthly income throughout 2022.
Seeking Alpha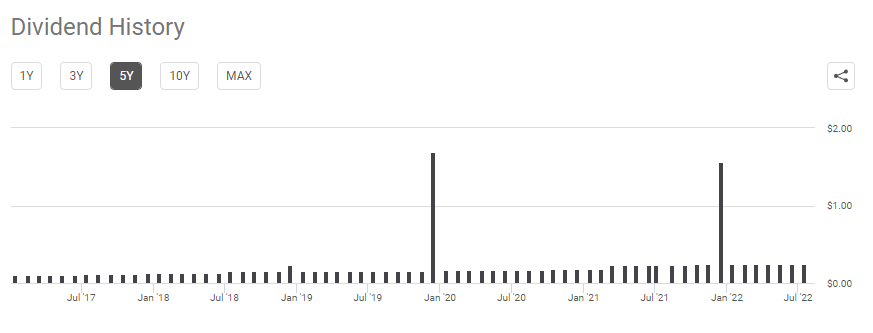
Conclusion
I think BST is an interesting CEF. It currently trades -1.47% below NAV and prior to 2022, had a track record that outperformed the S&P. I would look at BST as an income play with the prospects of capital appreciation when the markets rebound. The 2022 bear market hasn’t impacted its income generation as its projected distributions. BST is yielding 8.59%, so investors can generate monthly income while they wait for the markets to rebound. This week will be a good indication if a bottom has formed, but we won’t know until some time passes. With big tech set to report, this could be an opportunistic time to consider adding BST. If this is the start of a sustainable rally into the back half of 2022, I would be shocked if BST doesn’t follow the markets higher. Based on prior history, the markets will eventually rebound, and based on BST’s holdings, when it comes, there is a good chance it can outpace the market.
Be the first to comment