Bitcoin (BTC) pushes off multi-month lows after Chinese Ban
Bitcoin has had a rollercoaster week after the Chinese ban on cryptocurrency mining sent BTC prices plummeting. Chinese miners account for more than 50% of world Bitcoin production, which is why the ban has disturbed the market so severely. The country is experiencing many miners shifting operations outside of China to places such as Kazakhstan and Texas. Mining equipment in China is also being sold at a discount to pre-ban levels which is hurting many businesses along the mining production supply chain.
The ban does however create opportunities for foreign miners to fill the gap left by the drastic drop in Chinese mining and in turn profit from the additional mining reward.
BITCOIN (BTC) TECHNICAL ANALYSIS
Bitcoin daily chart:
Chart prepared by Warren Venketas, IG
The daily BTC chart above has kept within the rectangle pattern (yellow) as discussed in last week’s FinTwit update. Bears were unable to keep prices below the $30000 support handle – evident by the extended lower wick on Tuesday. There could be a retest of this level which could see some profit taking by bears and long entry orders by bulls. From current levels, bulls will be looking for a daily candle close above $35000 with a $40000 resistance target.
The battle between inflation and the labor market dominates Fed discussions
Federal Reserve Chair Jerome Powell reiterated his stance that inflation is transitory this week and more evidence will need to come from the labor market to spark potential future changes. He eluded to the fact that current inflationary pressure is not broad-based but rather the influence of a few inputs stemming from supply constraints. The labor statistics will be closely monitored and this emphasis was echoed by fellow officials in their statements during the week. The chart below shows the disparity between consistent rising inflation in both CPI, PCE and core PCE metrics while the NFP data (yellow) has been relatively subdued. This will likely dominate headlines over the coming months as it has throughout 2021. Labor data could give important clues as to the Fed’s next steps and financial market reactions in general.
NFP vs CPI vs PCE
Chart prepared by Warren Venketas, Refinitiv
$1 trillion infrastructure plan boosts SPX to record highs
The S&P 500 received a boost yesterday after President Joe Biden authorized a bipartisan infrastructure deal package to upgrade roads, broadband internet and other projects. Although the total $1 trillion amount is less than the $2.3 trillion proposed package in March this was a major breakthrough for the United States as he aims to mend the divided outlook between Democrats and Republicans.
The announcement bolstered a vast spectrum of stocks who could potentially benefit from the infrastructure plan such as basic materials etc. Financials also received support after the Fed’s annual stress testing results were released this week. This meant several limitations placed on banks will expire on June 30, 2021. Stress testing simply puts banks through a series of hypothetical situations to see whether or not they could maintain capital requirements should the respective scenarios take place.
With banks passing the stress tests, banking stocks have led the way further adding to SPX upside.
S&P 500 (SPX) TECHNICAL ANALYSIS
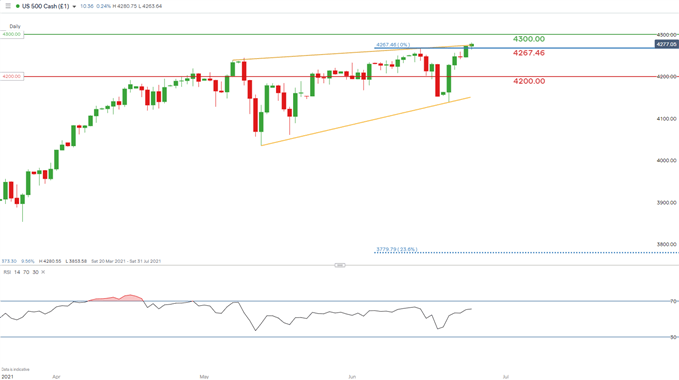
SPX daily chart:
Chart prepared by Warren Venketas, IG
The daily SPX chart above may be forming a rising wedge pattern (yellow) as prices reach new highs. June 15 swing highs have now been surpassed opening up room for the 4300.00 psychological level.
The Relative Strength Index (RSI) is suggestive of bearish divergence which simply put refers to the movement of price and RSI moving in opposite directions. In this case, SPX prices are moving higher while the RSI is falling. Generally, this points to upcoming downside however the time frame associated with divergence can be unclear. A break below 4267.46 could see prices pullback toward 4200.00 support and a further break below wedge support could spark significant downside off these record levels.
— Written by Warren Venketas for DailyFX.com
Contact and follow Warren on Twitter: @WVenketas


Be the first to comment