

koto_feja
Investment Summary
In the time since our last publication on BioLife Solutions, Inc. (NASDAQ:BLFS) six months ago, there’s been negligible movement in its equity value. Shares have drifted ~300bps to the downside since that report. Following our latest analysis on the company, I’m here to report that we continue to rate BioLife Solutions, Inc. stock a hold. In this publication, I’ll be referring to the latest findings, and provide more detail on our position. We highly encourage you to read our last publication on BLFS by clicking here. Net-net, we continue to rate BLFS a hold.
Exhibit 1. As the BLFS share price pushed lower across H2 FY22′, the covariance to the S&P 500 surged to more than 3x. This presents a risk to investors in the event of further breakdown in the benchmark.
Data: Updata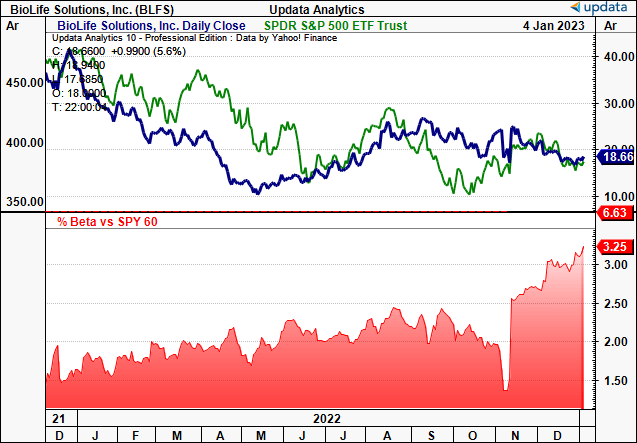
Q3 numbers underline broad market challenges
We first noted that BLFS reported total revenue of $40.7mm in Q3 2022, representing a 21% YoY increase, on adjusted EBITDA of $1.4mm, down from $2.2mm in Q2 FY22′. As such, the core business grew 18% YoY, helped by a 900bps contribution from COVID-related revenue. You can see the sequential revenue ramp for BLFS from FY18–date in Exhibit 1a. Swinging back to the quarter, the takeouts underpinning our reiterated hold rating include the following:
- For us, the standout performer was BLFS’ biopreservation media segment, with the platform exhibiting particularly strong revenue upside of 50% YoY to reach $16.6mm. In contrast, the freezers and thaw systems platform saw total and organic revenue decline by 13%. It’s also worth highlighting the reasonably strong performance in both the cell processing and storage, and storage services divisions, clipping revenue upsides of 57% and 56% YoY respectively.
- Looking vertically below the top-line, we’d note that Q3 gross margin saw compression of ~20bps sequentially from Q2, but was up ~800bps YoY. Management said the sequential downstep in gross margin stemmed from “supplier quality issues,” coupled with large customer order where the customer received a significant discount, thereby contracting gross margin.
- Meanwhile, OpEx for the quarter were $52.2mm, compared to $45mm in Q3 FY21′. Looking at the 9 months to September 30 2022, reported OpEx lifted to $212.8mm, baking in a non-cash impairment charge related to the Global Cooling acquisition. As such, the adjusted operating loss for the first nine months of 2022 was $20.2mm, versus a loss of $7.5mm in the same period in 2021.
- Turning to liquidity and capital budgeting, the company secured a loan facility of $50mm from Silicon Valley Bank, with the option to draw an additional $30mm prior to June 30, FY23′. That was secured back in September of FY22′. The loan has a maturity date of June 1, FY26′, which may be extended to FY27′, depending on certain criteria. The interest rate on the loan is determined as, the greater of 5.75%, or the Wall Street Journal Prime rate plus 50 basis points headroom [this is just the base rate appointed by at least 70% of the largest U.S. banks]. Hence, the overall interest rate cap is 100bps above the timing of the advance. Moreover, we’d point out that the initial $20mm advance has an interest rate ceiling of 700bps, and does not have any financial covenants. Upon repayment of the loan in full, the company will pay an additional 5.75% of the total principal amount that was extended.
- Taking a look at the deployment of capital, cash usage comprised CapEx of $3.9mm toward the expansion of its biorepository facilities, and a debt liability repayment of $1.8mm. To this, it realized CFFO of $1.5mm for the quarter.
Exhibit 1a. Revenue upsides have plateaued since mid FY22, meaning Q4 FY22 numbers are a key inflection point.
Data: HBI, Refinitiv Eikon, Koyfin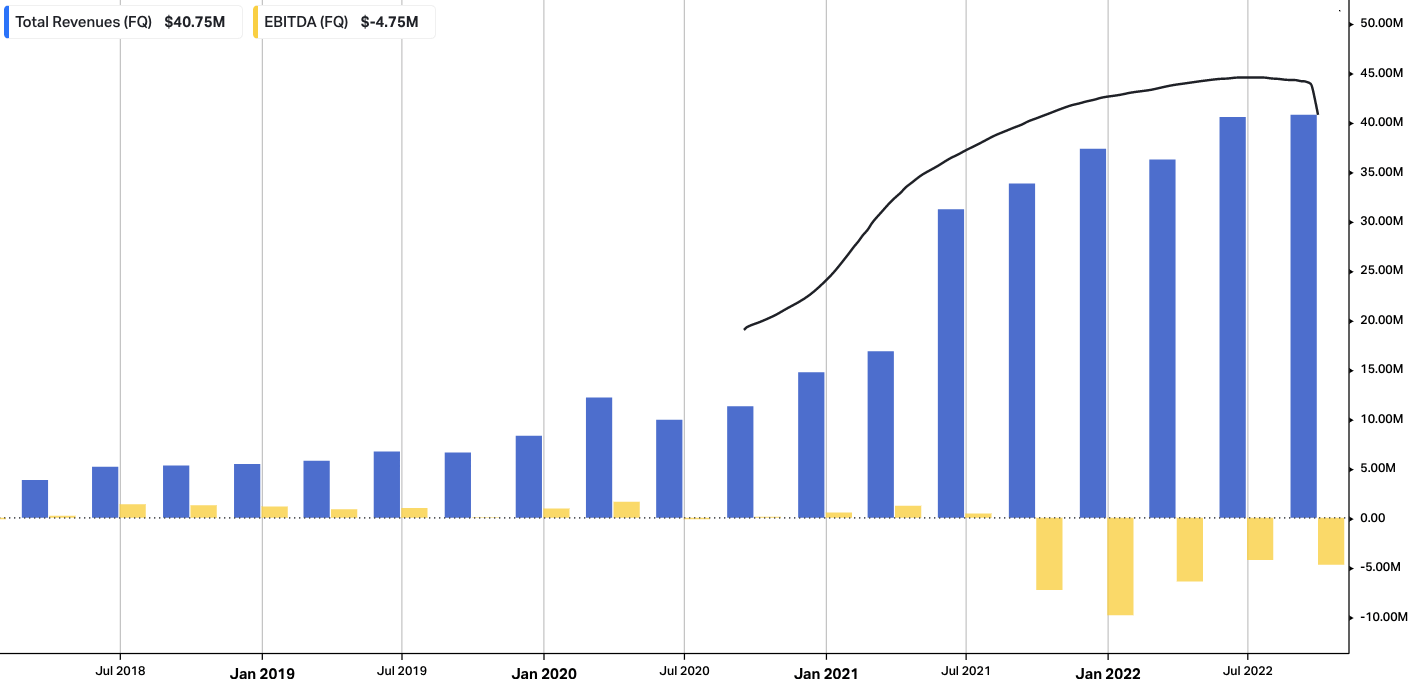
Talking finally of its FY22 outlook, management revised FY22 revenue guidance to the downside, now projecting a range of $160mm–$164mm, calling for YoY growth of 34%–38%. This would also call for organic growth of 37%–40%.
The breakdown of this includes revenue assumptions for the cell processing platform between $67mm and $68mm, a YoY increase of 49% to 51%. The new forecasts fold in a diminishing impact from COVID-related revenue, estimated to fall at a margin of ~7%–8% of turnover. Moreover, the freezers and thaw systems enterprise is expected to see revenue of $66mm to $68mm, with total growth of 17% to 20%, whilst the storage and storage services platform is anticipated to have revenue of $27mm to $28mm, with total and organic growth of 54% to 59% over 2021. Noteworthy, is that COVID-related revenue is expected to attribute 40%–45% of this platform’s revenue. Because these estimates for COVID-revenue are contractual, it’s unlikely these won’t fluctuate.
However, management acknowledge supply chain challenges may result in delays for certain orders, which are expected to be shipped in Q1 2023. We’ll delve a little bit more into this in the section below.
Inventory build-up a key performance indicator leading into FY22 earnings
It’s worth highlighting that, during Q3, the company gained access to 193 new unique customer sites across its 3 platforms. We’d also point out that most of BLFS’ revenue is generated from its existing customer base. As such, the company aims to increase its share of expenditure on manufacturing, storage, distribution, products, and services, to expand on this base.
Still, during Q3, the company gained the following additions across its various segments:
- 14 new biopreservation media customers,
- 11 new ThawSTAR users,
- 12 new EVO Cold Chain end users,
- 14 new Cryogenic Freezers and Accessory Customers,
- 114 new Sterling ULT Freezer and Accessory customers,
- 18 new BioStorage customers, and
- 10 new Cell Processing customers.
Consequently, EVO shipments exceeded the 2,000 mark in Q3, a 100% increase from the same quarter last year, with ~3/4 of these shipments for approved therapies, and the remainder being for clinical trials. It also estimates that its biopreservation media products have “been used in or are planned to be used in 570 customer clinical care applications.”
At the same time, management estimates that it takes 3-5 years for new customers in the biopreservation media segment to have a meaningful impact to its respective line items. Specifically, it takes these customers that long to reach regulatory approval in the preclinical stage. As such, the point on supply chain headwinds mentioned in earlier sections rings true here, and we see evidence of this looking at inventory movements across the year.
For those observing Exhibit 2, you’ll see that inventory movement for the period grew at a slower pace than revenue and NOPAT production. Whereas inventory totals lifted 19% [$5.4mm] from December FY21′ through September FY22′, revenue clipped only a 9% or $3.44mm increase over the same time, a 57%/$1.96mm difference between the pair. The growth in inventory versus NOPAT was 390bps, or $202,000.
More curiously, we saw that the bulk of the inventory increase was comprised of a 65% increase in finished goods. To us, this speaks further to the supply chain headwinds mentioned, and BLFS’ ability to turn over inventory into cash, and/or sales. Moreover, we believe this is a key performance indicator to benchmark the company against for its Q4 and FY22 numbers. Why? Because if inventory values increase at higher percentages vs. revenue and NOPAT again, we’d be calling into question the company’s cash conversion underlying its booked revenues.
On this point, its inventory turnover was in range last period at 3.2x, but the YoY days sales outstanding lifted to 73 days from 56 days in Q3 FY21′, and the cash conversion cycle lifted from 118 days to 145 days over the same period.
Exhibit 2. Inventory build-up is a key metric investors should focus on for BLFS in order to benchmark against sales, NOPAT and CFFO growth.
Data: Author, BLFS SEC Filings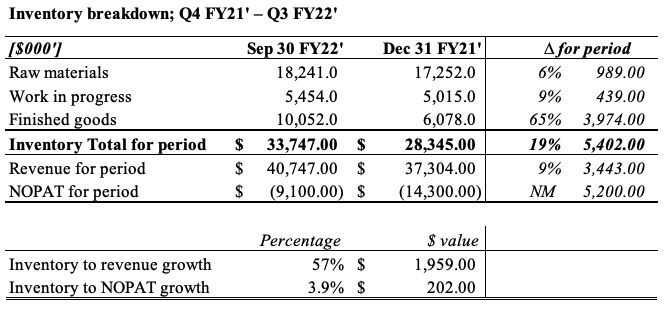
Valuation
There’s a number of points that immediately standout in the BLFS valuation debate. First, BioLife Solutions, Inc. stock is trading at 1.95x book value of equity, which may or may not represent a value proposition.
However, it should also be noted the breakdown of its book value of equity, comprised of $487.7mm in assets and $79.4mm in liabilities, totaling $408.25mm in equity.
But of the asset base, 46.1% or $224.75mm is reported as goodwill, with another $74mm in intangibles, so a total of $298.75mm of equity value tied up into intangible value. These are difficult to quantify and must be provisioned each quarter and annum. Hence, good luck selling goodwill if it comes down to it. You can see the breakdown of BLFS’ goodwill provision in Appendix 1.
Recalculating for tangible book value, net-net, there’s $109.5mm. As such, BLFS is trading at ~7.29x its tangible book value of equity, leading to no evidence of mispricing [7.29x $2.56 in tangible book value per share = $18.6], and, with a negative trailing ROE of 23.2%, we don’t see the prospect of valuation upside in this name. Hence, this confirms our neutral view.
Appendix 1. BLFS Gross Asset Position, as of Q3 FY22′ [note: Goodwill line].
Data: BLFS Q3 FY22′ 10-Q, pp.4, see: “Part 1, Item 1: Financial Statements”.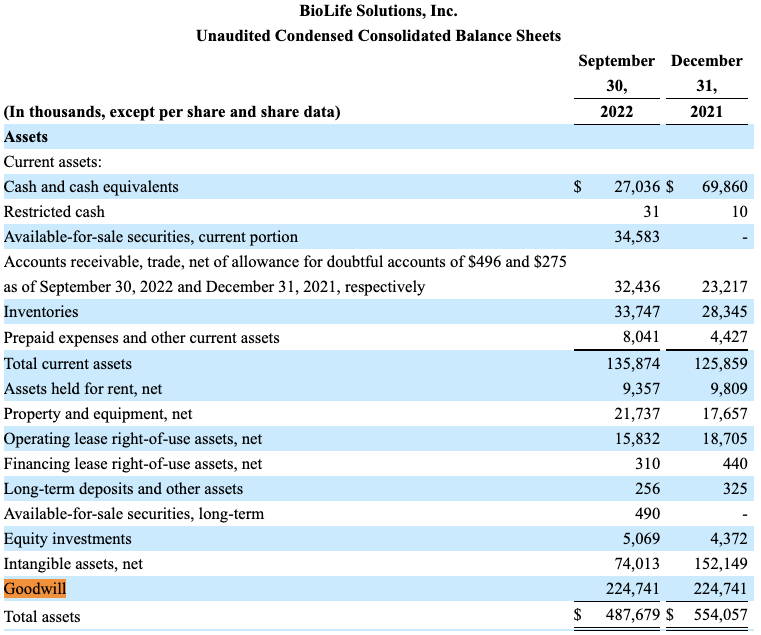
In short
Net-net, we continue to rate BioLife Solutions, Inc. a hold. Previously, we noted that Wall Street looked overly optimistic about the mid-term growth potential in BioLife Solutions, Inc., and we carry this stance through to today. In that vein, there are more compelling value opportunities within med-tech and biotech elsewhere, by our estimation.
Be the first to comment