


Solskin
Investment Summary
From the Portfolio Manager’s Desk
It must be said that the Bio-Rad Laboratories, Inc. (NYSE:BIO) share price has caused some pain for our portfolios in 2022. Longs of BIO are down 23% in the last 12 months as the Sartorius AG/Bio-Rad arbitrage opportunity looks to have completely unwound for now. Whilst BIO continues to reside onwards, fundamentally sound, a key fulcrum to its value proposition has been quashed with the breakdown of this trade. Here we’ll demonstrate the relationship between BIO’s and Sartorius’ equity, the tightness of the fit – and how it’s unravelled in FY22 – leading to heavy losses for BIO investors playing it from this angle.
Exhibit 1. BIO 12-month price action
Price action looks to be long-term bearish
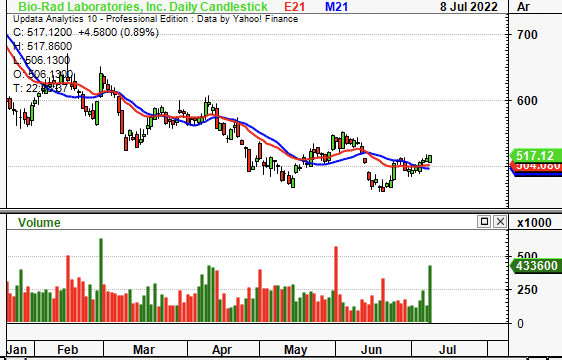
Image: HB Insights. Data: Updata
Investment Thesis Summary
After the stock nudged a 52-week high of $832.70, BIO has since pulled back to a low of $518 on last check, in range with June–Oct 2020 levels. With the Sartorius differentiator removed from the equation, the premium attached to BIO is gone, meaning it now has to stand up on its own two feet against the wider macroeconomic backdrop. We’d argued this back in 2020 here and here and now and now is the time for it to sink or swim.
Those investors buying it for the Sartorius arbitrage will have to price additional risk into that trade, and take a contrarian view. Whereas those buying BIO on its quality factor should look to scale in on the upside in share price, waiting for a reversal out of trend. Here we illustrate these points, plus the macroeconomic backdrop as it relates to BIO. Rate hold PT $515 on blend of inputs.
BIO to be bottom-heavy against macro-backdrop
A quick discussion about the macro-drivers that are set to impact equity returns from FY22 it warranted first. This is imperative to illustrate BIO’s challenges looking ahead. Firstly, whilst the valuation spread enjoyed by value strategies has returned in 2022, growth names have outperformed in July and now offer price-premium over lagging value-stocks, seen below.
Exhibit 2. S&P 500 Growth (red) vs. S&P 500 Value (blue), price premium
Growth enjoying a bid over value late into H2 FY22

Image: HB Insights. Data: Updata
The long-end of the treasury curve has also caught a bid in July and is testing support, as investors balance the prospect of near-term recession or long-term inflation. Yields on the 10-year to 30-year with crept up following US jobs data with nonfarm payrolls outpacing estimates by ~21%. The belly and tail of the curve has held ~3% and raises interesting questions. Strong US jobs data (alongside other economic indicators) points to strength in the US economy, meaning inflation risk is likely to be a downside risk heading forward. However, to compress CPI prints the FED/ECB/RBA etc. must continue on their hiking trajectory, increasing recession risk in doing so. Should one believe we are to enter into a recessionary world in the next 12 months, long-dated bonds look very attractive right now, and will be priced to compensate any inflation risk.
Hence, looking ahead for equities, if the 25–75bps hiking cycle continues, exposure to short-duration, low-beta looks to be the profitable trade as investors step up in quality and liquidity. Growth is the real wildcard (as yields dictate its trajectory), and the growth/bond correlation looks to have rolled down somewhat in July. BIO tick’s the bill on 2/3 of these requisites. However, those familiar with the name will know its exposure to Sartorius has been the key differentiator to date.
Exhibit 2. Long-end has caught a bid lately and growth/bond correlation may have rolled over in July
It then becomes a rates story as central bank tightening dominates the market
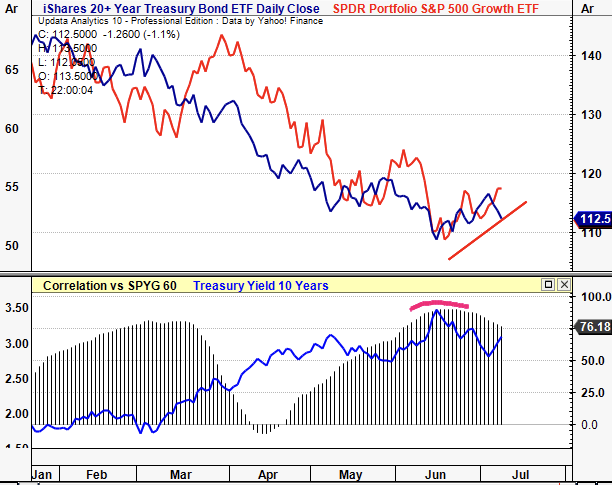
Image: HB Insights. Data: Updata
If it is to become a rates story, then we need further corroboration of the inflationary narrative on a forward-looking basis. Spot inflation, i.e. today’s print, is thankfully dislocated from the market’s view of ~2.6% in the 5y5y breakevens. This may undershoot or overshoot that level, nevertheless, there’s room for spot CPI rates to creep towards this mark.
Moreover, Brent Crude and copper have retraced from highs with copper especially signalling a slowdown in producer pricing. Brent Crude has set lower highs and looks to be squeezed to the downside. Moreover, US TIPs have been repriced to the downside and now trade in-line with FY19 levels (Exhibit 3). With Brent and copper both leading indicators of industrial pricing activity, the data suggests the market is pricing a further run-down in inflation. That challenges the notion of rate hikes continuing for too much longer, providing a solid underweight for profitable medical technology (“medtech”) names like BIO to re-rate and push back towards previous highs. These are factors to consider with equity positioning with names like BIO.
Exhibit 3. Brent Crude and copper retracing back below previous lows and suggesting lower pricing pressure heading forward
US TIPS providing supplementary data of this with investors pricing these back at FY19 levels
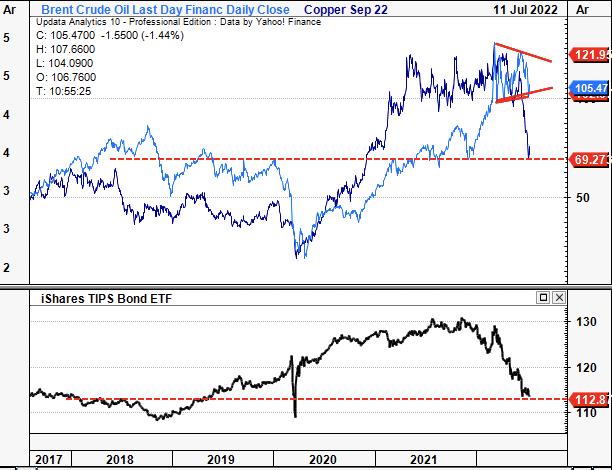
Image: HB Insights. Data: Updata
Moreover, US large-caps have regained strength relative to the commodity sector. Investors are rotating back out of commodities and repositioning in equities. As the benchmark heads sideways key commodity baskets are relatively weakening (Exhibit 4) offering investors relative upside premium in large-cap equities such as BIO.
Exhibit 4. SPY strengthening against commodity basket lending investors relative upside premium in large-cap shares
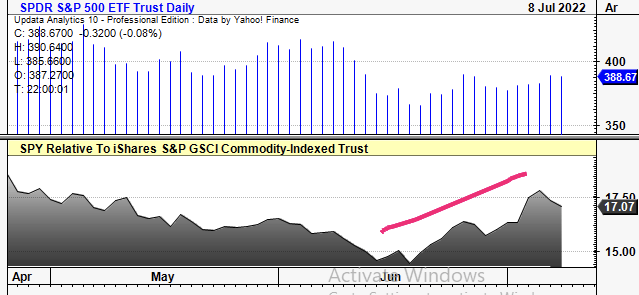
Image: HB Insights. Data: Updata
Meanwhile, the US dollar index (DXY) continues to rally and outperform most assets classes in 2022. It broke from a key resistance level in early 2022 as investors looked to step up in quality and reduce equity exposure. This has created a macro-divergence which we estimate could help the SPX re-rate via mean-reversion to the upside. However, a strengthening USD also has potential to create Forex headwinds on company income statements in FY22/FY23, by estimate. It also has potential to hurt US exports.
Exhibit 5. DXY has strengthened creating macro-divergence to SPX
Potential to large-caps to re-rate to the upside via mean-reversion
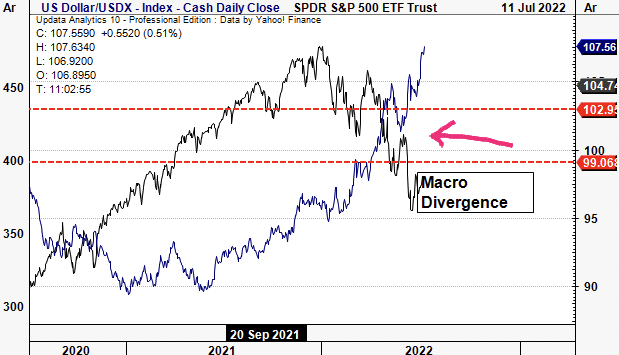
Image: HB Insights. Data: Updata
As a result, low-beta, high-quality plays have and will continue to offer long-term upside in the current macro regime. Balanced portfolios with a weighting towards alternatives have outperformed in FY22, partly because of their low-beta nature. Investors who’ve retained an alternatives weighting have therefore gained an effective equity hedge. As shown below, managed futures strategies have strengthened relative to the benchmark, whilst reducing equity beta to basically 0 in doing so.
Exhibit 6. Alternatives have offered investors reducing covariance structure whilst capturing upside in doing so
Low-beta, high-quality are the factors that look to be key in this regime
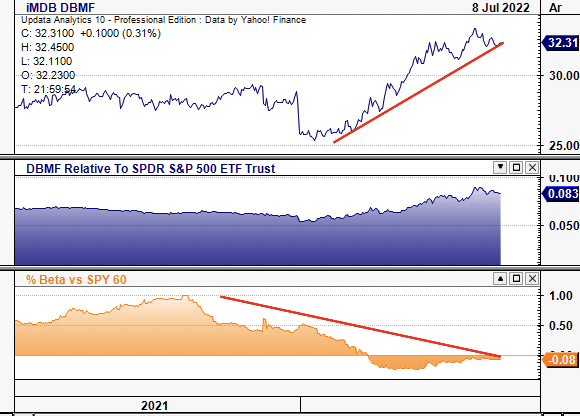
Image: HB Insights. Data: Updata
As we note with BIO, it doesn’t adhere to the premia that are driving equity returns on a forward-looking basis. As shown in Exhibit 7., it has lost relative strength to the SPX and this has occurred whilst the benchmark itself has been declining. This trend has been in situ since FY21, although stepped up in magnitude February this year, whilst the BIO share price rated lower. Meanwhile, the stock’s return correlation to the benchmark has increased markedly in the same time. This is a trend we’ve observed in countless stocks facing losses in 2022. This supports the point that high-beta is a negative factor and that BIO fits the bill here.
Exhibit 7. High-beta continues to de-rate in FY22 and offers little forward-looking upside as market losses compound
BIO’s shifting covariance structure opposes the premia driving equity returns this year
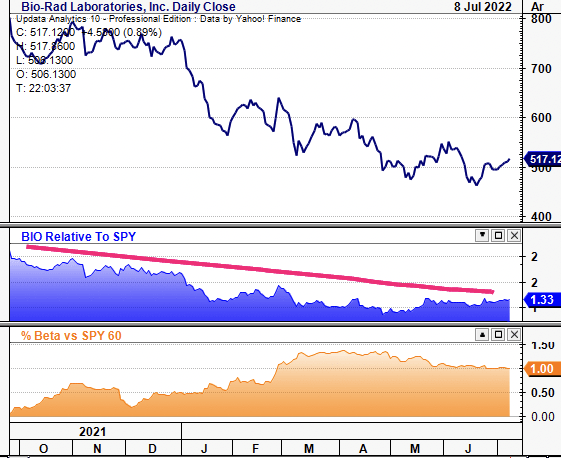
Image: HB Insights. Data: Updata
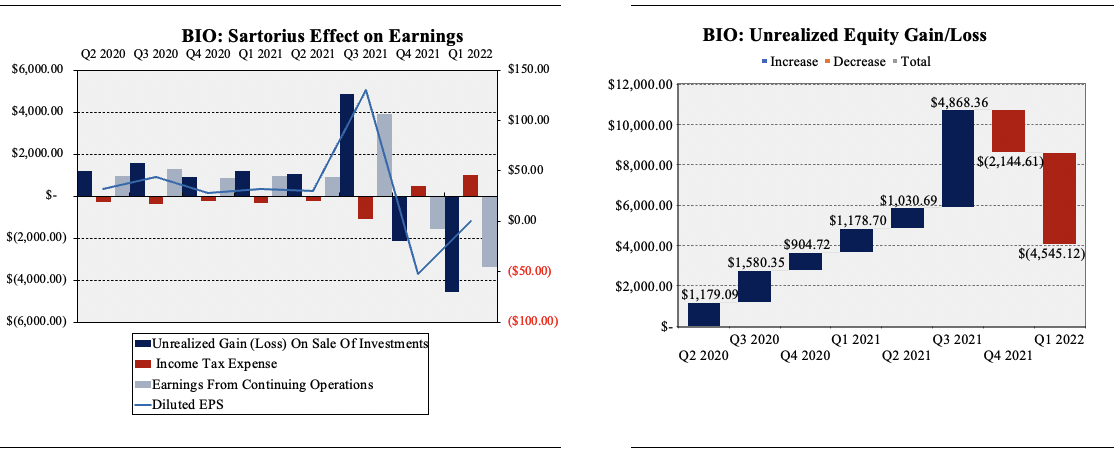
Which leads us into the most integral part of the BIO investment debate, its equity holding in Sartorius AG (“Sartorius”). It laid $10.4 million into Sartorius initially back in 2003, with the position now growing to 38% ownership of ordinary shares as of FY21, and 28% of preferred equity. It’s been an enormous compounder for BIO and fed substantial retained earnings to equity holders. This creates substantial operating leverage by ratcheting up earnings faster than the average ~6% top-line growth since FY18.
Herein lies the big dilemma for BIO. Firstly, it recognised a $31 million ($1.03 per BIO share) dividend from Sartorius in Q1 FY22. It recognized a $4.868 billion ($162/BIO share) gain on this position in FY21. However, markets turned against Sartorius in FY22. It reported a diluted loss per share of $112 in Q1 due to its loss on the Sartorius position. In total, it booked a loss of more than $4.5 billion ($150/BIO share) on the position, offsetting prior year’s gains (net $16/share). This has compressed earnings substantially, as unrealized gains on the Sartorius stake are accretive to BIO’s EPS.
Exhibit 8. BIO’s Sartorius position outlined
Booked extensive losses on the position last quarter
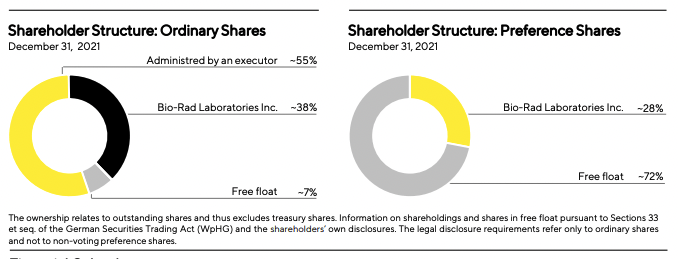
Image: Sartorius Aktiengesellschaft Q1 FY22
Chief to the mark down in BIO’s equity value was the performance of the Sartorius share price. It has been rocked in FY22 alongside the German DAX as Europe faces a plethora of geopolitical problems. Amid the global market selloff in January, both the DAX and Sartorius notched down at pace. Then, around the same time the European conflict started, both the DAX and the Sartorius share price jumped lower and continued in this trajectory.
Exhibit 9. Both the DAX and Sartorius have trebled lower since January-February
Sartorius (shown in green) set 3 x new 52-week lows in the last 3 months
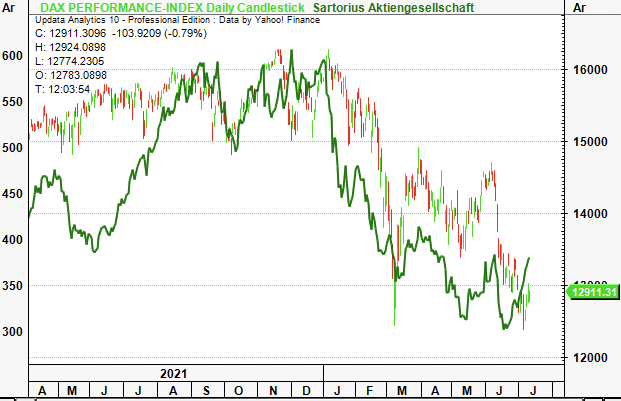
Image: HB Insights. Data: Updata
Adding further pressure to the situation is the Covid-19 situation in Germany. Cases have ticked up substantially in 2022 and have shown a resurgence in July, despite some recovery. The impact has been similar to any nation incurring a wave of the virus. Nevertheless, with Germany’s position as a medtech hub of Europe and the world, pressures have transposed over to the sector. Germany’s Covid-19 is said to have recovered to pre-pandemic levels according to management, whilst Covid-19 related sales continue to diminish, it said last earnings call. Nevertheless, it’s the economic pressure faced to the sector by an uptick in cases.
Exhibit 10. Germany’s Covid-19 situation continues to plague Sartorius’ share price, and therefore BIO’s
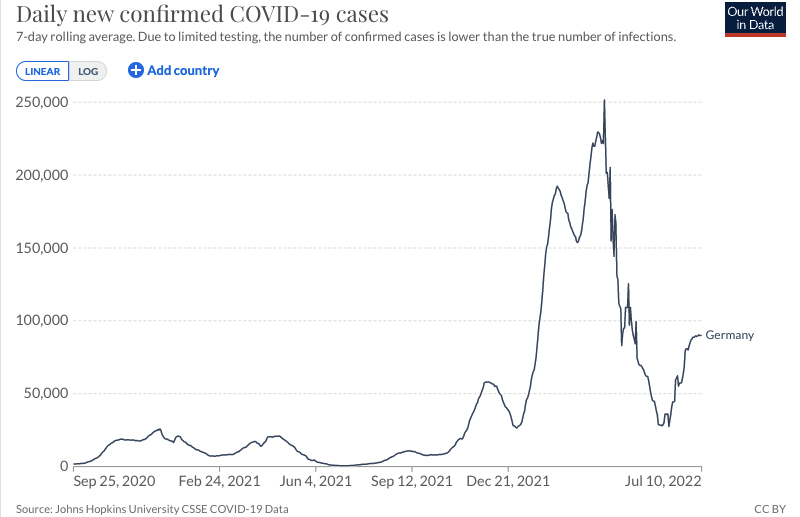
Image: Our World In Data
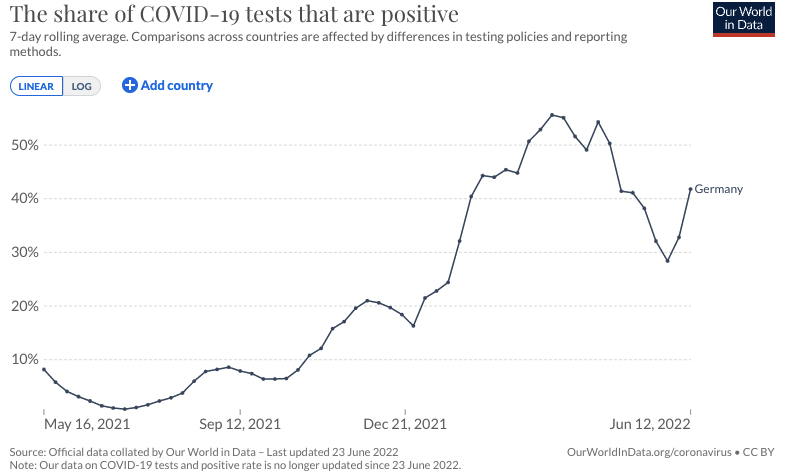
Image: Our World In Data
All of this information is incredibly important for our thesis on BIO. The stock has an undeniably tight causal relationship with Sartorius, with changes in the Sartorius share price responsible for ~71% of the changes in BIO’s share price over the past 3 years to date (Exhibit 11). Correlations have remained above 80–85% for that time as well and plotting the two’s price on time series reveals the minimal variance in dispersion.
Hence, immediately, the pricing risk of Sartorius is transferred onto BIO. Beforehand, investors were being rewarded handsomely for exposure to this idiosyncratic risk. However, now the market has shifted to a systematic risk profile. Combined with the DAX’s woes, this has compounded losses for the pair.
Exhibit 11. Breakdown in BIO/Sartorius arbitrage on the long side with the pair retracing to 2020 levels
Idiosyncratic premia offered by this tight relationship no longer present as market shifts to systematic risk profile
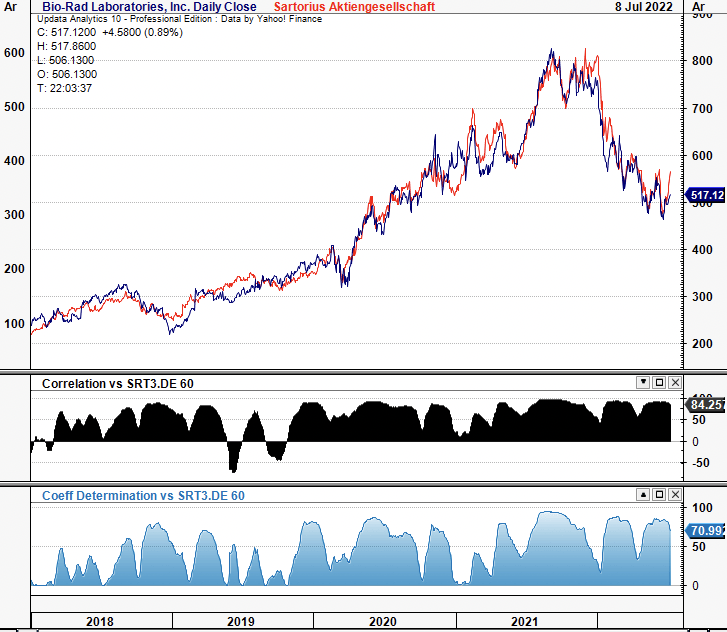
Image: HB Insights. Data: Updata
Fundamentally, BIO is sound, and printed quarterly operating income of $143.5 million in March. Operating margins have held tight at ~20% these past 2 years to date whilst FCF has remained buoyant as well, seen below. Sales growth has averaged 6% since FY18 whilst gross margins have held tight across this period as well. With gross margin of ~57% this provides adequate headroom to absorb cost pressures through the P&L.
Exhibit 12. Operating summary for BIO illustrates fundamental robustness to absorb macro-headwinds
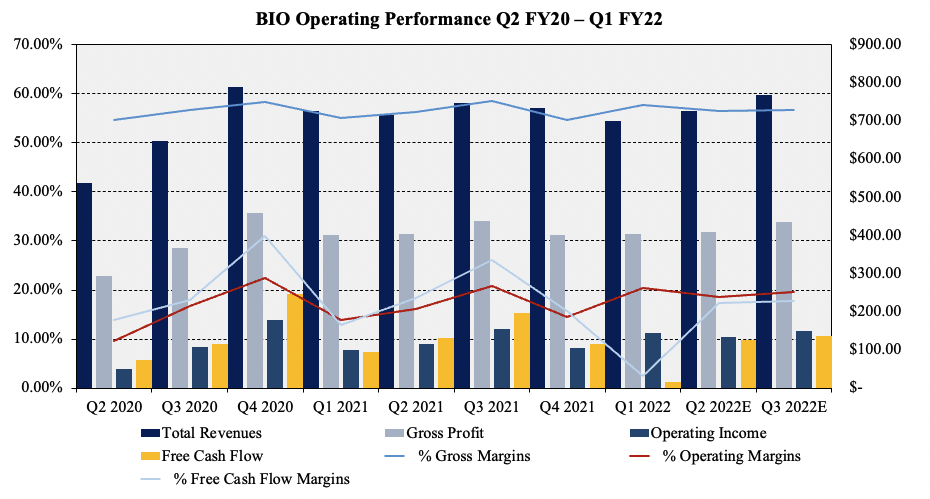
Image: HB Insights. Data: BIO SEC Filings FY20–Q1 FY22; Bloomberg
However, the tangible impact of the Sartorius position to earnings is abundantly clear amid its recent mark downs. As seen in Exhibit 12, the unrealized loss of ~$4 billion last quarter has dragged on cumulative earnings heavily in FY22.
We’ve found investors to be rewarding bottom-line fundamentals again in 2022 and with a substantial mark down in BIO’s EPS from $129 in Q3 FY21 to a loss of $112 per share in Q1 FY22, there’s no wonder BIO’s attracted sellers. The unrealized loss marks the position back to its Q1 FY21 levels, resulting in a substantial loss of earnings premium for investors. The downside risk for investors moving forward is therefore the transfer of pricing risk from Sartorius shares to BIO. Further downside in Sartorius will transpose to the same for BIO, removing the value proposition.
Exhibit 13. Sensitivity to transfer of price risk abundantly clear to the downside
Data: BIO SEC Filings. Image: HB Insights
Valuation
Despite the downbeat commentary, numbers still stack up well for the company in return on its own capital. Both ROA and ROIC came in-line with longer-term averages last quarter, printing 2.2% and 4.2% respectively (8.8% and ~17% annualized). Its annualized cost of capital is ~7.3%, giving an ROIC/WACC ratio of 2.3x. This suggests it continues to compound cash at that rate, a definite vote of confidence and can continue sourcing capital at appropriate costs. This is important to factor for BIOs valuation ex-Sartorius. We have to separate this premium from the valuation from now to get a true estimation of the stock’s price objective, and gain confidence on our estimate of the mean return.
Exhibit 14. ROA and ROIC in-line with longer-term averages, illustrates BIO’s compounding cash
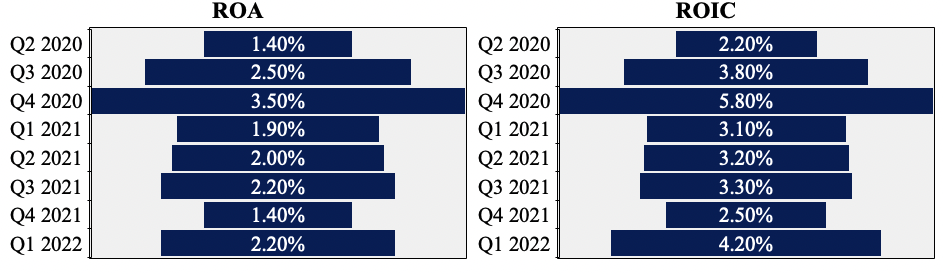
Data: BIO SEC Filings. Image: HB Insights
As such, one measure to evaluate BIO on its own standing is to examine the tangible value flow investors have (and look set to) realized to date. The tangible value flow (FCF/share + EPS) investors have realized since Q2 FY20 has totalled more than $317 per share to date, leading us to believe the additional ~65% premium to the current share price is attributed to the Sartorius position. We’ve priced BIO to deliver another ~$70/share in tangible value to shareholders over the next 2 years.
Exhibit 15. Shareholders continue to realize upside in tangible value (FCF/EPS)
BIO: Incremental Tangible Value Flow from 2019–date
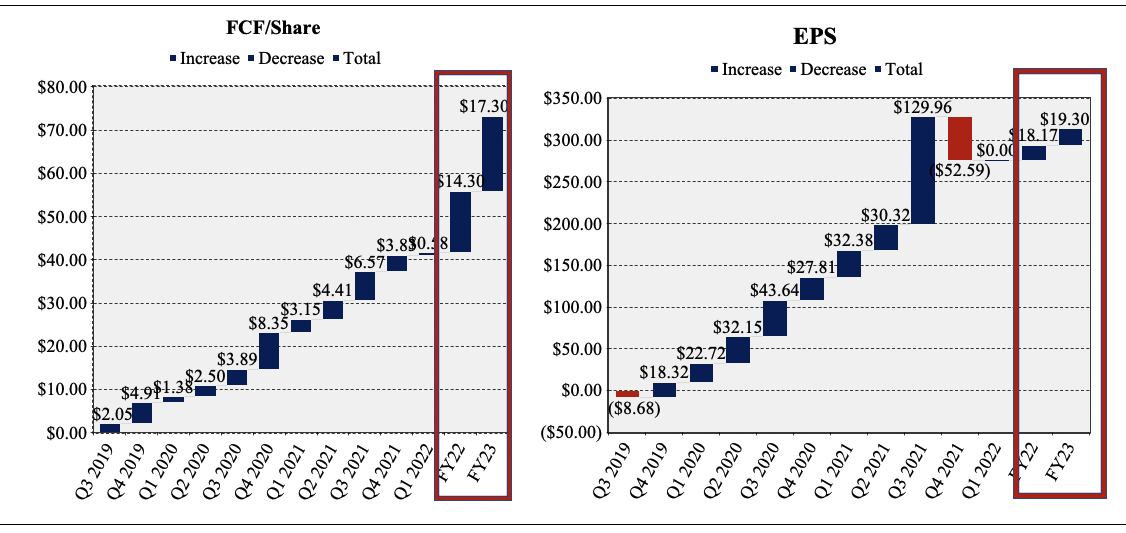
Data: BIO SEC Filings; HB Insights Estimates
Looking further ahead, our model has a base case estimating shareholders to receive another $602 per share into the next decade. Given this, BIO should be priced accordingly. Moreover, it trades at 35x FCF, hence, we can price BIO at $500 based on these forecasts.
Exhibit 16.
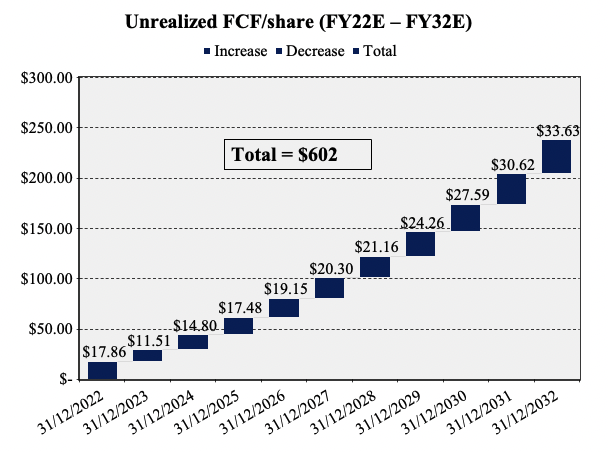
Data: HB Insights Estimates
However, each of these inputs have less credibility seeing as so much of BIO’s pre-tax earnings are tied up to its Sartorius position. Point & figure charting illustrates the market’s psychology of the stock in an unambiguous way to overcome this hurdle. Our analysis shows multiple downside targets to the $445 region, with the stock trading within a longer-term downtrend. The majority of downthrusts have been seen near or below the $600 level and it sellers have been active from $600 down to $525 at least based on this chart. Taking the arithmetic mean of the combination on an equal weighted basis sees us price BIO at $515 per share, for the next 3 months, looking for a reversal back to $600 in the upside case.
Exhibit 17. Multiple downside targets to $445 from price action
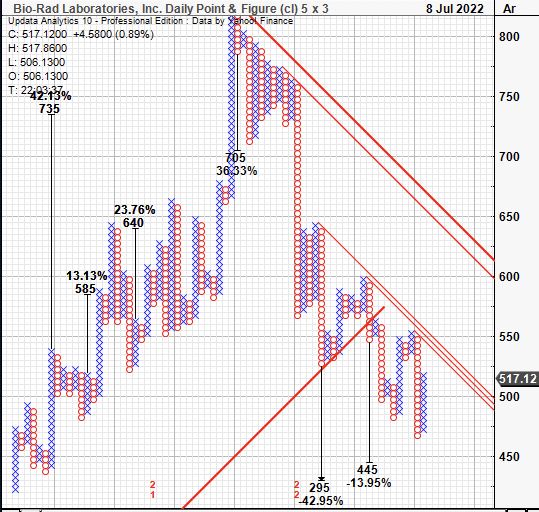
Data: HB Insights, Updata
Technical studies
Shares have been trading below cloud support since March and have tested the cloud 2 times until this point. It is currently testing the cloud once more and this is a key resistance level for the stock. Both OBV and momentum have curled up in the near-term as seen below and are testing longer-term trends. If the stock were to break above this level it could attract buyers at the $520–$530 level as shown on the chart below.
With the trend indicators starting to test key levels it’s therefore a key test for the BIO share price too. It hasn’t diverged from its Sartorius relationship in more than 3 years, therefore, a movement away from this trend could be a technical catalyst, by estimation. However, the longer-term trend is bearish, and further confirmation is needed before calling a reversal.
Exhibit 18. Trading below cloud support, currently testing resistance
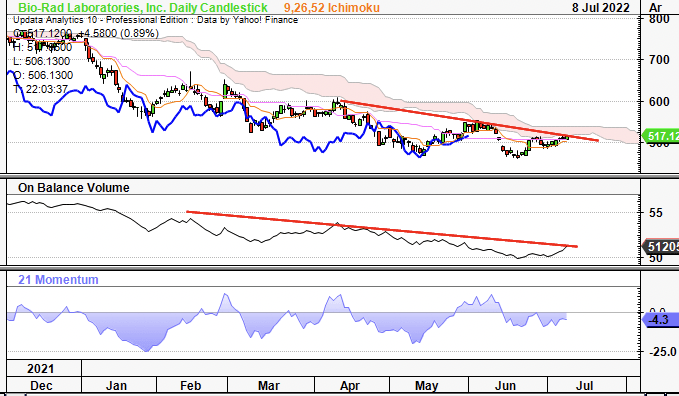
Data: HB Insights, Updata
Retracing the fibs down from the December high, BIO has respected the 38% and 23.6% tabs as resistance levels and looks set to test the 23% mark again. It tested 38% 3x horizontally before shifting a leg down. Hence, failure to break through the 23% mark could see further downside to $462 which is the current support floor.
Exhibit 19. Validated multiple fib. levels, could retest $462 if fails to break $541.
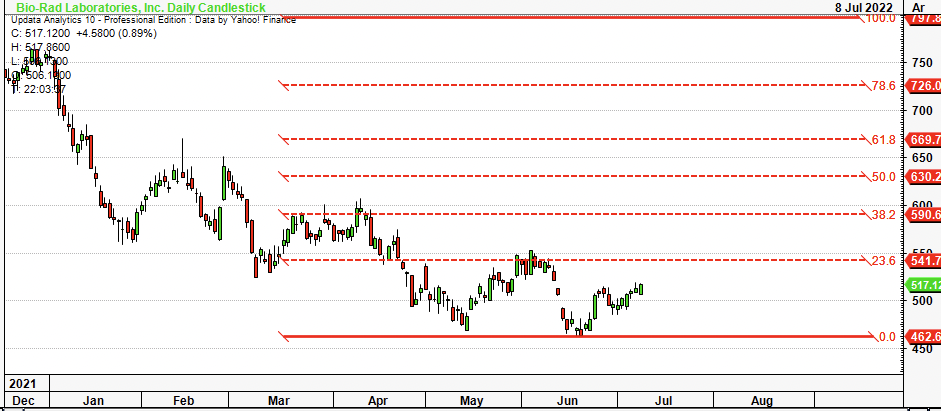
Data: HB Insights, Updata
Buyers are needed before the $462 level by estimate to reduce the speed of downside and start to set higher highs and lows. Investors might want to perform the same charting studies using Sartorius.
In short
BIO continues to offer compelling value on a fundamental basis; however, its investment debate is heavily correlated to its position in Sartorius. The relationship has held tight for over 3 years and recent downside in the latter has been felt immediately downstream by BIO shareholders in FY22. It is also a high-beta name that has been shifting up in correlation to the benchmark, factors we’ve been opting to avoid in 2022.
We’ve priced BIO at $515 with the view it could re-rate back up towards the $600 mark with mean reversion activity to Sartorius and with a settling of macroeconomic headwinds. We advocate investors to withhold on allocating toward the name until further technical confirmation is reached on a reversal of the longer-term down trend. Rate neutral PT $515.
Be the first to comment