

naphtalina/iStock via Getty Images
See You in September
Do you know “The Happenings”?
Probably not. But maybe you remember their pop music classic, “See You in September,” which reached the Billboard Top 100 for fourteen weeks in 1966.
I think about “The Happenings” every September.
September also happens to be the best month of the year to buy bank stocks according to research I shared on these pages in January 2021. Readers interested in visiting that research can find the article here.
Heading into September, I have spent the past couple of weeks digging deep into bank numbers in hope of finding some bargains.
In this article I share a few headlines from my initial analysis of 23 big banks.
Bank Valuations: Definitions
Regular readers know that I have four favorite metrics for determining and analyzing bank valuations.
Here they are:
- Price to Tangible Book Value
- Price to Earnings
- Graham Multiple
- Risk-Adjusted Return on Equity
I have reviewed the “Graham Multiple” calculation in a few prior Seeking Alpha articles. In a nutshell, it is a term drawn from Benjamin Graham’s classic, “The Intelligent Investor” (Harper Business Essentials, 2003).
In chapter 14 of the book, Graham establishes seven rules for “stock selection for the defensive investor.” One of his rules states that a stock should not be acquired if the Price/Earnings times the Price/Book exceeds 22.5x.
Graham did not address banks stocks per se in his writing. Inspired by his analysis, I have determined that bank investors are well-served by substituting Price/Tangible Book Value for Price/Book. (The reason, briefly, is because many banks have historically built-up massive amounts of goodwill/intangibles associated with acquisitions.)
Anyway, for this article, I calculate the Graham Multiple as P/E*P/TBV.
As for “Risk-Adjusted Return on Equity (RAROE),” it is a fairly simple metric that highlights two critical elements of how much an investor is willing to pay for a bank stock.
RAROE is calculated as follows: The average over time of a bank’s rolling four quarters of ROE minus the standard deviation of the rolling four quarters of ROE over the same timeframe.
In effect, RAROE identifies the quality of a bank’s earnings as it considers not only absolute return on shareholder capital, but also the volatility of those returns.
Big Bank Valuations August 2022
With definitions as a backdrop, let’s turn our attention to current big bank valuations.
Below is a run-chart showing the median Graham Multiple for 23 big banks over the past forty quarters.
The current Graham Multiple is 24.7x which is in line with the ten-year history of the 23 banks. We know it is in line because the z-score is .22 which suggests no significant statistical difference to historic averages.
Another observation to be drawn: At 24.7x, the Graham Multiple for big banks exceeds the 22.5x target established by Benjamin Graham. To be clear, I do not view the 22.5x target is inviolable (for many reasons outside the scope of this analysis), but it is helpful rule-of-thumb for determining a margin of safety.
Conclusion: Big banks are not cheap, nor are they currently wildly overpriced.
Graham Mult. (YCharts)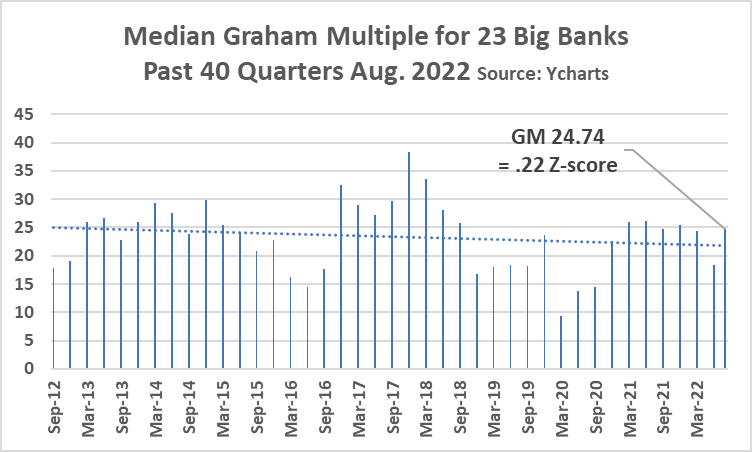
This next chart decomposes the Graham Multiple by examining the median trends for P/E and P/TBV. This chart reveals several interesting findings.
- Note the disparity in Z-scores for the two metrics: P/TBV = +.84x and P/E = -1.17. This is a wide difference worthy of analysis.
- The current P/E is significantly lower statistically than recent history. This suggests banks are cheap.
- However, the current P/TBV, is higher statistically than recent history. This suggests banks are expensive.
What can be influencing the disparity in these two traditional valuation metrics?
Likely two factors: 1) Investors are discounting past earnings. 2) Investors are worried about a potential recession.
By discounting past earnings, investors are saying the future is not as rosy as the recent past. This makes perfect sense given the inflated earnings in 2021 when Provision expense went negative after going sky-high in 2020 during Covid.
P/B & P/TBV (YCharts)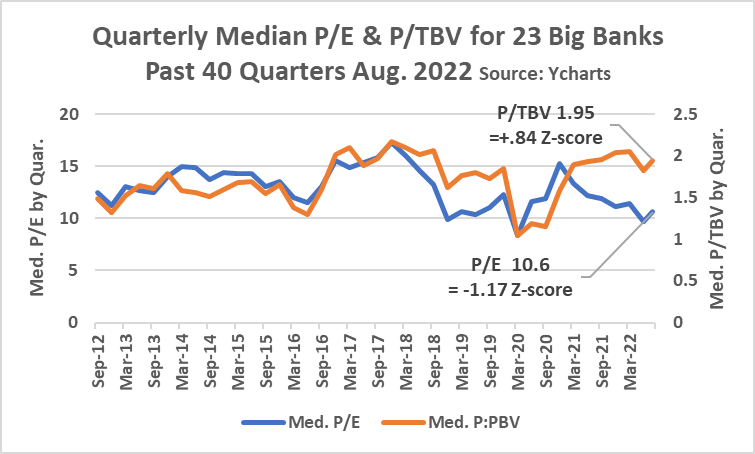
The beauty of the Graham Multiple is that it smooths out some of the overinfluence Provision expense has on P/Es.
Bank investors are generally unwise to over-rely on P/Es as a determinant of margin of safety.
23 Banks’ Relative Attractiveness
Here’s the money chart. This is the one I study.
GM & RAROE (YCharts)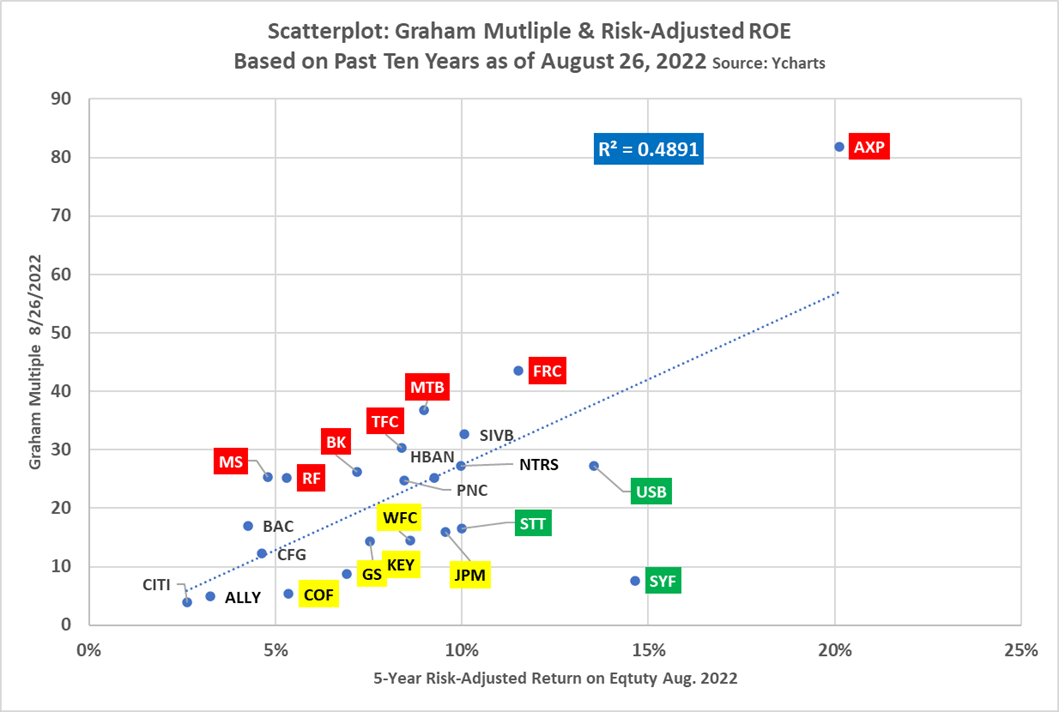
There is a lot of meat to this scatterplot that compares individual banks’ current Graham Multiples and RAROEs.
First thing worth examining is the blue box which shows an r-squared of .49.
Readers with a basic understanding of stats recognize that an r-squared of .49 is reasonably significant and telling. In laymen’s terms, I would say that 50% of the difference in any individual banks’ Graham Multiple is tied to that bank’s RAROE.
The second observation is best seen by looking at the green, red, and yellow boxes.
Banks identified in red boxes appear richly priced today compared to history.
Banks identified in yellow appear attractive, however, they fail to meet a personal criterion of mine: That is, they do not have a RAROE of 10%+. My preference is to own the highest quality banks, which I define as having a RAROE of 10%+.
Banks identified in green boxes are intriguing as possible buys. These banks are:
Let’s take another angle on current big bank valuations.
This next scatterplot changes the timeframe for RAROE from ten years to five years.
The benefit of a tighter timeframe is that it lops off profit numbers from six to ten years ago that may no longer be relevant to how the bank currently operates.
The downside of lopping off profitability data from six to ten years ago is that shorter timeframes often overstate or understate the influence of business cycles.
As a rule, I prefer to consider at least ten years of RAROE numbers. More important than what I think, I will note that Benjamin Graham wrote that “earnings stability” must be considered over ten years.
GM & RAROE (YCharts)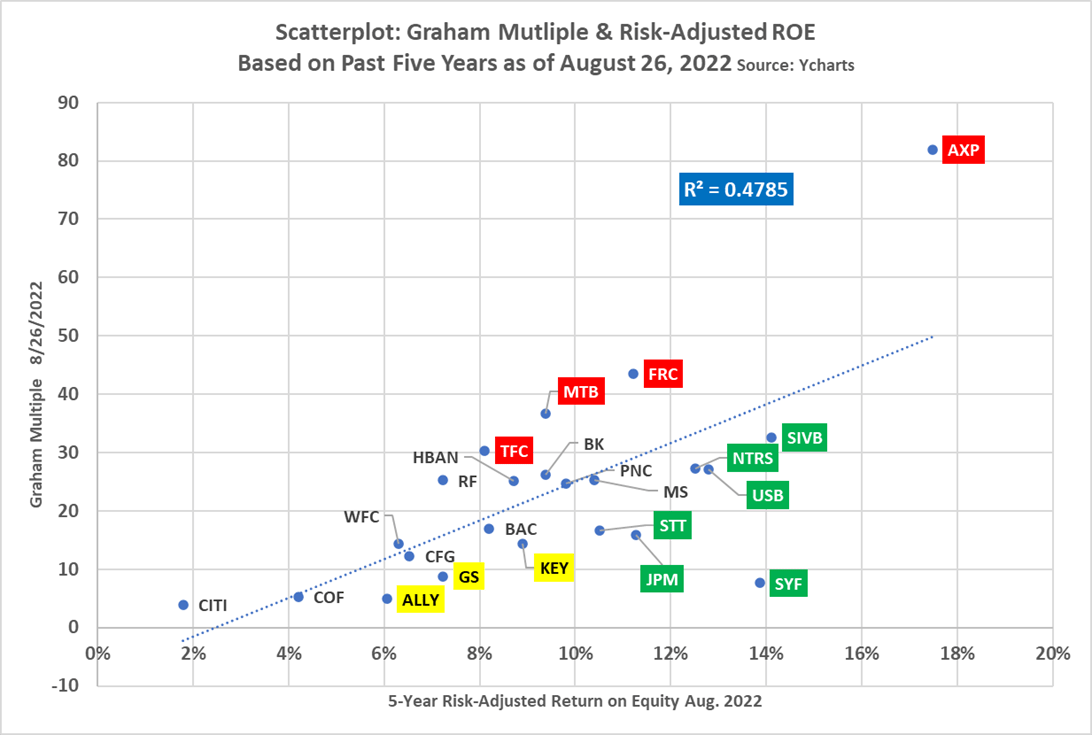
First, note that the r-squared remains meaningful.
Second, note that the banks highlighted in green include not only Synchrony, USBank, and State Street, but now also include:
On the flipside, four banks are identified in red on both scatterplots. At least in theory, they are currently overpriced:
- First Republic Bank (FRC)
- M&T Bank Corporation (MTB)
- Truist Financial Corp. (TFC)
- American Express Co. (AXP)
Without getting into a ton of details, I want to offer a few thoughts on those four banks identified in red.
First, M&T and Truist have both been engaged in mega-mergers. Much more analysis is needed before drawing any conclusion about their current valuations.
Second, First Republic routinely goes to the equity markets to fuel its rapid balance sheet growth.
Third, American Express is in a league of its own. I regret not having bought it when it has periodically gone on sale. Its lofty valuation has always been a hurdle for me. History proves, however, that AXP’s valuation has been justified by its impressive and consistent ROE as well as material buybacks (see below).
Finally, since I wrote a “Sell” article on Citigroup Inc. (C) 12/30/2021, I want to make several observations about its current valuation, which as the two prior charts show, is dirt-cheap.
Based on my fact-based view that RAROE is a major determinant of how much investors are willing to pay for a bank stock, I continue to hold the view that Citi’s valuation (using Graham Multiple) is pretty much stuck where it is until the bank’s proves its ability to produce CONSISTENT returns on bank capital that exceed the bank’s cost of capital.
Citi has been plagued by not only returns that fail to exceed cost of capital (~9%+), but also high volatility in those returns. No surprise, Citi has the highest 3, 5, and 10-year BETAs of its peer group which gets back to the bank’s history for volatility (i.e., lack of predictiveness which investors seek and for which they pay a premium).
Regarding Berkshire Hathaway Inc.’s (BRK.A) acquisition of Citi shares, I see that move as positive for Citi. No doubt about it. However, my confidence in Mr. Buffett’s (or his investment advisors) bank stock selection is not what it used to be in light of grave errors they made in 2020 as documented in my February 2021 article, “Respectfully Mr. Buffett, What Were You Thinking.”
Since year-end when my last Cit article was published, shares are down ~18%. I no longer view Citi as a Sell. But I am not buying.
Buybacks
Here is a bonus chart that I find germane to current valuation discussions.
It shows the change in shares outstanding for the big banks over the past 1, 3, and 5 years.
It is worth noting that only Synchrony and Ally Financial Inc. (ALLY), according to my research (Source: individual bank 10Qs issued in late July and early August), bought back shares since June 30. This is probably no surprise given the hoopla created by the Stress Tests released by the Fed at the end of June.
I am not going to get into a lot of analysis of this chart, but I will offer three headline thoughts:
- The pace of buybacks for many of these banks is stunning and bodes well for long-term shareholders assuming future earnings hold up.
- My guess is that we will not see new or updated or resumed buyback announcements from the big banks until 3Q earnings are released in October.
- The Biden Administration’s 1% tax on buybacks will not impede future buybacks by the big banks; by the way, I read a couple of days ago in the Financial Times that companies are exploring ways to avoid the tax. Seems dubious. Here’s a link to the article.
Shares Outstanding (YCharts)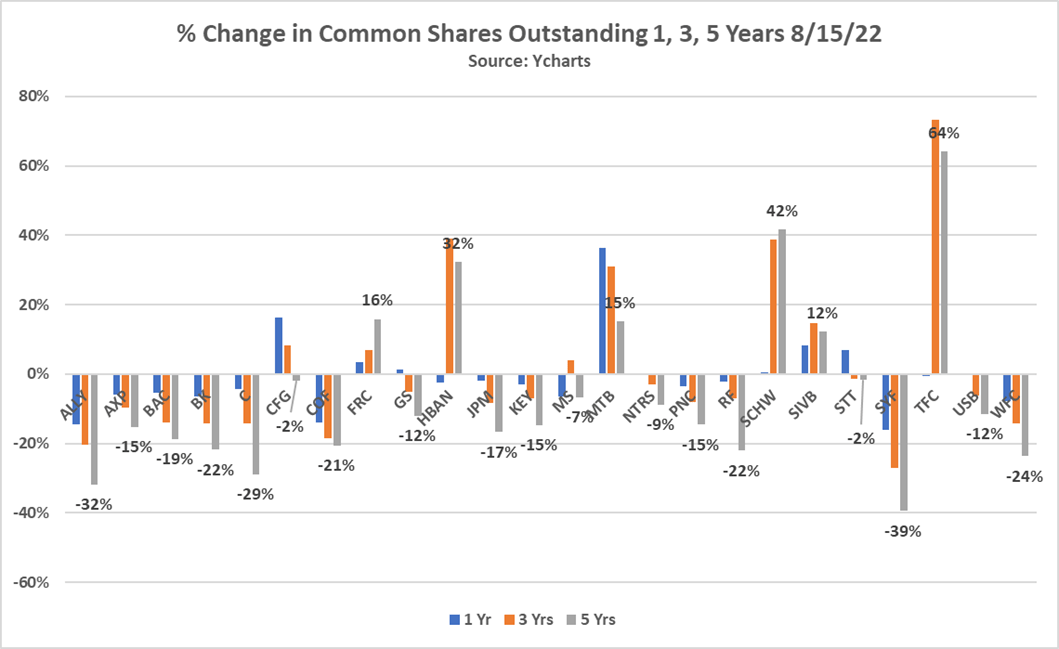
Final Thoughts
The data and observations shared in this article are a jumping off point for further analysis.
Readers may recall my September 2021 article, “U.S. Bancorp: Union Bank Merger Positive, But Remaining Patient.” It looks like my patience has been rewarded. The stock is down almost 20% since then ($57.92 to $46.49). It yields almost 4%. Time to pull the trigger.
There is no plan to exit long-term positions in SIVB, FRC, and JPM. The latter two look attractive for accumulation, but I am in no hurry.
I have written twice this year about Ally. As I noted in the first article, I like management and buybacks but worry about the business cycle impact on retail borrowers. The second article confirmed my confidence option trading Ally in a trading account. So much for confidence: Ally is down 23% since April 19 when the article was published. My options trades and sales have reduced some of the pain, but the loss is still double-digit.
If time permits, look for an upcoming article from me that uses this same format for 33 of my favorite community and regional banks. I have completed the analysis and can tell you that I was surprised by my many of my findings.
Be the first to comment