

allanswart
Written by Nick Ackerman, co-produced by Stanford Chemist. This article was originally published to members of the CEF/ETF Income Laboratory on July 8th, 2022.
Similar to the other senior loan funds we’ve been highlighting, Blackstone Strategic Credit Fund (BGB) has experienced a decline in share price. Even though these funds should generate higher income as rates head higher. One of the impacts on these funds has been the widening discounts. For BGB, the discount has widened meaningfully further.
We last covered the fund on October 29th, 2021. Since then, we can see the total return performance of the share price relative to the NAV.
YCharts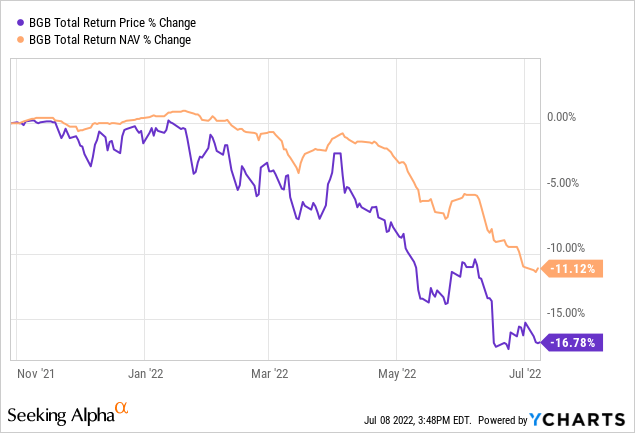
The declines had really accelerated more so in the last couple of months. The reason for this seems to be the increased credit risk. While the underlying loans should benefit from higher rates to earn the fund more income, the risk of default has also increased due to an economy that is expected to close. BGB also has a fairly meaningful allocation in high-yield bonds. So the entire portfolio isn’t invested solely in floating-rate loan investments.
YCharts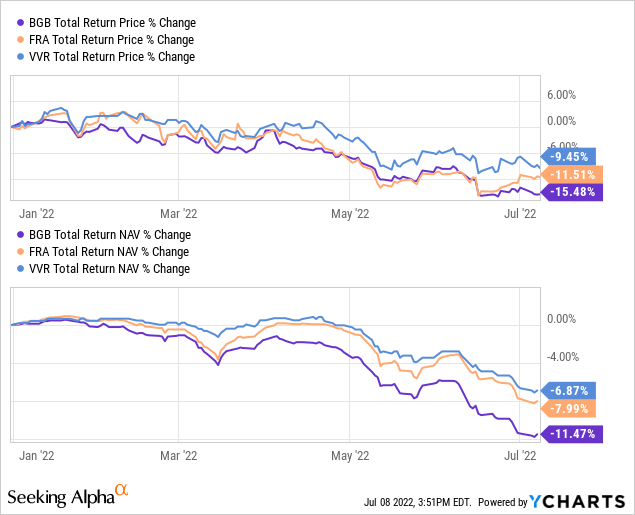
Combining that bit of a change in allocation and a higher amount of leverage, we can see against peers the fund’s results have been worse on a YTD basis. The above compares BGB with BlackRock Floating Rate Income Strategies Fund (FRA) and Invesco Senior Income Trust (VVR). I own all three of these, and clearly, BGB has been the biggest disappointment out of these funds.
That being said, I believe the wider discount at this time makes it a bit more tempting to add. Although, I’ve been quite disappointed in the fund so far. This was my first encounter with a Blackstone (BX) offering, and I can’t say I’m impressed.
The Basics
- 1-Year Z-score: -1.57
- Discount: 11.14%
- Distribution Yield: 7.25%
- Expense Ratio: 2.78% (including leverage)
- Leverage: 39.81%
- Managed Assets: $926 million
- Structure: Term (anticipated liquidation date September 15th, 2027)
BGB has an investment objective to “seek high current income, with a secondary objective to seek preservation of capital, consistent with its primary goal of high current income.”
To achieve this, the fund will; “invest primarily in a diversified portfolio of loans and other fixed-income instruments predominantly US Corporate issuers, including first- and second-lien loans and high yield corporate bonds of varying maturities.”
The fund’s term structure means that a discount shouldn’t happen perpetually. At some point, the fund will liquidate, and investors will receive the NAV per share at that time. There is no guarantee on what the NAV will actually be at that time, though. As a mostly senior loan fund, it would be easy to replace with similar exposure.
The fund is highly leveraged, which hasn’t benefited the fund, at least through 2022. The leverage utilized by BGB is through both borrowings and a preferred issue. The borrowings are quite unusual as they are split into different tranches.
The fund pays LIBOR plus 0.85% on Tranche A loans. On the Tranche B loans, it pays 1.15% above LIBOR for one-month interest period and then “1% above LIBOR for three, six, nine months interest period Tranche B loans, with LIBOR measured for the period commencing on the date of the making of such LIBOR loan and ending on the numerically corresponding day in the calendar month that is one, three, six, or nine months thereafter, as the Fund may elect, or such other periods as the lender may agree on its sole and absolute discretion.”
Leave it to BX, an alternative investment management company, to make some sort of convoluted leverage agreement.
All this worked out to an average interest rate of 1.17% for the fund for the period ending December 31st, 2021. The mandatory redeemable preferred shares had an annual dividend rate of 3.61%.
Given the floating rate debt, higher interest rates mean high leverage costs for the fund. That will impact some of the positive effects of the higher income generated on its portfolio.
Performance – Discount Widening
Since the last time we touched on the fund, the discount has only widened further from 4.58% to the now 11.14%. That puts the discount to some of the widest we’ve seen for the fund, except for the COVID-induced March 2020 collapse. It is well under the decade average that the fund has traded at.
YCharts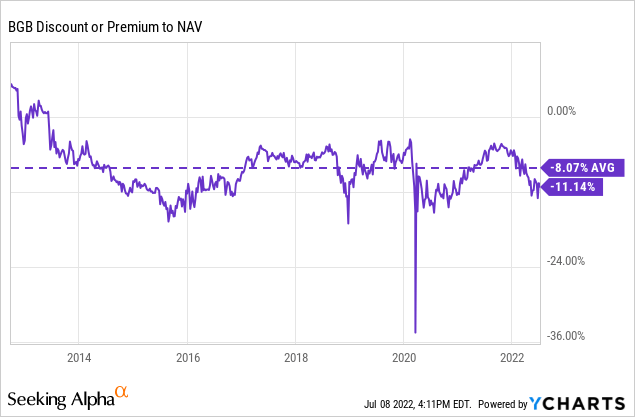
During that time, the fund had underperformed FRA and VVR. That’s a recurring theme.
YCharts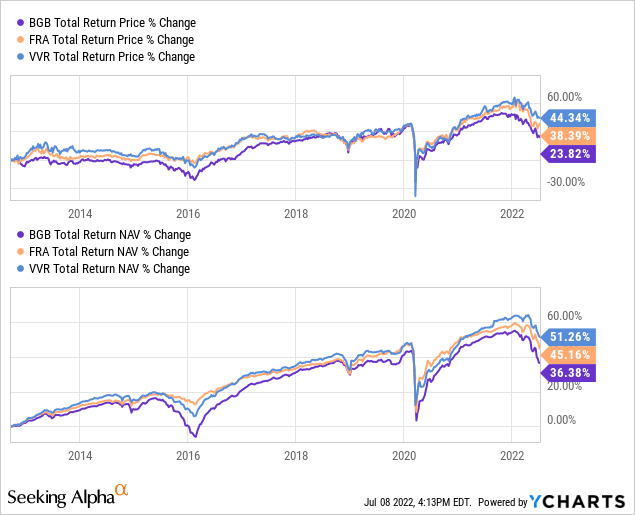
I have more faith in FRA and VVR, making them larger positions in my portfolio relative to BGB. However, the difference here is that BGB represents the better discount in this period. Since these funds are my sort of play on higher interest rates, I don’t necessarily see myself holding them long-term.
None of the funds have performance that would be anything to boast about. That’s a bit expected given the interest rates during the last decade since they rely on higher rates to earn higher returns. It highlights why they aren’t necessarily long-term portfolio candidates.
These are an example of the minor part of my portfolio where I attempt to play the stock market game. As you can see, it hasn’t even worked out and is a good reminder of why I just try to stay diversified overall. Anyway, in a shorter period, if the fund can get back to its average discount when the other funds are trading closer to their averages, BGB could be the better play at this time. FRA is trading above its average, and VVR isn’t too far away.
YCharts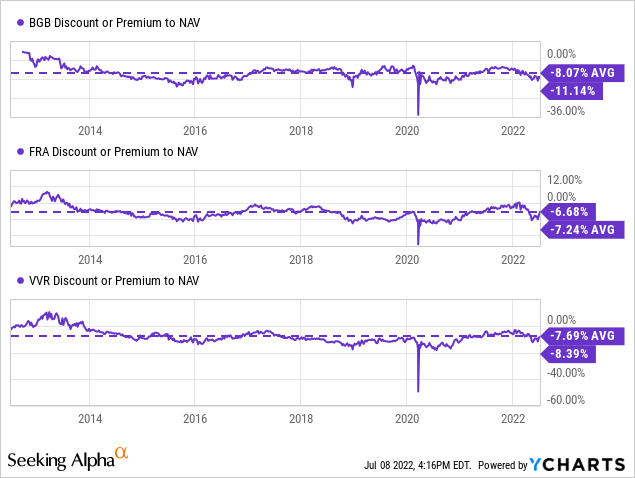
Distribution – Remaining Fully Covered
Another bit of a surprise I received when covering this fund last was the fund’s distribution cut that came shortly after. This was then followed by another the following quarter. Then finally a small boost with the latest. The fund adjusts its distributions quarterly, based on the income received.
BGB Distribution History (CEFConnect)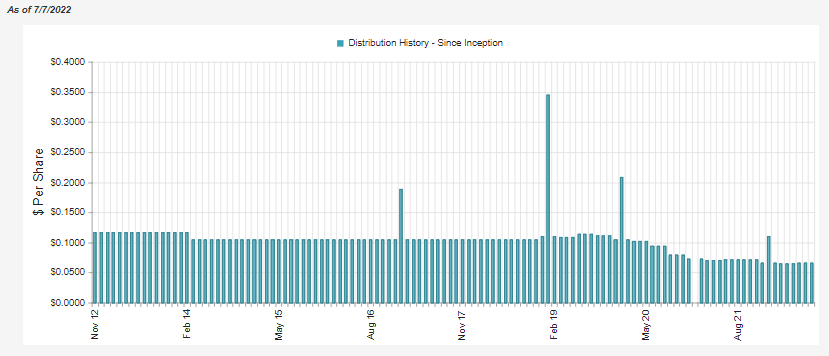
The main surprise when it cut was because the net investment income [NII] coverage was so high. The fund’s last Semi-Annual Report showed nearly 138% distribution coverage.
It makes a bit more sense now that we see the full fiscal year results. NII coverage had come down significantly, explaining why a cut was probably needed. NII coverage in 2021 came to just under 104%.
BGB Annual Report (Blackstone)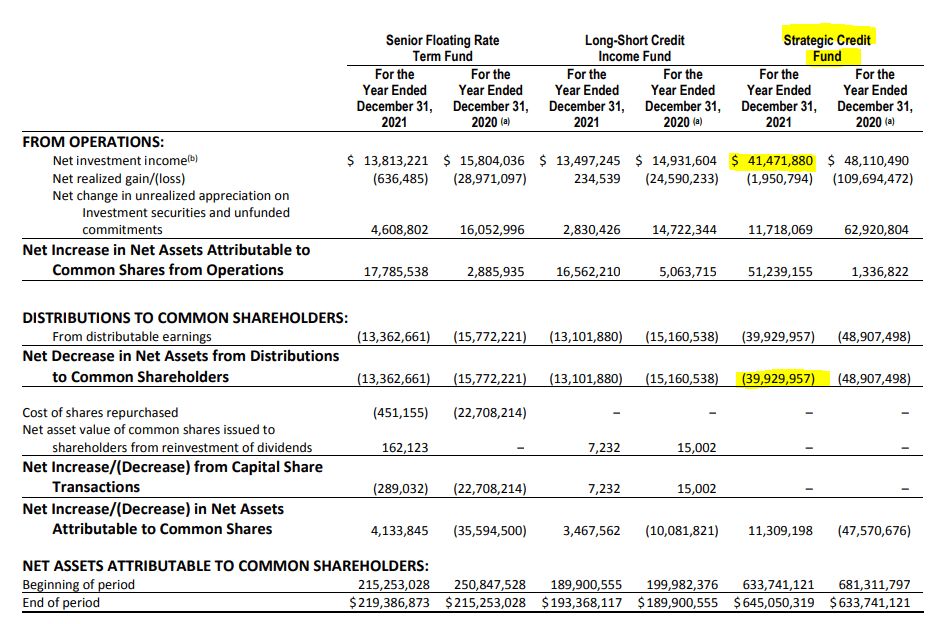
BGB’s Portfolio
The main selling point for BGB in this environment is the higher floating-rate exposure. As mentioned above, a significant portion of the portfolio is invested in senior secured loans. That helps bring the total floating rate debt allocation to around 80%.
BGB Floating Exposure (Blackstone)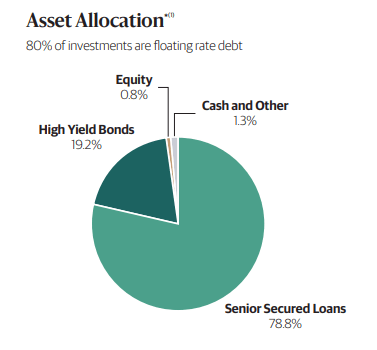
High-yield bonds aren’t necessarily overly sensitive to interest rate changes either. That helps to shorten the portfolio’s duration to just 1.07 years. The average maturity is 5.2 years on the portfolio.
Interestingly, this floating rate exposure is down from our previous update. Since last year, the fund has added a bit more to high-yield bonds, reducing the senior secured loan portion of the portfolio.
BGB Credit Rating (Blackstone)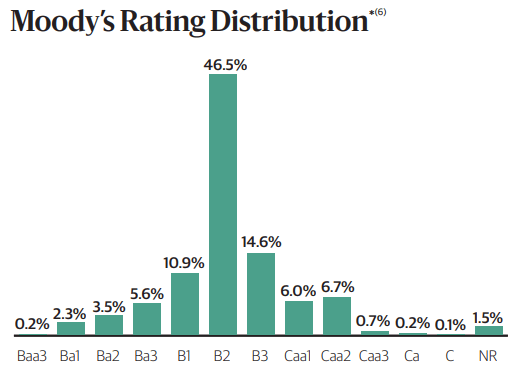
The portfolio here is firmly in the junk-rated territory. As we can see, the highest allocations come in the B1, B2 and B3 categories. The only investment-grade exposure here is the 0.2% in the Baa3 rating. So we aren’t only in junk territory. We are deep in the “highly speculative” junk territory.
This could be where the Blackstone experience could come in handy. They should be able to navigate these types of “alternative investments” better. Of course, up until this point, they haven’t been able to prove they are better than BlackRock (BLK) or Invesco (IVZ); at least when looking at comparing the performance of BGB to FRA and VVR, which is admittedly just a small snapshot.
The Blackstone Senior Floating Rate Term (BSL) also doesn’t compare favorably. This is their more pure-play floating rate fund, with 93% of the portfolio in floating rate debt.
YCharts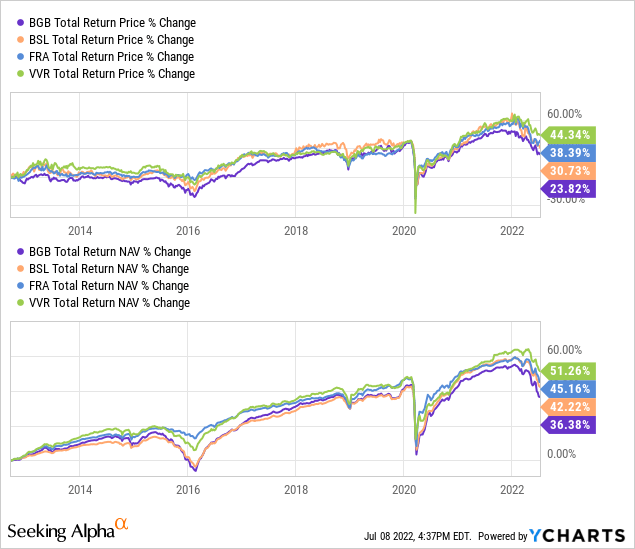
Conclusion
BGB should be benefiting from higher rates. However, credit risks seem to be keeping the whole senior loan fund space down. This type of exposure generally comes with much of the holdings being below investment grade.
BGB has taken the hit harder in both the share price and NAV performance categories. However, it has resulted in the fund’s discount also widening relative to its peers. That could potentially be leading to BGB being worth an investment at this time if one is looking for senior loan exposure.
Be the first to comment