

Beware the VIX DNY59
The VIX closed at 18.35 on Jan 13, which signals a level of extreme complacency in the markets – the last four times the VIX hit these lows in 2022 coincided with market tops:
On Jan 3 the VIX closed at 16.60 – the S&P 500 peaked on Jan 3 – the index bottomed on Feb 24 for a decline of 14% from the peak.
On Apr 4 the VIX closed at 18.57 – the S&P 500 peaked on Mar 29 – the index bottomed on Jun 17 for a decline of 21% from the peak.
On Aug 12 the VIX closed at 19.53 – the S&P 500 peaked on Aug 16 – the index bottomed on Oct 13 for a decline of 19% from the peak.
On Dec 2 the VIX closed at 19.06 – the S&P 500 peaked on Dec 1 – the index bottomed on Dec 22 for a decline of 8% from the peak.
So on these four occasions the S&P 500 peaked within three trading days before or after the VIX bottomed out at levels below 20 – this time should not be any different.
VIX (TradingView)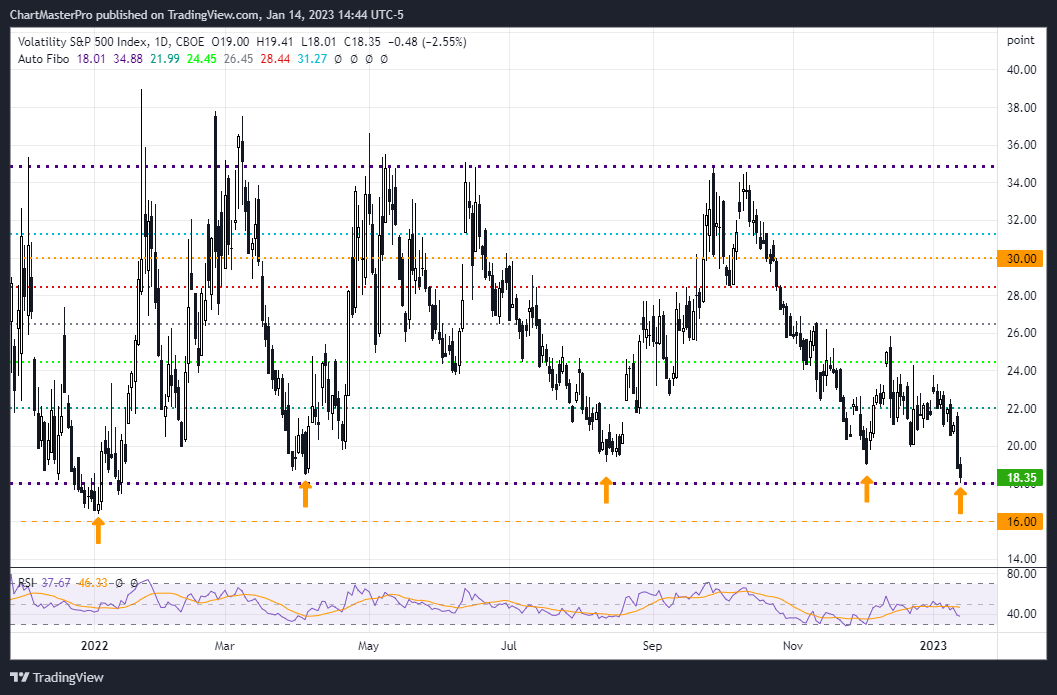
Short S&P 500 (NYSEARCA:SPY)
You can see in the chart below how the S&P 500 peaks coincided with the VIX bottoms below the 20 level. If the pattern does indeed repeat itself then we see the S&P 500 dropping to at least the 3,800 level from here, or 3,700 if earnings over the next two weeks come in worse than expected.
In accordance with this pattern, we took a SHORT position on the SPY on Jan 13 by buying the SPY 17MAR23 400 put options at $12.94 – if the index does drop to the 3,800 level the puts would have a minimum intrinsic value of $20.00.
In regards to risk management, we are willing to give the trade a few weeks for the bearish thesis to play out – but by the end of two weeks, if we do not see the trade moving in our direction, we will exit the position to limit our downside risk and reassess the trade.
S&P 500 (TradingView)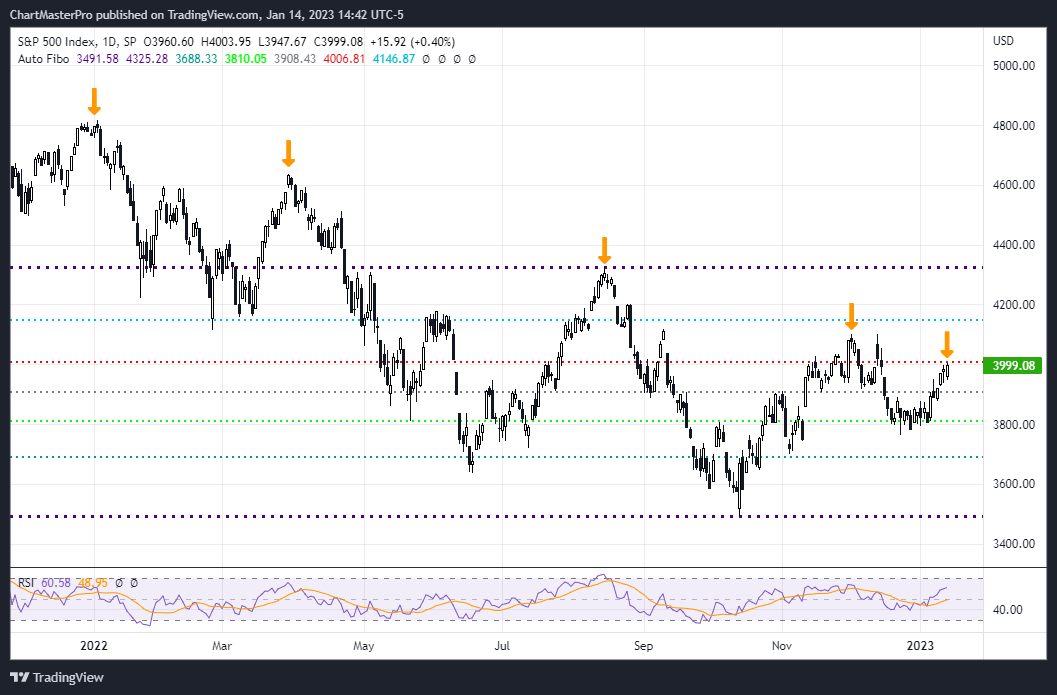
2023 Earnings Under Pressure
Going into this year, analysts’ consensus is for S&P 500 earnings to grow 5.5% for 2023, with most of the growth coming in the second half of the year (FactSet). This is below the 10-year trailing average of 8.5%, but still positive for the year despite the risk of recession occurring sometime in 2023 – the downside risk is that a recession brings down earnings even more than expected, with the possibility that earnings may come in mostly negative on a YOY basis in the first half of 2023 – if earnings are worse than expected in the first half of 2023, earnings estimates might have to be lowered for the balance of 2023, putting downward pressure on the S&P 500.
In the S&P 500 PE Ratio chart below – recessions are marked by the gray-shaded areas – you can see in the chart that S&P 500 PE Ratios declined significantly AFTER the last three major recessions.
After the 1989-1990 recession the PE Ratio declined from 26.12 to 15.01.
After the 2001 recession the PE Ratio declined from 46.15 to 16.25.
After the 2009 recession the PE Ratio declined from 122.41 to 13.01.
So the PE ratio bottomed at an average value of 14.75 after the last three recessions. The current PE ratio for the S&P 500 is at 19.15, and from an historical perspective there is still a potential 20% decline in earnings that could occur should the US economy go into a recession in 2023 – this downside risk in earnings is not currently priced into the value of the index going into 2023.
S&P 500 PE Ratio – 90 Year Historical Chart
MacroTrends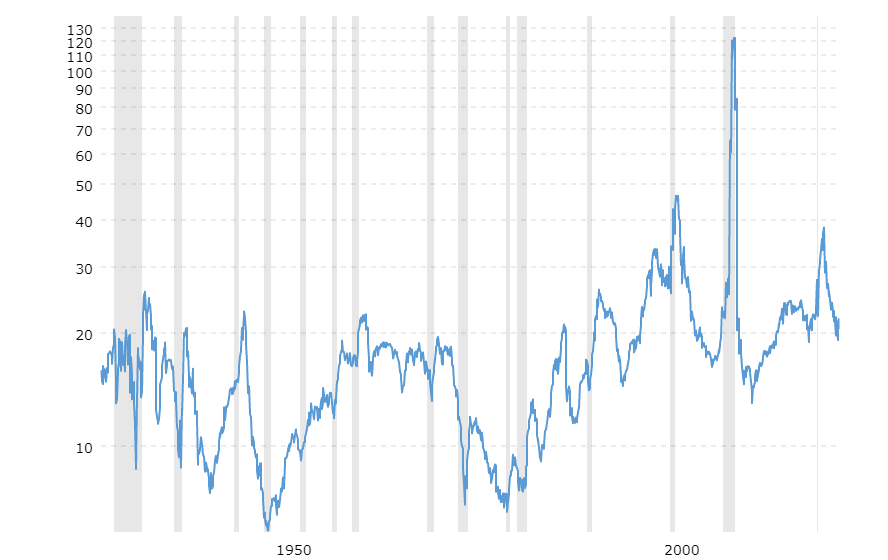
But what if a recession does not occur in 2023? This would require the Fed to time its ‘pivot’ perfectly (no more increases in interest rates), and for job numbers not to turn negative (negative jobs growth is usually a precursor to a recession), and for corporate earnings to remain resilient for the first half of the year. But that’s exactly our point! With the VIX at 18.35 the market is currently priced for perfection – that is, all the positive events that would prevent a recession would have to occur as expected. If the Fed does not pivot as early as expected, if job numbers do turn negative, or if corporate earnings deteriorate significantly in the first quarter of 2023, then markets will have to be re-priced going forward.
Even though the S&P 500 PE Ratio has already dropped from its peak of 38.23 in December 2020, if economic conditions deteriorate further in 2023, the PE Ratio may have to drop to near the 15.00 level before bottoming out, (the average P/E for the S&P 500 has historically ranged from 13 to 15), which would imply an S&P 500 level of around 2,900 under a worse-case scenario (based on current EPS of 198 for the index) – so if the Fed does not pivot earlier than expected, if job numbers do turn negative, and if corporate earnings come in lower than expected in the first quarter of 2023, there will be a high probability that the economy enters a recession in 2023.
On their earnings call on January 13, Bank of America (BAC) CEO Brian Moynihan stated:
Our baseline scenario contemplates a mild recession. … But we also add to that a downside scenario, and what this results in is 95% of our reserve methodology is weighted toward a recessionary environment in 2023,” Moynihan said on a call with investors.
That 95% weight of reserve methodology for a recession is an extremely high number and shows that the bank is baking in some time of recessionary event in 2023.
In addition, some probability models have hit a 100% chance of a recession by October 2023:
Bloomberg economists Anna Wong and Eliza Winger forecasted in their latest recession probability models that there is an increased probability of recession over all timeframes, during which it will hit a downturn reaching 100% in October 2023 compared to 65% within a comparable period during the 12-month estimate (Bloomberg).
We want to make one thing clear: our bearish trade on the S&P 500 is designed to profit from the index dropping over the next month or so. We are looking for a decline to 3,800 or 3,700 over the next month – that’s it – beyond that we are not sure where the index will move – it will depend on the economic data inputs over the next few months, how the Fed reacts to this data, how much the jobs markets softens (or not), and when corporate earnings start to show a slope to the upside.
Bottom Line
The markets were off to an exuberant start for 2023 but the run up in the S&P 500 will most likely stall at the 4,000 level – at this level the market appears to be priced for perfection – the 4,000 level is also a resistance zone from November and also the 61.8% Fibonacci retracement level for the index. Unless the Fed pivots earlier than expected, jobs numbers do not turn negative, and corporate earnings come in better than expected in Q1 2023, the S&P 500 is most likely going lower from here.
Be the first to comment