

G0d4ather/iStock via Getty Images
The shape of the Treasury yield curve continues to be a subject of great interest to the market, due to the now-widespread belief that a flat or negatively-sloped yield curve is a sure-fire harbinger of recession. I’ve disagreed with this of late, because while a negatively-sloped yield curve has in fact preceded almost all of the recessions in the past 50 years (with the notable exception of the economic collapse brought on by Covid shutdowns), there are other indicators (e.g., real yields, swap spreads, credit spreads) which also must be observed if one is to reliably anticipate recessions.
So the shape of the yield curve can help, but it’s not bullet-proof. And to complicate things further, there are a variety of ways to measure the shape of the yield curve, and they often give conflicting signals.
Most discussions of the shape of the yield curve revolve around the spread between 2- and 10-yr Treasuries (the 2-10 spread), but increasingly I’m seeing market pundits refer to the 2-5 spread, the 5-10 spread, and the 10-30 spread. Anyone attempting to follow these various spreads can become quickly confused. As I write this, the 5-10 spread is negative (-5 bps), while the 2-10 spread is positive (20 bps) and the 10-30 spread is almost flat (3 bps).This begs the question: which measure of the slope of the yield curve is the most reliable guide to recessions?
The spread I have generally preferred is the 1-10 spread (shown in Chart #1), but there’s one I think is even better: the spread between the real Fed funds rate and the real yield on 5-yr TIPS (Chart #2). Here, I’m referring to the real yield curve, not the commonly-used nominal curve. Real yields, after all, are far more important than nominal yields because they reflect the true cost of borrowing and the true returns to saving, and those are what create the most powerful incentives in the economy. The Fed is right when it says that it is not actually targeting the nominal Fed funds rate, but instead the real Fed funds rate; that is the best measure of the stance of monetary policy, and that is what a good yield curve analysis should focus on as its starting point (i.e., the overnight Fed funds rate after adjustment for inflation).
Chart #1
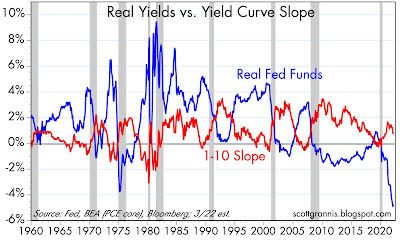
I have been featuring numerous updates of Chart #1 for as long as I can remember. It compares the real Fed funds rate (blue line), which is derived from the difference between the current funds’ rate and the most recent 12-mo. change in the Core Personal Consumption Deflator (the Fed’s favorite measure of inflation), to the difference between the yield on 1- and 10-yr Treasuries (red line). Note that the red line is zero or less in advance of every recession and the blue line reaches at least 3-4%. I think it takes both conditions to equate to a high probability of an impending recession. Today, neither suggests an impending recession-not even close.
Chart #2
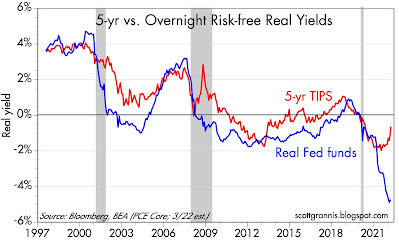
Chart #2 compares the real yield on 5-yr TIPS (red line) to the real Fed funds rate (blue line). (It only goes back to 1997 because that was the year the Treasury began issuing TIPS.) I would argue that this chart gives us a very accurate indication of the slope of the Treasury curve for several reasons: 1) it uses real yields, which are the best measure of how Treasury yields are perceived by the market and how they impact the economy, 2) the Fed itself prefers the real funds’ rate as the most accurate indicator of the effective stance of monetary policy, and 3) it uses 5-yr real yields on TIPS as the best measure of what the market expects Fed policy to do in coming years. (In bond market-speak, the real yield on 5-yr TIPS is equivalent to what the market expects the real Fed funds rate to average over the next 5 years.) According to this chart, the real yield curve is very positively sloped, with the difference between overnight real yields and 5-yr real yields being more than 5%.
So this chart shows us what the Fed is doing now and what it is expected to do in the future. Clearly, the Fed is “behind the curve” because it is going to have to be doing a lot of rate-hiking in the coming years. That’s what a very positively-sloped real yield curve tells us. The risk of recession will rise only as the real yield curve flattens.
In other words, when the red line exceeds the blue line, the market is expecting the Fed to tighten policy in the future, whereas when the blue line exceeds the red line, the market is expecting the Fed to ease policy in the future. The former is consistent with the Fed being behind the inflation curve, and the latter is consistent with being “tight.” Note that each of the three recessions shown here was preceded by a period in which the blue line exceeded the red line: those periods were witness to very tight Fed policy-so tight that the market became convinced that the Fed would inevitably ease policy because the economy would be negatively impacted. And the economy indeed subsequently collapsed.
Editor’s Note: The summary bullets for this article were chosen by Seeking Alpha editors.
Be the first to comment