

adaask
Both NuStar Energy (NYSE:NS) and Magellan Midstream Partners (NYSE:MMP) are midstream master limited partnerships that sport sky-high distribution yields of 10.6% and 8.0%, respectively.
In this article, we will review their Q2 results and then compare them side by side and offer our take on which one is a better buy.
Q2 Results
NS’s Q2 results were solid. Highlights included:
- NS is set to be a big beneficiary from inflation as a large percentage of its revenue comes from refined products. 95% of its pipeline contracts are indexed to FERC and virtually all of them are set to benefit from the full PPI increases in 2022 and 2023.
- Management continued to make excellent progress towards deleveraging the balance sheet, ending the quarter with a leverage ratio below 4x and management guiding for further deleveraging moving forward. With EBITDA set for a boost from inflation-linked contract increases and continued management focus on using excess cash to pay down debt and redeem preferred units, the continued deleveraging path is quite clear.
- Management is focused on cutting costs aggressively in order to drive further free cash flow and thus far has reduced 2022 expenses by $20 million and 2023 spending by over $40 million. They believe they will be able to drive even further efficiencies.
- The common distribution is currently covered 1.88x by distributable cash flow, which – when combined with the deleveraging progress – implies that the distribution is very safe.
- Management will be increasingly focused in the coming years on continuing to pay down debt as well as redeeming its Series D preferred units. Both of these efforts will serve to further strengthen the coverage and safety of its common distributions.
Meanwhile, MMP continued to churn out solid results as well, posting yet another “boring” quarter. Highlights included:
- Closing the sale of its independent terminals, generating considerable cash proceeds of which $190 million have already been deployed towards buying back equity units.
- Given the strict discipline with which management is handling capital expenditures, free cash flow is now expected to come in at nearly $1.5 billion this year, or $578 million net of distributions. This gives management considerable flexibility to buy back a lot of common equity. In fact, if it were to put every single dollar of free cash flow into buybacks at the current market cap, it could repurchase a whopping 5.5% of the company’s equity on top of its already very generous distribution yield.
- Given that MMP is heavily weighted towards refined products, it is also a big beneficiary from inflation just like NS is.
- Management reiterated its commitment to conservative capital allocation and emphasis on unit buybacks during the earnings call, stating:
We remain committed to maintaining the financial discipline we are known for while delivering long-term value for our investors through a combination of capital investments, cash distributions and equity repurchases… We repurchased nearly 3.9 million units in the second quarter at an average purchase price of $48.79 for a total spend of $190 million.
Year-to-date, we have allocated $240 million to unit repurchases, bringing the total since inception to $1.04 billion… Further, we continue to see unit repurchases as an important focus of our ongoing capital allocation efforts. And as previously stated, we currently expect free cash flow after distributions to generally be used to repurchase our equity.
Business Model
NS owns three primary businesses: renewable fuels, refined products, and crude supply and export.
Its renewable fuels business operates along the West Coast for servicing ethanol and biodiesel blending. On top of that, NS is developing an ammonia system that includes the United States’ only ammonia pipeline. It spans over 2,000 miles and reaches seven states running along the central U.S., from Louisiana to Nebraska and Indiana.
Meanwhile, its refined products business services Colorado, New Mexico, Texas, and Northern Mexico. Last, but not least, its crude supply and export businesses are divided into three assets located in: the Permian (its crown jewel asset), Corpus Christi, and its St. James Terminal.
Its cash flows are also quite stable given that 63% of their revenues come from investment-grade customers, 72% of their pipeline revenues are either take-or-pay or structurally exclusive, and 62% of their storage revenues are take-or-pay.
MMP is known for its high quality refined products assets and management’s prudent capital allocation practices which have generated an industry-best 16% 15-year average return on invested capital.
MMP’s cash flows are also quite stable, given that 85%+ are fee-based. Management expects the refined products business (generating over 70% of MMP’s cash flow) to boom for decades to come, given the strategic location of the assets and the company’s overall competitive positioning.
Both businesses certainly have their strengths. However, MMP’s track record for returns on invested capital is unmatched and the competitive positioning of its refined products business gives it the edge here.
Balance Sheet
MMP is the clear winner in the balance sheet category given that it boasts an industry-leading BBB+ credit rating compared to NS’s significantly inferior BB- credit rating.
While NS has made great aforementioned strides in reducing its leverage ratio and clearing out its debt maturity calendar for the foreseeable future, it is plagued by high levels of floating rate preferred and baby bond debt in a rising interest rate environment. Given that its Series D preferred units are set to reset to a higher yield in the near future and will also be redeemable at the option of the unitholders later this decade, management is under pressure to maximize free cash flow and allocate it as much as possible towards redeeming these units beginning next year once it is able to do so.
As a result, while NS is in little danger of financial distress for the foreseeable future, its balance sheet’s exposure to rising interest rates and its heavy preferred and baby bond burden means that it remains heavily leveraged and restricted in uses of its free cash flow.
In contrast, MMP has no long-term debt maturing before 2025 and only 17% of its total net long-term debt matures prior to 2030. With the vast majority of its debt due in 2042 or later, plenty of liquidity, and a relatively low leverage ratio, MMP has plenty of financial flexibility to continue growing its distribution, buying back units aggressively, and even pursue attractive growth opportunities when they become available.
Distribution Safety
NS’s distribution coverage ratio has reached an impressive 1.88x and is expected to expand to 1.99x over the course of fiscal year 2022. In contrast, MMP is currently paying out a $4.15 annualized distribution and is expected to generate $5.20 in distributable cash flow this year, putting its coverage ratio at 1.25x. That said, MMP is also in a much better position to grow its distribution right now given that its balance sheet is much better. However, given that the balance sheet is evaluated under a separate category and NS’s distribution coverage is significantly superior to MMP’s, we give NS a very slight edge here.
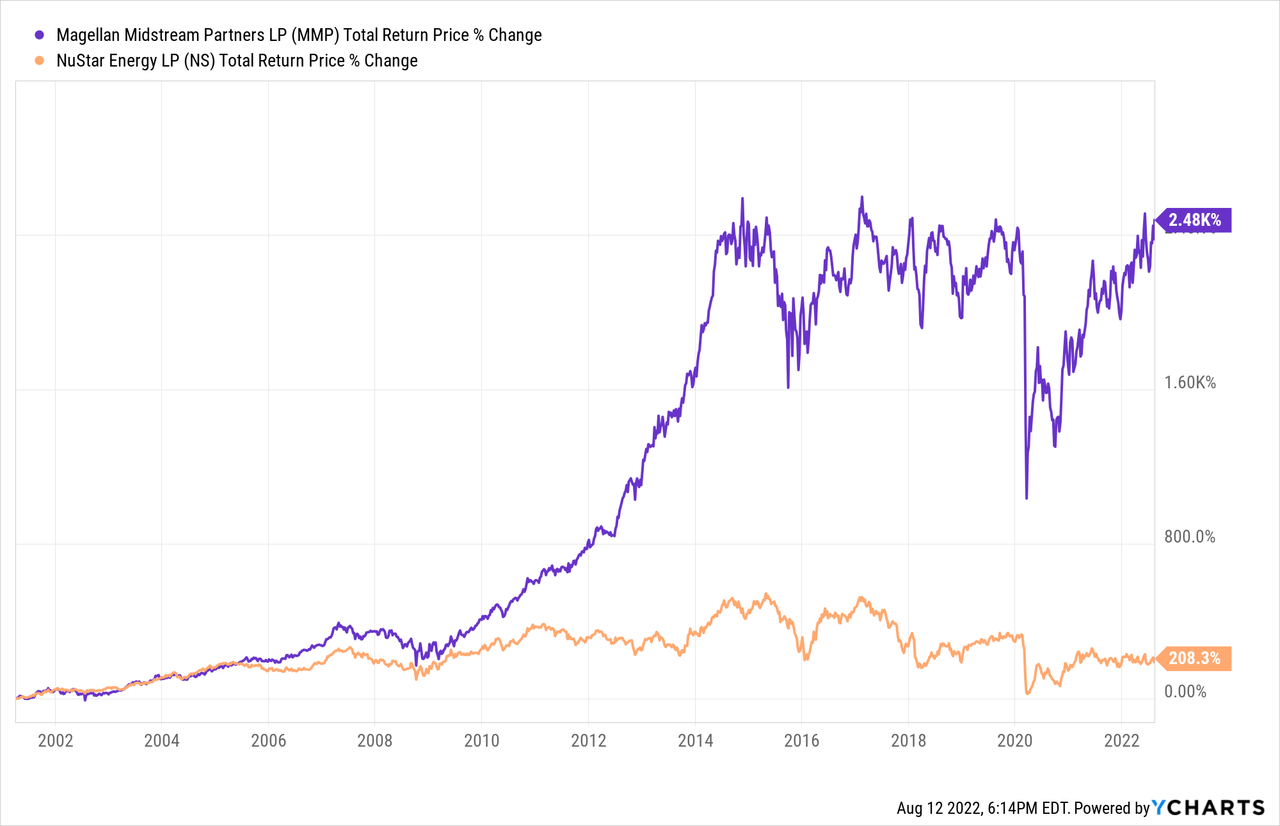
Track Record
MMP crushes NS on this metric as their track records illustrate:
Catalysts And Risks
NS and MMP are both heavily exposed to oil and refined products, so the long-term demand for these energy products are crucial to the total return performance of both businesses. While both enjoy fairly stable and commodity price-resistant cash flows in the short term, if demand plummets for oil and refined products for a sustained period of time, NS and MMP could have to make major concessions to keep their pipelines utilized.
As a result, a major catalyst for NS and MMP is continued strong global economic growth, especially in developing markets where demand for oil is strong and there is less of an emphasis on clean energy alternatives. Additionally, stressors on the global energy supply chain from wars like the current one involving oil giant Russia or a potential future one in the Middle East involving oil giants Iran and/or Saudi Arabia are also major catalysts. Last, but not least, a slowing or even steering away from the major ESG push in the West could also significantly boost NS’s and MMP’s outlook.
The major risk for both businesses is that the drive towards clean energy in the West will continue to accelerate and that mass adoption of electric vehicles and green electricity production will significantly deplete demand for their products. On top of that, a deep and prolonged global recession or some other major disruptor of global energy demand would also likely cause demand to dry up and could pose major re-contracting headwinds for both businesses.
Valuation
Both businesses also look quite undervalued when compared to sector peers as well as their own histories. Here is a side-by-side comparison of them:
| NS | MMP | |
| EV/EBITDA | 8.5x | 10.9x |
| EV/EBITDA (5-Yr Avg) | 10.0x | 12.1x |
| P/DCF | 4.7x | 9.9x |
| Distribution Yield | 10.6% | 8.0% |
Overall, NS looks to be the clear winner in terms of cheaper valuation, though it is noteworthy that both look to be trading at meaningful discounts to their historical EV/EBITDA averages.
Investor Takeaway
Both NS and MMP offer extremely high distribution yields that appear very sustainable for the foreseeable future. On top of that, both are trading at clear discounts to recent valuation averages.
That said, MMP is the clear winner when it comes to being more conservatively positioned, with both its balance sheet and business model coming in as significantly superior to NS’s. On top of that, MMP is buying back equity hand-over-fist and also growing its distribution while NS is feeling pressured to aggressively pay down debt and redeem preferred equity units.
On the flip side, NS does offer a 260 basis point superior distribution yield and also trades at a steep discount to MMP across the valuation multiple spectrum. As a result, if it can successfully deleverage its balance sheet and reduce its floating rate preferred equity exposure in the next few years, it could be positioned to deliver superior upside than MMP. On a risk-adjusted basis, we rate them as equally attractive at the moment, with the note that more conservative investors should choose MMP, while more aggressive investors might prefer NS’s superior current yield and multiple expansion potential. Alternatively, a combination of the two might make sense as well as it could further enhance MMP’s already attractive current yield while reducing the risk profile and strengthening the distribution growth potential that NS has to offer.
We rate both as Buys at the moment.
Be the first to comment