

adaask
Energy Transfer (NYSE:ET) and USA Compression Partners (NYSE:USAC) are both midstream MLPs with very stable cash-flowing business models. While USAC’s yield is ~410 basis points greater than ET’s, ET boasts a meaningfully higher credit rating, implying a lower risk profile.
In this article, we will compare the business models, balance sheets, growth potential, and valuation of these two companies side-by-side to determine which is the better buy today.
USA Compression vs. Energy Transfer: Business Models
USAC is focused on providing compression services with a focus on large horsepower applications. Its fleet is well diversified across operating areas with a presence in the Permian, Delaware, Marcellus, Utica, mid-continent, SCOOP, STACK, South Texas, East Texas, Louisiana, and Rockies regions. Its active average revenue generating fleet generates about 3.0 mm Horsepower with a total capacity of 3.7 mm Horsepower with an 86% utilization rate.
As a result, it has a pretty stable cash flow profile given that compression is a critical part of the natural gas supply chain and natural gas is more important than ever to the global economy. Its customers are pretty much entirely major oil and gas and midstream companies that have proven to be reliable counterparties over the years. Over the past 17 years, USAC has only had to write off 0.07% of total billings. It also has a proven track record over 23 years of operation and has sustained its distribution payout level for years, including through the COVID-19 energy market crash. With contracts that have annual inflation-linked adjustments, USAC is also positioned to benefit from high inflationary levels.
ET, meanwhile, has one of the largest and best diversified business models in the entire midstream space with its cash flow coming from five different midstream subsectors and no more than 30% of its EBITDA coming from any single subsector. It also services all of the major production basins in the United States, further adding to its cash flow stability. Meanwhile, only 10% of its expected 2022 adjusted EBITDA is commodity price sensitive, with the remainder of its cash flows largely fixed to long-term inflation-linked fixed-fee take-or-pay contracts.
It also has proven to be remarkably resilient during market downturns, with its EBITDA growing by ~40% from 2007 to 2009, and while its EBITDA did decline during the 2020 energy sector crash, it bounced back quickly in 2021 and is on course for another strong year in 2022.
While both business models are solid, ET’s greater size and diversification make it the clear winner here.
USAC vs. ET: Balance Sheets
USAC currently has $500 million in preferred equity and $2 billion in long-term debt. Its leverage ratio has creeped up over time and currently stands at 5.2x, whereas between 2019 and 2021 the leverage ratio ranged between 4.5x and 5.0x. That said, management (and the analyst community) expects cash flows to increase in the coming quarters and years thanks to strong tailwinds in the industry, which should serve to reduce the leverage ratio. Still, with a meager B+ credit rating and a negative outlook from S&P, its balance sheet looks pretty stretched.
Meanwhile, ET’s balance sheet is stronger than ever, with a BBB- credit rating from S&P and management paying off billions of dollars in debt over the past two years with further aggressive deleveraging ahead for the business. When compared with USAC, ET’s balance sheet is definitely in better shape.
USA Compression vs. Energy Transfer: Growth Potential
USAC’s management seems quite optimistic about the near-term outlook for the business, stating on the latest earnings call:
I think the tailwinds that we’ve cautiously talked about over the last few quarters have finally arrived and begun to blow in earnest. We have a very supportive macro environment, undergirded by tight supply/demand dynamics and a growing need for natural gas, leading to attractive commodity pricing.
And while the first quarter was a good start, we are excited about the remainder of 2022, and we believe we will continue to see opportunities to increase the utilization and pricing of our fleet, driving returns for our unitholders.
USAC is largely an organic growth play at the moment as it pays out pretty much all of its distributable cash flow as distributions and its leverage ratio is a bit elevated, preventing it from taking on a significant amount of additional debt to finance growth investments.
ET, in contrast, continues to invest fairly aggressively in growth projects while its organic business tends to see growth decline as its pipeline contracts expire and get renewed at lower rates. That said, with energy prices recovering strongly and inflation-linked escalators fixed to its pipeline contracts, ET will likely see stronger organic performance moving forward.
Overall, this is a wash, with USAC and ET likely having similar growth profiles moving forward.
USAC vs. ET: Stock Valuation
USAC’s distribution yield is significantly higher than ET’s. However, its P/DCF and EV/EBITDA ratios are much less attractive right now:
| Metric | P/DCF | Distribution Yield | EV/EBITDA |
| USAC | 7.9x | 11.8% | 9.97x |
| ET | 4.3x | 7.7% | 7.7x |
On top of that, USAC is not trading at any meaningful discount to its pre-COVID levels whereas ET still is:
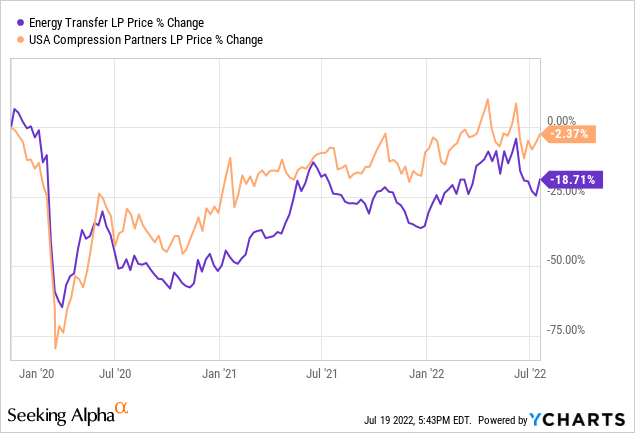
This is particularly noteworthy given that USAC’s DCF per unit was $2.39 in 2019 and is expected to be $2.25 in 2022 whereas ET’s DCF per unit was $2.40 in 2019 and is expected to be $2.42 in 2022. While it is true that ET still has not fully restored its distribution payout level to its 2019 level whereas USAC never cut its distribution, the reality is that the underlying business fundamentals at ET have meaningfully improved since then and its DCF per unit level is even higher today whereas USAC’s leverage ratio is meaningfully higher and its DCF per unit is lower than it was before COVID-19 struck.
It is also important to note that USAC’s distribution coverage ratio was 0.98x in Q1, making it somewhat risky at the moment. In contrast, ET is expected to generate over 3x its current annualized distribution payout level in distributable cash flow this year.
Investor Takeaway
Overall, USAC looks attractively priced as its distribution yield is incredibly attractive and will likely be covered by distributable cash flow this year. It has proven to be quite sustainable in the past and – given ET’s large stake in USAC – it will likely be sustained for as long as possible as ET benefits from the cash flow. That said, ET is the clear winner between the two as it has a much lower risk profile and its valuation is far more compelling. While its distribution yield lags for now, management has indicated that it will likely return to its pre-COVID $1.22 level in the near future, which would put its future yield on current cost at parity with USAC’s while still providing much lower risk and greater distribution coverage.
As a result, we rate USAC a BUY and ET a STRONG BUY.
Be the first to comment