

adaask
Both Energy Transfer LP (NYSE:ET) and Plains All American Pipeline, L.P. (NASDAQ:PAA) have investment-grade (BBB- Stable from S&P) credit ratings, vaulting them into the upper echelon of quality midstream MLPs (AMLP). Both also happen to offer mouthwatering distribution yields, with ET boasting an 8.5% distribution yield and PAA boasting a 7.8% distribution yield.
In this article, we will review their Q2 results and then compare them side by side and offer our take on which one is a better buy.
Q2 Results
PAA’s Q2 results were better than expected by the analyst community, thanks to higher commodity prices and a 30% increase in average daily volumes through its crude oil pipelines in the Permian Basin. As a result, PAA raised its full-year EBITDA guidance and now expects to reach its long-term leverage target range by year-end instead of by the middle of 2023 as it had previously forecast.
ET posted similarly impressive Q2 results that also prompted management to increase full year EBITDA guidance and announce that it expects to reach its long-term leverage target range by year-end.
Business Model
PAA is known primarily for its Permian Basin-based midstream infrastructure, where – according to Morningstar – it quite possibly touches every single barrel of oil produced there. In addition, it owns some Western Canadian NGL assets.
This gives it some diversification across energy commodities, but it remains heavily weighted towards oil as the vast majority (~80%) of its total adjusted EBITDA is derived from its Permian Basin assets. In recent years this has hurt the company as midstream capacity became significantly overbuilt in that region. However, the supply-demand dynamics are beginning to improve and are expected to become more balanced within a few years, which is importantly before many of PAA’s current contracts in that region expire and come up for renewal.
ET, meanwhile, is very well diversified across five different midstream subsectors, with no more than 30% of 2022 expected adjusted EBITDA coming from any single one of those. Furthermore, it services every major production basin in the United States. Only about 10% of its 2022 expected adjusted EBITDA is commodity price sensitive, making its cash flow profile quite stable.
Overall, while PAA’s Permian Basin assets are a true crown jewel given that the Permian Basin is the lowest cost production basin in the United States and one of the best energy production regions in the world, ET’s superior size and diversification give it the edge here.
Balance Sheet
As was already stated, both PAA and ET have the same investment-grade credit rating and outlook from S&P, which puts them on similar footing in terms of perceived risk and access to capital.
Both businesses are also poised to achieve long-term leverage ratio targets by year-end as they are benefiting from similar tailwinds in the energy sector and are rapidly deleveraging their balance sheets through a combination of increased EBITDA and aggressive debt paydown with retained cash flows.
Meanwhile, PAA has $2.8 billion in liquidity (14.5% of current enterprise value) whereas ET has $2.4 billion in liquidity (2.5% of current enterprise value). PAA also has a bit lower of a leverage ratio. However, ET is a much larger business with better diversification of its assets, so it does not need quite as much liquidity and can likely support a higher leverage ratio. Nonetheless, we give PAA a slight edge in terms of balance sheet at the moment.
Distribution Safety
Both businesses boast very safe distributions. Based on expected 2022 distributable cash flow per unit and their current respective quarterly distribution rates, PAA’s coverage ratio is 2.6x and ET’s coverage ratio is 2.8x. Based on expected 2023 distributable cash flow per unit and their current respective quarterly distribution rates, PAA’s coverage ratio increases to 2.9x and ET’s coverage ratio remains 2.8x. Overall, we rate their distribution safety as being equivalent and exceptionally strong.
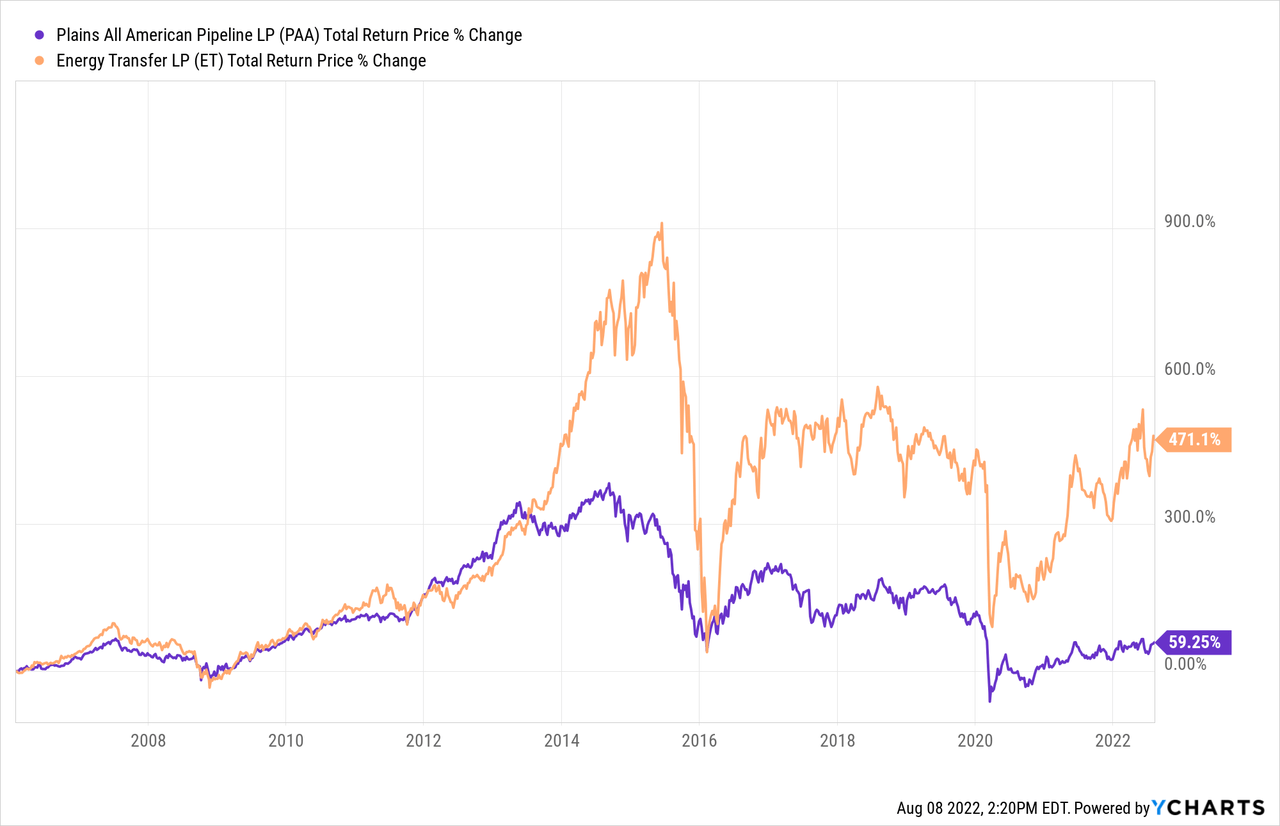
Track Record
Both businesses have a very poor track record, with numerous ill-fated investments and a record of brutally slashing unitholder distributions. As a result, the underperformance from both businesses is unsurprising. That said, ET has significantly outperformed PAA over the long-term, giving it the edge here:
Valuation
Both businesses also look quite undervalued when compared to sector peers as well as their own histories. Here is a side-by-side comparison of them:
| PAA | ET | |
| EV/EBITDA | 8.1x | 7.7x |
| EV/EBITDA (5-Yr Avg) | 9.9x | 9.1x |
| P/DCF | 4.9x | 4.2x |
| Distribution Yield | 7.8% | 8.5% |
Overall, ET looks to be the clear winner in terms of cheaper valuation, though it is noteworthy that PAA is trading at a larger discount to its historical average EV/EBITDA multiple than ET is.
Investor Takeaway
Both PAA and ET offer investors similar investment theses: investment grade balance sheets and high-quality midstream asset portfolios with checkered pasts that include massive distribution cuts. However, both are undergoing impressive turnarounds that have involved aggressive debt reduction efforts by both. Now, with their investment grade balance sheets secured and both businesses gushing free cash flow, distribution increases have begun this year and are likely to continue moving forward once long-term leverage ratio targets are reached by the end of this year.
However, there are two big differences facing their respective futures that could strongly influence investors’ decisions over whether or not they should invest in either one. PAA is primarily focused on crude oil, whereas ET is well diversified across oil, natural gas, and NGLs. In addition, PAA’s management has consistently signaled that their business is focused on buying back units and growing the distribution at an accelerated pace once the leverage ratio target is reached. In contrast, ET’s management signaled on their latest earnings call that they will likely continue increasing the distribution to its pre-cut level of $1.22 per year, but then pivot increasingly towards investing in growth projects.
While paper projections make the growth projects sound like a better use of capital than returning it to unitholders, the past track record of ET suggests that this could very well turn out not to be the case. As a result, whether or not ET is a better value than PAA largely hinges on two factors:
(1) The future of Permian Basin oil; and
(2) The success of ET’s future growth investments.
We are equally bullish on both businesses when taking everything into consideration and consider them both to be Strong Buys at High Yield Investor. However, investors should keep these two factors in mind when deciding where and how much capital they want to allocate.
Be the first to comment