RiverNorthPhotography/iStock Unreleased via Getty Images
Introduction
Berkshire Hathaway (NYSE:BRK.B) is my favorite stock in the current market environment. It’s much more than a conglomerate of different businesses in various unrelated sectors. The whole is worth more than what you would get by buying the different segments as stand-alone entities. Why is that? In this article I’ll go through:
- Why Berkshire is a great company
- A few thoughts on the current valuation environment and competition
- Why the BRK.B stock is a solid downside protected investment with capital appreciation potential
- A brief valuation analysis and qualitative assessment if the current price is reasonable
A great company
Warren Buffett has built one of the world’s most successful companies with his long-time partner Charlie Munger. While Berkshire owns a number of competitive businesses in their own industries, that’s not the reason why I and many others have invested in the company. The strength of Berkshire is that they can move capital from cash-generative businesses to new endeavors that have the potential to produce above-market returns. A tremendous example of this concept is Berkshire’s insurance segment that effectively receives cash surplus or float that they can invest before claims come due. Other examples are the railroad and energy segments of the company that also produce good returns on capital. With that said, all profitable companies can shuffle capital from one activity to another, at least in theory. It’s a whole different thing to do it successfully. Berkshire’s competitive advantage is that they have arguably had and still have the most skilled capital allocators in modern history.
Competition
Before we dive into more specific issues about Berkshire Hathaway, let’s set the scene with a discussion on the valuation environment and the drivers behind it. The low interest rate environment AND quantitative easing that has persisted for the last decade has led to a few things such as millennials dreaming of FIRE (Financially Independent-Retire Early) and the meme stock phenomenon. Thankfully, I’m not going to go through those. A more relevant side effect of the lax environment for Berkshire is the increased competition it has created. As returns in government bonds got squeezed, people fled to investment-grade bonds. As returns in this segment got squeezed, people left for high-yield bonds, then to listed equities and so on. Eventually, people found their way to private equity and other alternative investment asset classes where there still were some returns to be made. This has led to a boom in assets under management for private equity managers. As new players in this segment pop up like mushrooms after a rainy day and existing managers raise new and larger funds more often than the Finnish government raises taxes for their citizens, the playing field has gotten crowded. The SPAC boom during the recent year hasn’t helped. More bidders (demand) for the same number of companies (supply) and the low interest rate environment have to nobody’s surprise led to the rich valuations we see on both the listed and private side today. This, in turn, has led investors that haven’t loosened their investment principles to be out of the game. Berkshire is one of those. With all of this said, the environment that has been prevalent over the last decade has started to change. More on that in the last sub-section.
Let’s talk about cash
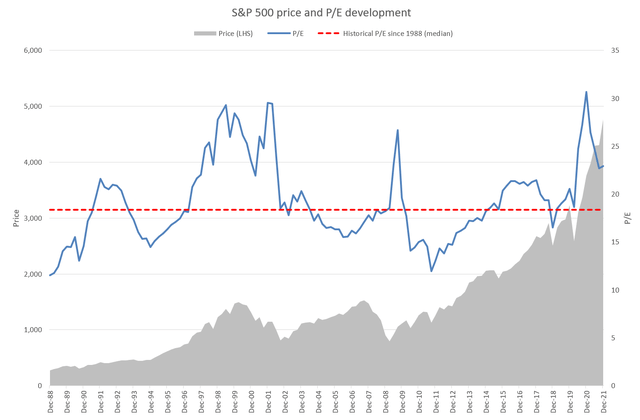
Berkshire’s large cash position has been talked about a lot over the years. Lately, it stood at about $147 billion. Subtract the $30 billion that is necessary for securing continuous operating activities (AR 2021, page 9) and you have $117 billion of cash that could be allocated to high-yielding investments. The cash pile has become so large and has obviously produced so negligible returns that it has been a drag on performance over the last decade. The problem of allocating it has been well commented on by the company. It has been hard to find attractively valued equities both in public and private markets over the last decade (see graph below).
S&P 500 price and P/E development (S&P Dow Jones Indices)
The sheer size of Berkshire also shrinks its investment universe. An investment has to be in the billions if not tens of billions to be meaningful to the company’s overall performance. However, the cash does have strategic value. If valuations would retreat towards historical means or below, the cash’ theoretical value becomes valuable in practice. And why is that? First off, it would limit the drawdown of Berkshire’s share price due to the fact that the beta of cash is effectively zero. Second, and the more important point, it would enable Berkshire’s management to finally put the capital to work at a time when assets are attractively priced. The capital deployed would assumably increase the sustainable earnings power of Berkshire and earn the shareholders a satisfactory return on capital through share appreciation. The current rich valuation environment and Berkshire’s large cash position is exactly why it is a great downside-protected investment with capital appreciation potential.
Valuation
Berkshire Hathaway is a bit trickier to value than other companies due to their diverse economic activities. The different economic activities can be categorized in segments. Here I have categorized the activities into six different segments:
- Cash
- Listed investments
- Manufacturing, Service and Retailing
- BNSF
- BHE
- Other
Cash
Cash is fairly straightforward and is the cash and short-term investments in US treasury bills found on the balance sheet.
Listed investments
Listed investments include listed stocks and fixed income. I have deducted the full deferred tax amount on equity securities which I believe is a conservative assumption as some of those equities will be held indefinitely. I have ignored the deferred tax amount of the fixed income securities as it is negligible.
Manufacturing, Service and Retailing
This segment includes a hodgepodge of different small and large businesses. You can further divide manufacturing into Industrial products, Building products and Consumer products. Service and Retailing includes McLane and a bunch of other businesses. To value these businesses I have used a fairly pragmatic approach and applied a multiple of 15x to the FY2021 earnings of all businesses. This results in a value of $114.7 billion for the manufacturing businesses and $53.5 billion and sums up to $168.2 billion
BNSF
As BNSF is a single entity we can seamlessly use a multiple derived from a peer group. The peers are Union Pacific Corporation (UNP), CSX Corporation (CSX) and Norfolk Southern Corporation (NSC). The median TTM P/E (non-GAAP) multiple of this group is 22.8x. Applying this to BNSF’s FY2021 earnings we get a valuation of $136.6 billion. I believe this to be a conservative valuation as the closest comparable in terms of size, Union Pacific Corporation, trades at 26.1x P/E (non-GAAP).
BHE
It’s worth mentioning that BHE also includes a residential real estate brokerage firm, HomeServices of America. It contributed about 10% to BHE’s earnings in 2021 so it has become a good chunk of the energy businesses’ total earnings. With that said, I have derived BHE’s value using a peer group consisting of Electric Utilities as their business lines are similar to BHE’s. If the real estate chunk keeps growing, it may be advisable to value it separately. The peers I have used are NextEra Energy (NEE), Duke Energy Corporation (DUK), The Southern Company (SO), American Electric Power Company (AEP) and Exelon Corporation (EXC). The median TTM P/E (non-GAAP) of these peers is 21.7x. Applying this to BHE’s FY2021 earnings we get a valuation of $75.8 billion.
Other
In this classification I have included the insurance underwriting operations, equity accounted investments and noncontrolling interests. I haven’t included the insurance businesses’ investment income in the valuation as I have already accounted for the listed investments in the first segment. The first segment is to a large part attributable to the investment activities of the insurance businesses. I have derived the value of the insurance underwriting operations using a peer group consisting of multi-line insurers American International Group (AIG), AXA SA (OTCQX:AXAHY) and Horace Mann Educators Corporation (HMN). Their median TTM P/E (non-GAAP) is 11.8x. Applying this to the insurance underwriting earnings we get a value of $8.6 billion. I want to stress again that this valuation only accounts for the underwriting earnings as I have already accounted for the investment activities in the first segment.
I have used the book value of equity accounted investments ($17.4 billion). It may be warranted to change this valuation method if the segment becomes larger. I have also subtracted the book value of noncontrolling interests from this segment ($8.7 billion). Lastly, I have subtracted corporate costs in this segment. These costs are not attributable to any single segment but are recurring each year and needs to be taken into account. I have estimated them to be about $7.8 billion (about $0.5 billion per year for the next 15 years).
These items sum up to $9.4 billion ($8.6 + $17.4 – $8.7 – $7.8).
Results
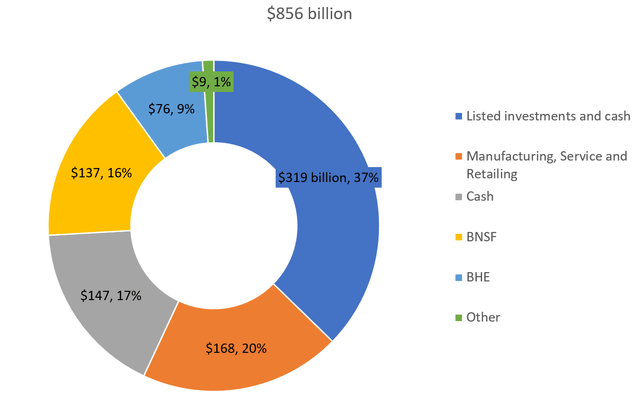
We can now put together the value of the different segments. This leads to a valuation of about $856 billion which is about 12% higher than the current market capitalization of about $765 billion (see graph below). Quantitatively I do not believe 12% upside to provide a satisfactory margin of safety. However, I believe there are some qualitative factors that are not reflected in this valuation. Read on.
Sum of the parts valuation of Berkshire Hathaway (Author’s calculations)
Cash is (not) trash again
The graph above gives a good picture of where the largest chunks of value are. Listed investments still account for more than one-third of the whole pie. The single largest company exposure is Apple with BNSF as a good second. Perhaps the most eye-popping segment is cash which almost accounts for one-fifth of Berkshire. It’s fair to say that the low-yielding cash pile has reduced returns for the last several years. I believe, however, that the market is ripe for putting the excess cash to work. Labor costs are rising, interest rates are rising, energy prices are rising, commodity prices are rising and some of China’s large cities are in total lockdown due to spiking COVID cases. All of these things combined will create disruption as supply-chain bottlenecks live on, valuations come down and margins are squeezed, in some sectors more than others. In times like these, who would you rather have allocated your capital than good ol’ Warren?
In other words, to have cash on hand is valuable again. When the (arguably) greatest capital allocator has it on hand, it is even more valuable. At a share price of about $340-$350, the BRK.B stock provides a quantitative margin of safety of about 10%. When looking at the cash strategic value in this market environment, I believe the margin of safety to be >20% and thus, the whole is worth more than the sum of the parts.


Be the first to comment