

Scott Olson/Getty Images News
Buffett The Buyer Takes A Break
Berkshire Hathaway (NYSE:BRK.A) (NYSE:BRK.B) created some exciting buzz in 1Q, spending over $50 billion on new stock investments in addition to about $3 billion of buybacks. I wrote about this in my last Berkshire article, “Buffett The Buyer Is Back“. With 2Q results now out, we see that Berkshire has reverted to its typical low level of investment activity. The company made about $6.2 billion of new stock purchases and sold about $2.3 billion. Buyback activity also declined to about $1 billion, probably due to elevated share prices at the start of the quarter. Berkshire did not make any buybacks until June, at an average price of $276.75 per B share. Buybacks appear to have continued into July at slightly higher prices, with the company spending about another $0.5 billion through 7/23 based on the share count on the front page of the 10-Q.
The net investment and buyback activity about balances Berkshire’s free cash flow of $4.8 billion in 2Q. The balancing is also consistent with the negligible change in insurance float. After putting more of the cash pile to work on dividend-earning investments in 1Q, Buffett now appears satisfied to earn the higher interest rates now available on Berkshire’s remaining $101 billion cash balance.
With investment activity back to normal, we have to turn to Berkshire’s operating company results to get a good view of performance. Overall, earnings have held up well, but margins are starting to get compressed. Demand could be weakening in some businesses as well. My intrinsic value estimate of the company has not changed much in the past year, but thanks to the pullback in the share price, it now seems undervalued by around 13%. But before I get to that, let’s look at operating business performance.
Insurance
Insurance investment income is doing very well, up 56% from 2Q 2021 thanks to both the new stock investments in 1Q as well as higher interest rates on the cash balance. Underwriting performance is more mixed. Due to the rapidly changing inflation and GDP picture, sequential changes from 1Q to 2Q might tell us more, so that is the way I will present the results. The year-on-year comparisons are in the 10-Q if you want to see them.
GEICO makes up over half of Berkshire’s insurance business. Unfortunately, it continues to struggle with high car and parts costs, resulting in higher costs per claim. They are managing underwriting expenses well, but the cost of claims is the big drag, taking the combined ratio up 3.1 percentage points from 1Q resulting in a bigger underwriting loss. Also concerning is that while premiums earned grew slightly, premiums written were down considerably, which may not bode well for premiums earned in future quarters.
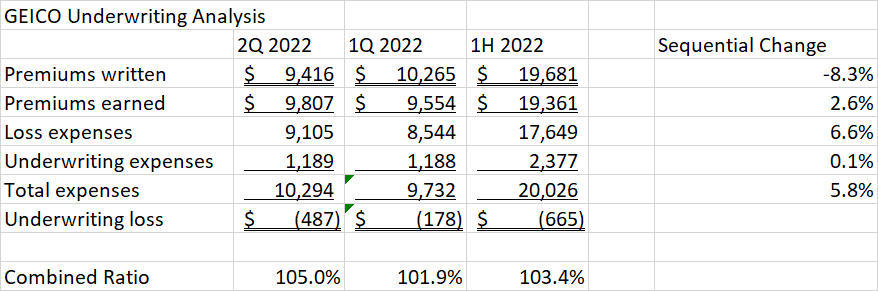
Author Spreadsheet
As we have seen in recent quarters, Berkshire’s other primary insurance business continues to be the best performer of the group. The division improved its underwriting profit and continues to grow premiums written as well as earned. The reinsurance business has lumpy results, so we can’t read too much into quarterly fluctuations. However, economic conditions appear to be a key driver of the better underwriting performance this quarter. A stronger dollar reduces the cost of foreign claims and higher interest rates reduce the cost of future year claims when discounted to present value.
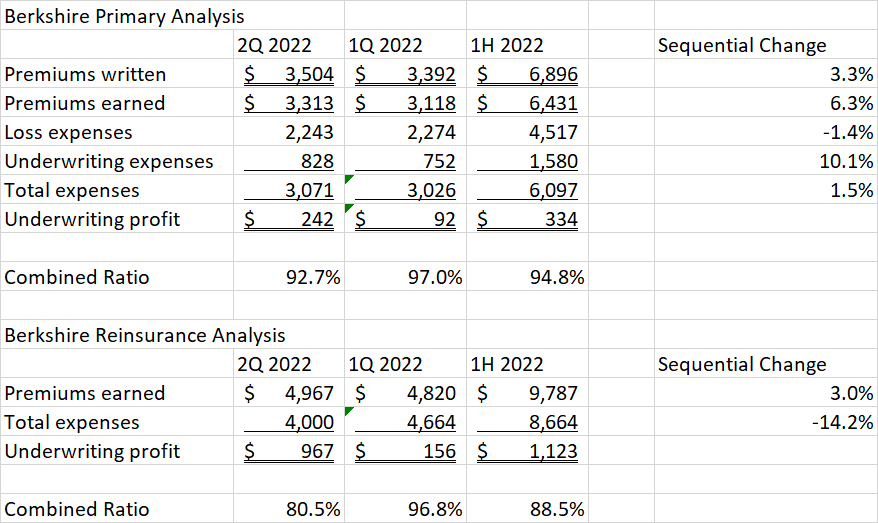
Author Spreadsheet
Putting it all together, I have to downgrade my rating of the insurance business because of the worse performance at GEICO which now deserves a worse than average C-. The other primary businesses deserve an A+ for growth and reinsurance deserves an A for its long-term disciplined performance.
Grade: B-
BNSF Railroad
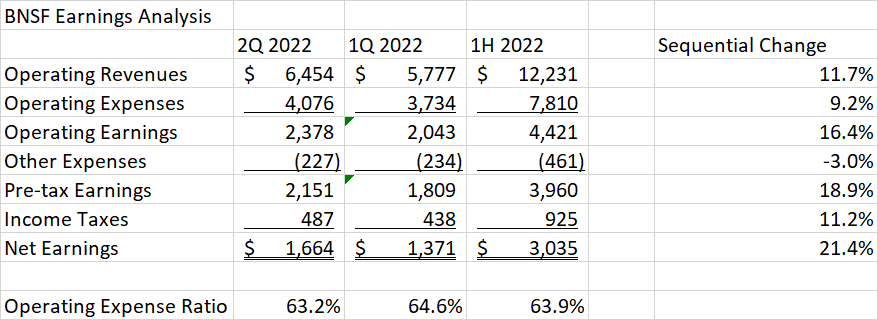
BNSF is facing reduced volumes this year from supply chain issues and a slower economy.
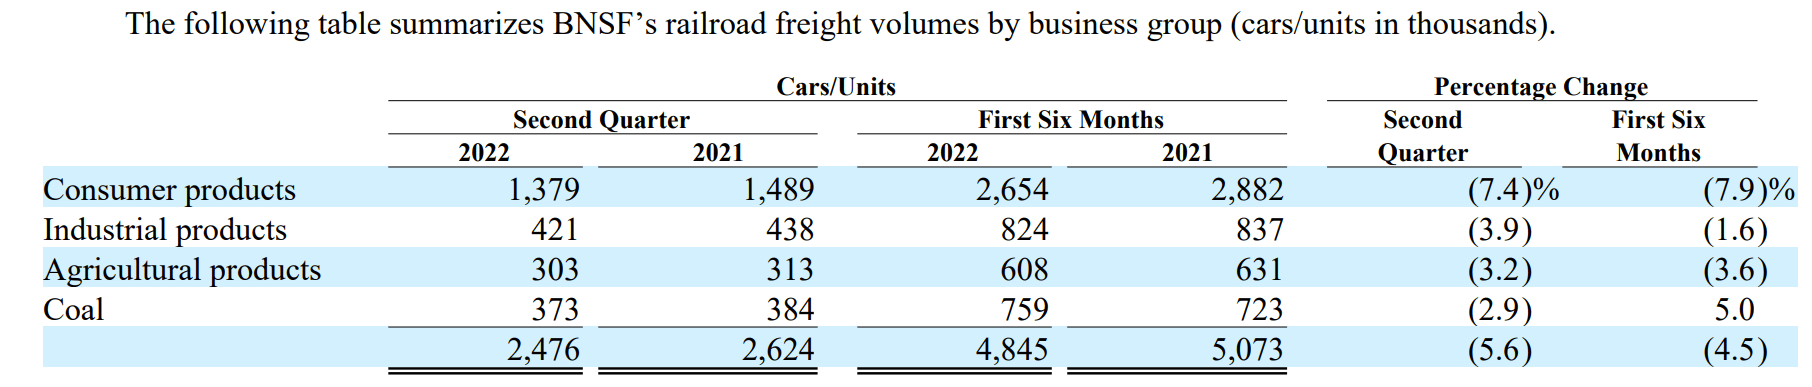
Berkshire Hathaway 2Q 2022 Form 10-Q
The good news is that the railroad has been able to increase prices to more than cover their much higher fuel costs. While the operating expense ratio increased year-on-year, it did come down sequentially.
Author Spreadsheet
BNSF could still stand to improve cost performance relative to peers, but it is on its way and earns an upgrade.
Grade: B+
Berkshire Hathaway Energy
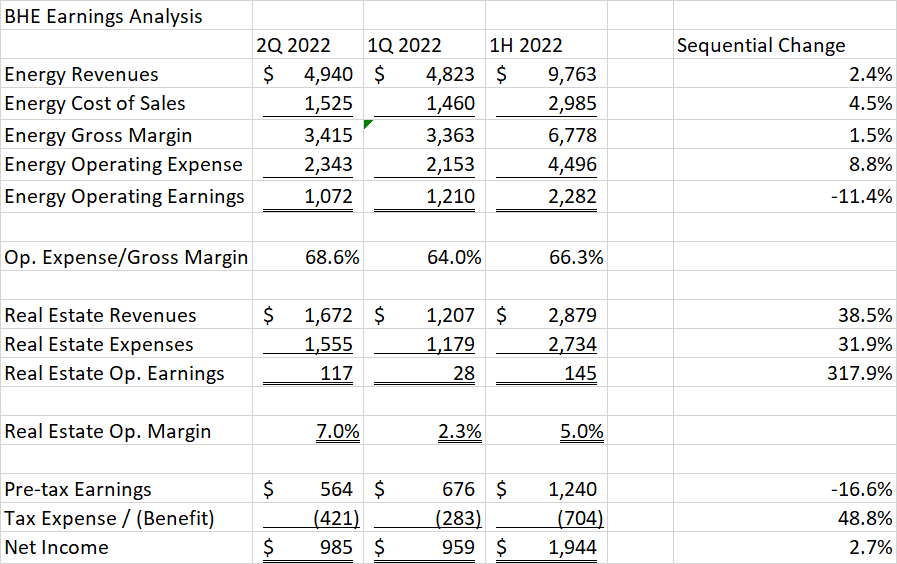
BHE is seeing gross margin and operating cost pressures this year as well, leading to lower operating income. These short-term issues can be overlooked when considering the smart strategic moves Berkshire has made including buying long-distance natural gas pipelines and a 25% interest in an LNG terminal from Dominion Energy (D). The utility also continues to invest heavily in wind-powered generation. Whatever you think of renewables, the wind assets enjoy a production tax credit which makes the overall tax rate for BHE even more negative this year than last. The tax credit is enough to swing the overall income for BHE to an increase despite the lower operating income.
Author Spreadsheet
BHE may be in line for more subsidies through the Inflation Reduction Act. The company owns 25% of the Quad Cities plant with the balance owned and operated by Constellation Energy (CEG). Nuclear power also qualifies for production tax credits under the Act, although it is not certain how the Act’s 15% corporate minimum tax provision would impact BHE. The utility is also piloting small modular reactor technology in Wyoming in partnership with Bill Gates.
Finally, Berkshire recently purchased Greg Abel’s personal 1% stake in BHE for $870 million, which brings Berkshire’s ownership to 92%.
I’ll stay focused on the long-term strategic direction of BHE which earns it the top grade of Berkshire’s companies.
Grade: A+
Manufacturing
Two out of the three manufacturing segments are holding up well. Industrial and building products both show higher sales and income compared to last year as well as sequentially vs. 1Q. In Industrial, Precision Castparts is finally growing thanks to a recovering aviation industry. Lubrizol has recovered from the weather-related shutdown and fire that hurt it in 2021. Marmon also grew in the first half despite a lower second quarter caused by exiting its rail car leasing business in Russia.
Manufactured home seller Clayton Homes makes up almost half of the Building Products group and is growing sales and earnings both vs. last year and sequentially. The unit also finances these homes and is benefitting from higher interest rates with no sign of increasing defaults. While this group traditionally suffers in a recession, Berkshire is not seeing any impact yet.
The Consumer manufacturing segment is now feeling the squeeze of inflation. Revenues are up but margins and earnings are lower. Footwear and apparel order volumes are down as retailers work off excess inventory. RV maker Forest River has had strong growth, but they are now seeing signs of a slowdown with higher gas prices.

Berkshire Hathaway 2Q 2022 Form 10-Q
With two out of three segments holding up well despite the changing economic environment, Manufacturing keeps its good grade from my last write-up.
Grade: B+
Service and Retail
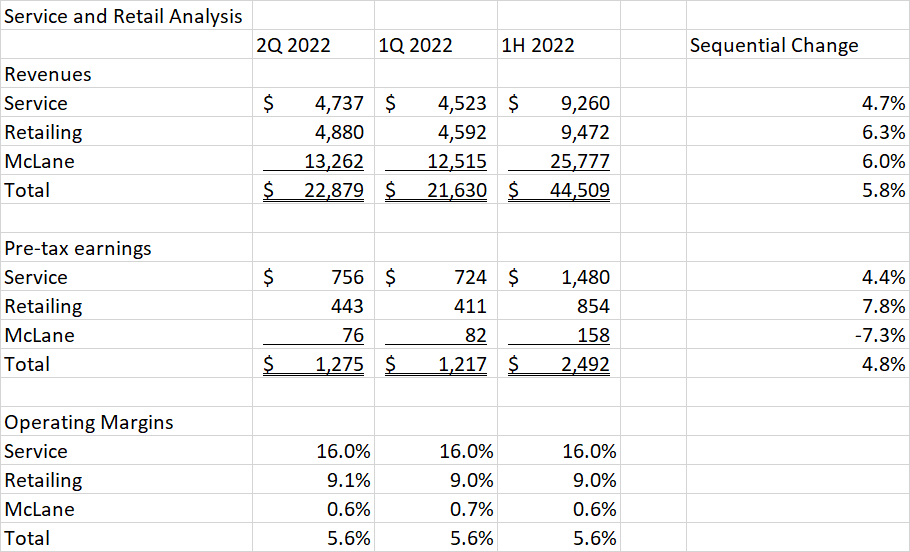
The Service group and McLane had better sales than last year. Retail slowed down in 1Q, but improved again in 2Q. Margins are lower than last year but mostly flat quarter-to-quarter. As a result, total earnings of the group have improved sequentially. The Service group is seeing travel demand recovery in FlightSafety and NetJets. Berkshire Hathaway Automotive is the biggest business within Retail and is benefitting from higher prices and margins despite lower unit sales.
Author Spreadsheet
Berkshire has selected a good group of businesses that seems well-positioned to make it through the current volatility.
Grade: B+
Valuation
I have gone through my sum of the parts model in detail in earlier articles. This one from last year describes the methodology more fully. It depends heavily on the valuation of peer companies to Berkshire’s various businesses. The resulting intrinsic value estimate has been remarkably stable since then, in a narrow range of $490,000 to $500,000 per A share. The earnings power of the operating businesses has increased, but peers have undergone multiple contraction. The value of the equity investments is in between my mid-2021 and end-2021 estimates. Share prices are down from a year ago, but Berkshire has put much more cash to work in this area, especially in 1Q 2022. Finally, the insurance business (excluding income from the equity portfolio) is valued similarly to a year ago, however underwriting income is down, offset by higher earnings power on the cash balance.
The overall fair value is estimated at $330.69 per B share or $496,031 per A share. This is about a 13% premium to the closing share price the day before the earnings release.

Author Spreadsheet
Conclusion
Berkshire Hathaway operating company performance held up well so far in 2022 with stronger earnings despite margin compression in some areas. The cash put to work last quarter in stock investments is paying off in the form of higher dividend income. The cash balance is also earning more thanks to higher interest rates. The only criticism is the performance at GEICO which is still suffering losses and writing fewer new policies. If Berkshire can get this unit to perform as well as its other primary insurance businesses, it will provide a nice bump to my intrinsic value estimate.
While intrinsic value has not changed much, the share price performance in the first half of the year has opened up a buyable valuation gap. I would not be surprised to see Warren Buffett continue the share buybacks that resumed in June and other investors should consider buying as well.
Be the first to comment