

cemagraphics/E+ via Getty Images
This article was first released to Systematic Income subscribers and free trials on June 15.
The recent market drawdown has been unrelenting, offering few respites and extending now for nearly half a year. Many income securities, including higher-quality assets, are down more than 20%. Such large moves can be disorienting for income investors, making it difficult to gauge how attractive current valuations really are and how much likely downside we still have. The current unusual market environment of high inflation, (finally) aggressive Fed and increasing recession estimates make it particularly challenging.
In this article, we try to place the current drawdown in perspective, offering a kind of drawdown taxonomy. We also highlight a number of securities we have been buying in our Income Portfolios.
Are We There Yet?
For investors who have been patiently adding risk this year and rotating from more resilient to higher-yielding assets, the key question is when do yields peak? If yields peak today, then you’d want to do more of the rotation sooner; and if yields will peak at twice today’s level next year, then going slower will be more advisable.
Ultimately, of course, we only know these things in retrospect and one type of period can sometimes transform itself into another. That said, there is a rough taxonomy of different drawdown types that is sensible to talk about and that can help investors gauge how much of their dry powder to spend and over how long.
We like to use corporate credit spreads as a key proxy for underlying income valuations. We show its chart below, with spreads clipped at 15% for clarity.
Systematic Income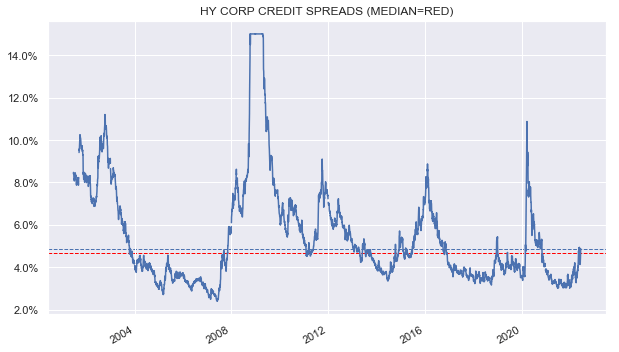
What we see is that Tantrum periods (e.g. 2013 taper tantrum, 2018 Fed auto-pilot mistake) tend to see credit spreads top out around 5%.
Typical recessions tend to see spreads top out somewhere around 7.5-10% – this includes 2001, the 2015 energy crash which technically was not a recession and the COVID recession.
Recessions where you think ATMs won’t be open tomorrow tend to see spreads top out at 15-20% (e.g. GFC).
We are currently around 4.75% right now in spreads, so we are basically fully pricing in a tantrum. A recession is a clear possibility but we aren’t there yet and even the analysts expecting a recession think it will be a fairly mild one.
This is because banks are OK (leverage ratios are much stronger than pre-GFC and balance sheets are cleaner). Consumers are OK (labor markets are tight, retail spending strong, household debt is low). Corporates are OK (earnings growth is slowing but is still decent, leverage ratios and income coverage levels are fine, corporate debt maturity walls have been pushed back at very cheap levels requiring little in debt refinancing).
Things can always change, markets can always panic and the current environment is clearly unusual. That said, something of an average of tantrum and recession environments (i.e. 5-7.5%) is probably a fair zone for what we are going through. If this is right, it means we are around 2/3 of the way through the likely drawdown. This doesn’t preclude bigger moves, of course, but as a base case it seems sensible.
Opportunities We Are Tracking
We have been pursuing four basic themes in our recent allocation across our Income Portfolios.
The first theme has been to use our more resilient holdings across open-end funds and shorter-maturity bonds to allocate to securities that have been more beaten down. This is very much part of our counter-cyclical playbook discussed here and here.
The second theme has been to allocate to securities that are taking advantage of the recent sharp rise in short-term rates. On the higher-quality side of the spectrum this includes floating-rate or near-term reset preferreds – a theme discussed here.
These are the PNC Financial Services Group 6.125% Series P (PNC.PP) trading at a stripped yield of 6.1% at current Libor of 2% which will rise further as Libor is now expected to push closer to 4% at which level this investment-grade stock will have a yield north of 8%.
It also includes higher-quality Business Development Companies such as the Oaktree Specialty Lending Corp (OCSL), trading at a 10.3% dividend yield.
Finally, it includes securities like the New Residential Investment Corp Series D (NRZ.PD), trading at a stripped yield of 8.1%. The stock will switch to a floating-rate coupon of 5-year Treasury yield + 6.22% which is equivalent to a yield of 11.36% based on today’s Treasury yields. The stock also benefits from the fact that the book value of NRZ is positively impacted by rising interest rates.
The third theme has been to hold assets with consumer-facing exposure, discussed here. This not only diversifies traditional income portfolios which tend to be more heavily allocated to corporate credit. It also takes advantage of the fact that consumers are in a strong position due to a tight Labor market, a residual cash cushion from earlier fiscal spending as well as a strong debt service ratio (as % of disposable income) not far from its 40-year low.
This theme includes the New York Mortgage Trust Series E (NYMTM), trading at a 9.8% yield as well as a 12% reset yield as of its early 2025 first call date (based on Libor forwards). The company primarily holds non-agency mortgage securities at a relatively low level of non-recourse leverage of 0.4x and a decent equity / preferred coverage of 4x.
We also like the Western Asset Mortgage Opportunity Fund (DMO), trading at a 10.5% current yield. The fund primarily holds non-agency residential mortgage securities. It has also held up relatively well this year – outperforming the broader Multi-Sector CEF space in total NAV terms. It also boasts a sizable floating-rate asset profile which should see its income level increase this year.
The final theme is to take more duration and credit risk in a controlled fashion. This is because of the simple fact that credit risk is finally well compensated as shown in the chart below. Current high-yield corporate bond yields are trading well above their average level of the past decade (green line) and have only been exceeded by a few months in the last decade during exceptional periods.
Systematic Income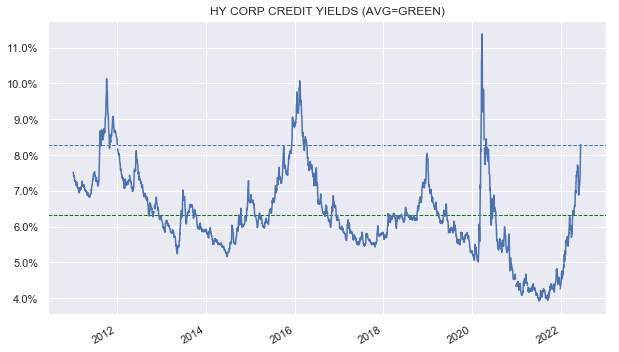
Here, we like funds across a wide quality spectrum. It includes the Nuveen Municipal Credit Income Fund (NZF) – a fund with a high-yield municipal bond focus, trading at a 5.7% current yield (107% distribution coverage) and an 8.6% discount (vs. 5.2% sector average).
In the corporate credit space, we continue to like the Credit Suisse Asset Management Income Fund (CIK), trading at a 9.9% current yield and a 6.2% discount. The fund has been one of the best performers in the sector historically.
Takeaways
The current market environment is a very attractive one for income investors who were largely starved for yield in 2021. That said, we don’t know if the current sell-off has more to go or how exactly it will develop. This suggests that investors should pursue a number of compelling themes such as the ones we discuss here. It also suggests that investors allocate to the current market in a controlled fashion, making sure they reserve some dry powder in case new opportunities emerge.
Be the first to comment