

DNY59/E+ via Getty Images
By Fei Mei Chan
On Monday, June 13, 2022, the S&P 500officially entered the bear market territory, having lost more than 20% of the value from its peak on Jan. 3, 2022. Just as we didn’t know on Jan. 3 that the market was going to decline, today we don’t know the full extent and duration of the new bear market.
An obvious way to consider this question is to compare the current decline with its historical predecessors. Exhibit 1 shows that we are now experiencing the fourth bear market in the last 30 years. Its 23% decline so far is smaller than the other three, and substantially smaller than the declines in the aftermath of the Technology Bubble (2000-2002) and the Global Financial Crisis (2008). Of course, it’s fair to observe that the current decline is not over.
Exhibit 1: Drawdowns of Previous Bear Markets
Data from Dec. 31, 1990, through June 17, 2022. Past performance is no guarantee of future results. Chart is provided for illustrative purposes. (S&P Dow Jones Indices LLC)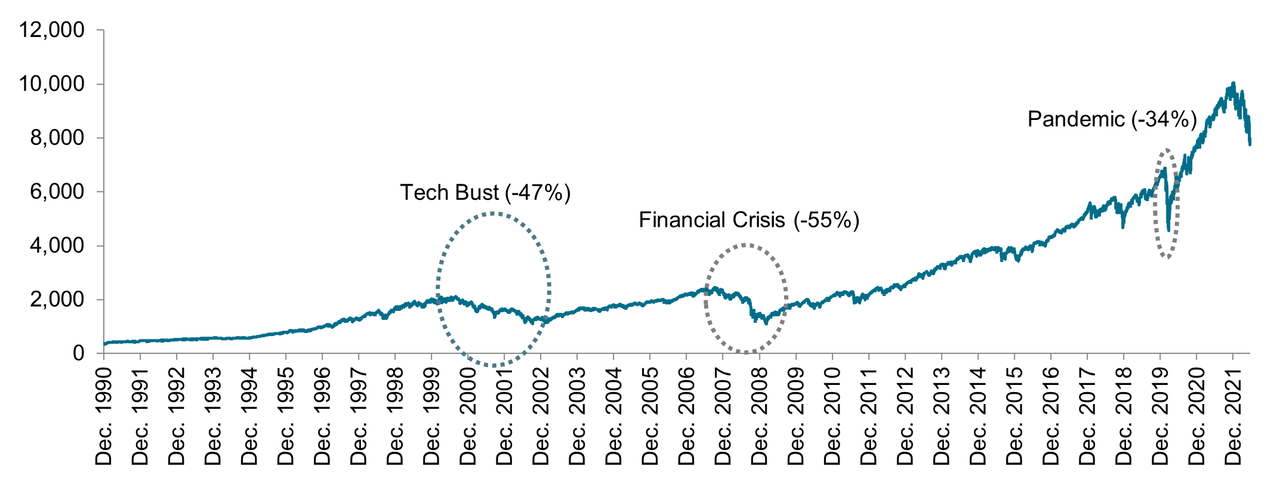
We’ve found that dispersion and correlation can provide useful context around market dynamics. Exhibit 2’s dispersion-correlation map shows that historically, poor markets have only occurred in the presence of high dispersion. (Importantly, the converse is not true: high dispersion is not a reliable indicator of poor markets.) This was particularly evident in both the Technology Bust (2000-2002) and the 2008 Global Financial Crisis. Average monthly dispersion levels in those years all exceeded 30%. In contrast, dispersion so far in 2022, while higher than its long-term median, has remained lower than in the previous two bear markets. Whether this remains the case when the current bear market finally ends is another subject of uncertainty.
Exhibit 2: Dispersion-Correlation Map
Data from Dec. 31, 1990, through June 17, 2022. Past performance is no guarantee of future results. Chart is provided for illustrative purposes. (S&P Dow Jones Indices LLC)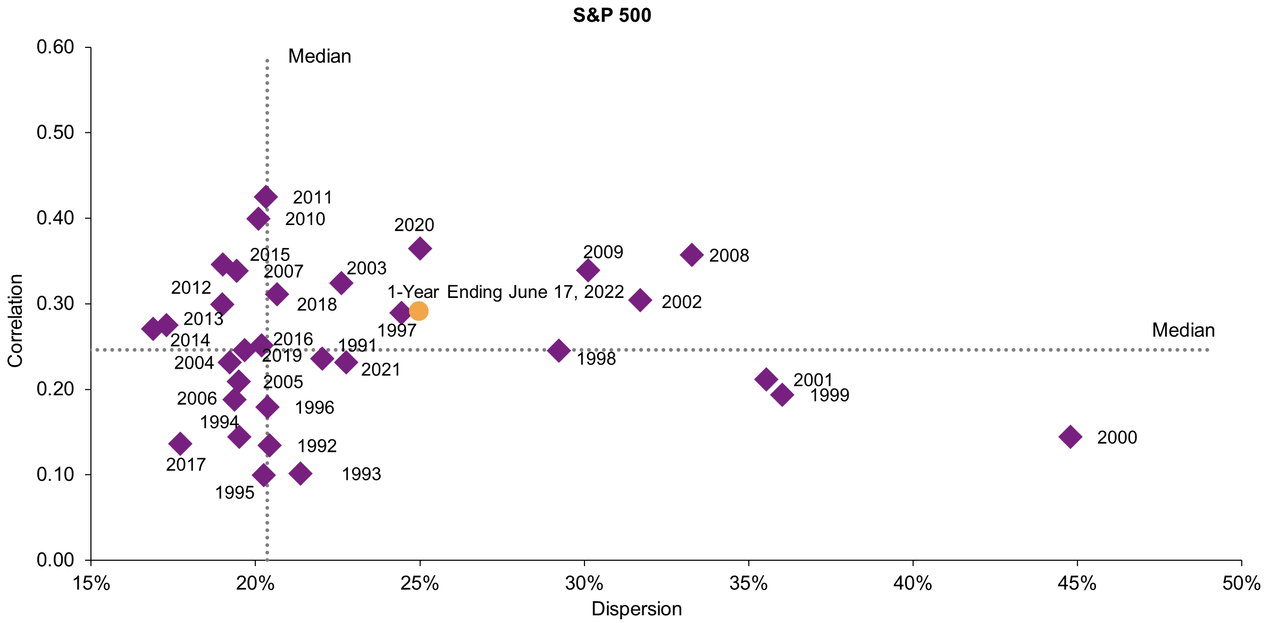
As of June 17, 2022, we are 165 days into the current bear cycle. As Exhibit 3 shows, both the Tech Bust and the Global Financial Crisis lasted much longer (929 days and 517 days, respectively). As when we entered the bear market in January, we won’t know that it’s over until after the fact.
Exhibit 3: Duration from Peak to Bottom for Previous Bear Markets
Data from March 24, 2000, through June 17, 2022. Past performance is no guarantee of future results. Chart is provided for illustrative purposes (S&P Dow Jones Indices LLC)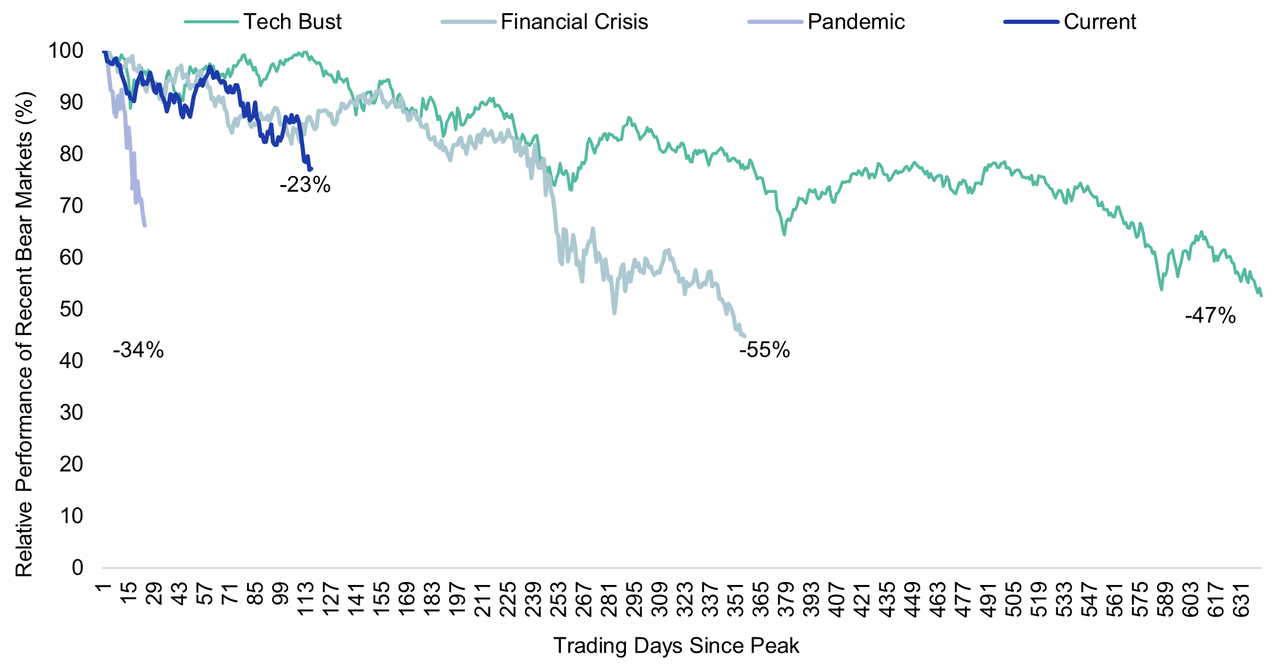
Disclosure: Copyright © 2022 S&P Dow Jones Indices LLC, a division of S&P Global. All rights reserved. This material is reproduced with the prior written consent of S&P DJI. For more information on S&P DJI please visit www.spdji.com. For full terms of use and disclosures please visit Terms of Use.
Editor’s Note: The summary bullets for this article were chosen by Seeking Alpha editors.
Be the first to comment