

adaask
While the BlackRock Enhanced Equity Dividend Trust (NYSE:BDJ)’s current yield of 7.2% is attractive, investors should understand that the fund’s call writing strategy trades away ‘upside’ for current income. Personally, I prefer to focus on total returns and thus would avoid call writing funds.
Fund Overview
The BlackRock Enhanced Equity Dividend Trust is a Closed-End-Fund (“CEF”) that provides current income and long-term capital appreciation. The BDJ Fund has $1.7 billion in assets.
Strategy
The BDJ fund seeks to achieve its investment objective by investing in dividend-paying common stocks that have a greater potential for dividend growth and writing call options to enhance investment income. Under normal market conditions, the Fund invests at least 80% of assets in dividend-paying securities.
Figure 1 – BDJ strategy (blackrock.com)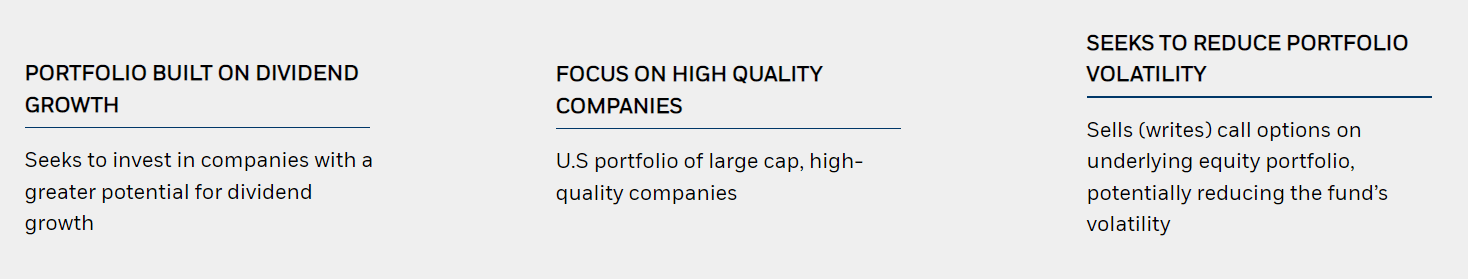
Portfolio Holdings
With its focus on dividends, the fund’s allocation skews toward defensive sectors such as Healthcare (21.2% weight vs. 14.2% for the S&P 500) and cyclical sectors such as Financials (20.9% vs. 10.6%) and Energy (8.5% vs. 4.3%).
Figure 2 – BDJ sector breakdown (blackrock.com)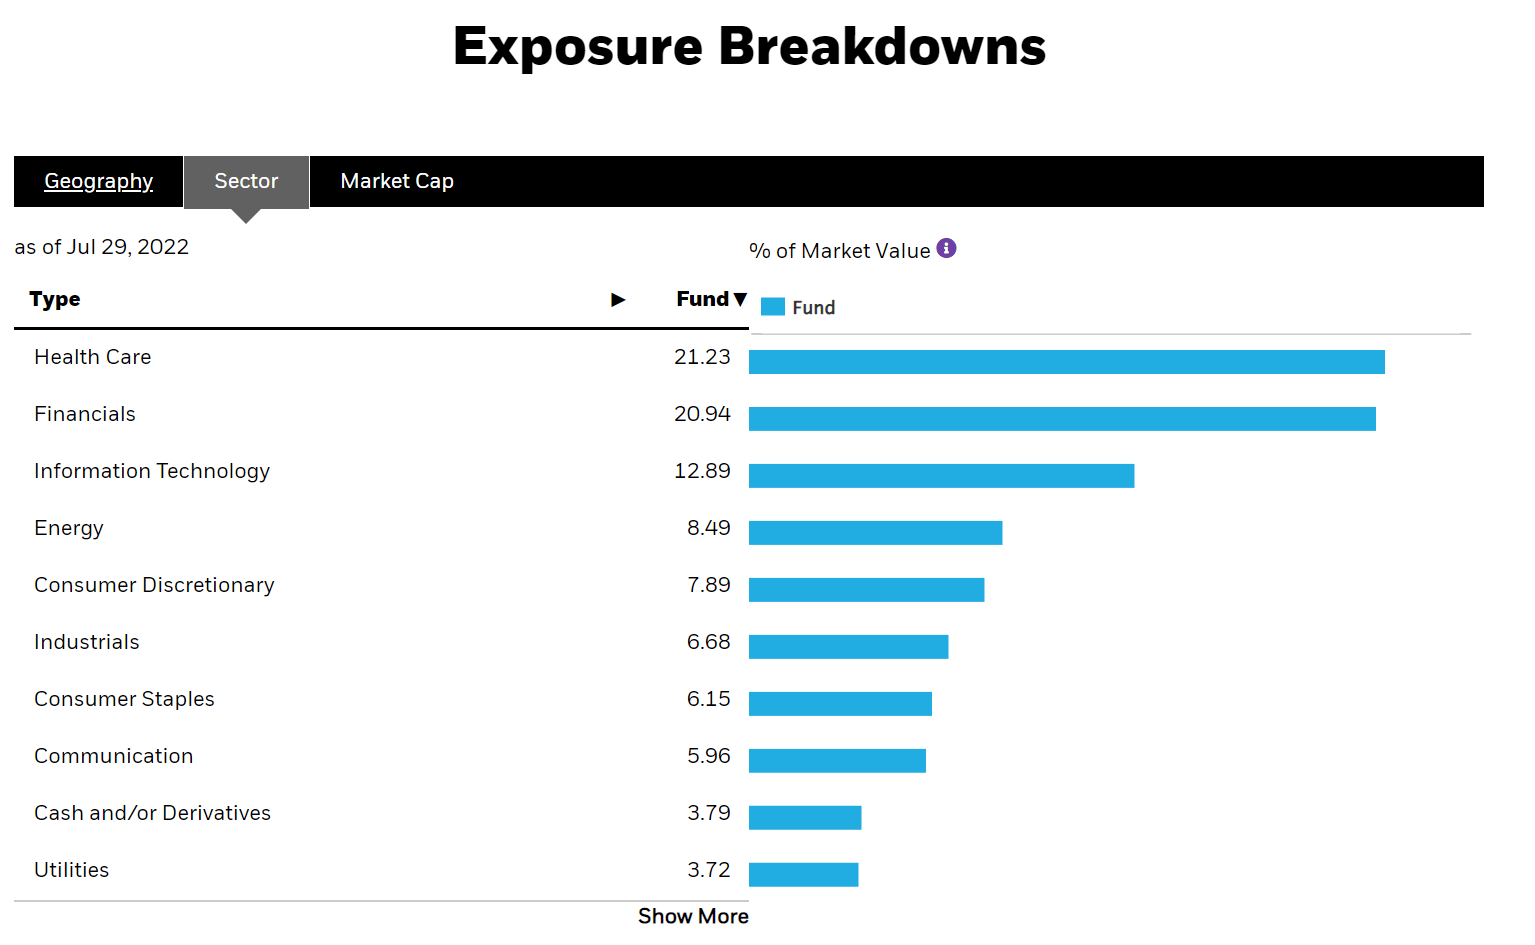
The fund’s top 10 holdings are shown in Figure 3.
Figure 3 – BDJ top 10 positions (blackrock.com)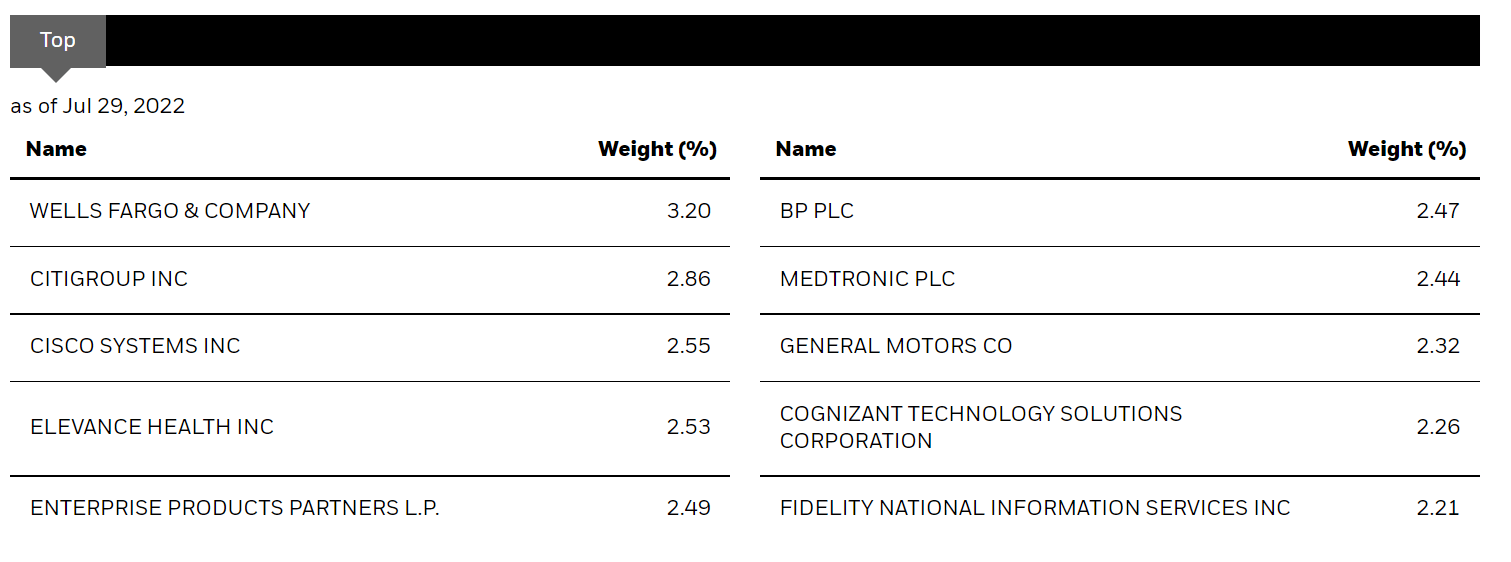
Note that approximately 48% of the portfolio has calls written against them.
Figure 4 – BDJ portfolio characteristics (blackrock.com)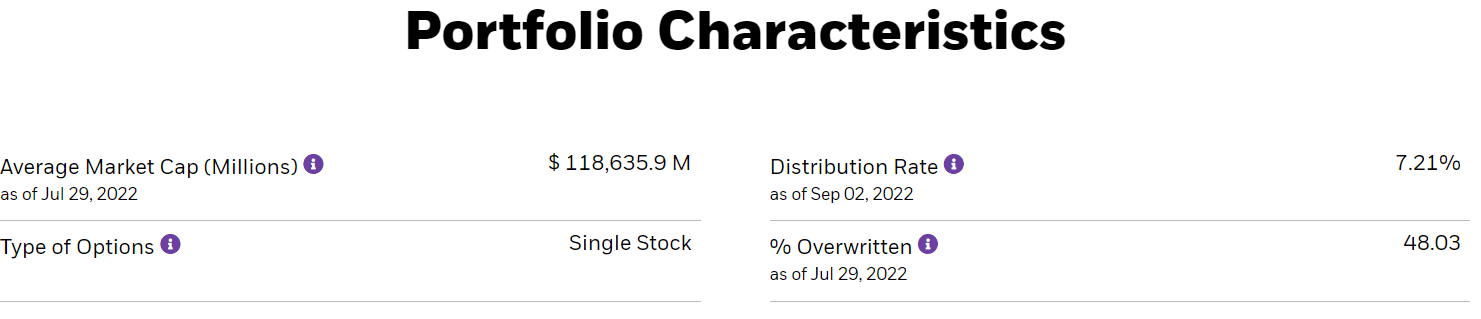
Returns
The BDJ fund has generated solid, but unspectacular returns. On a NAV basis, it has 3/5/10 Yr returns of 8.0%/7.5%/9.1% (Figure 5). This compares to 13.4%/12.8%/13.8% for the S&P 500 on the same time frame.
Figure 5 – BDJ returns (blackrock.com)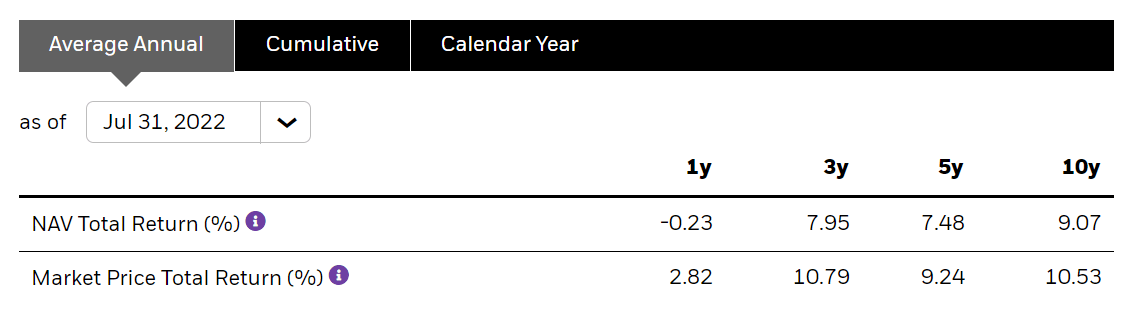
Distribution & Yield
BDJ pays a moderately high distribution yield to investors. Currently, it is set to pay a monthly distribution of $0.0562/share, or a 7.2% current yield. BDJ also pays a periodic special distribution. The most recent special distribution was $0.2688/share, paid in December 2021.
The monthly distribution has generally been on a rising trend, from $0.0467/month in 2019 to $0.05/month in 2020 and recently increased to $0.0562/month in 2022. Note that YTD, the distribution has been funded from investment income and realized gains (Figure 6). BDJ very rarely uses Return of Capital (“ROC”) to fund its distribution.
Figure 6 – BDJ distribution breakdown (BDJ August section 19 notice)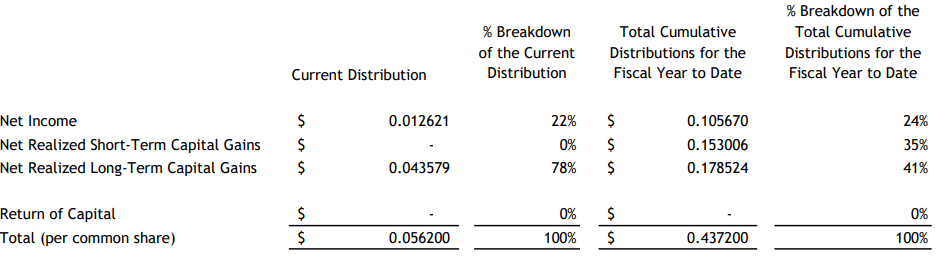
Fees
BDJ’s fees are moderate, at 0.80% management fee and 0.85% gross expense ratio.
Figure 7 – BDJ fees (blackrock.com)
Investors Trading Upside For Income
My main comment on the BDJ Fund applies to all funds that employ ‘call writing’ strategies to generate income. In rising markets, call writing gives up ‘upside’ in exchange for a higher distribution yield. However, the fund remains exposed to downside capture.
For example, in 2020, when the S&P 500 had a sharp COVID crash but ultimately rallied 18.4% for the full year, BDJ only generated total return of 0.8%. In 2021, when the S&P 500 rallied 28.7%, BDJ returned 19.3%. However, in 2018, a down year for the S&P 500 at -4.4%, BDJ returned -6.7%. Figure 8 shows BDJ’s calendar year returns while figure 9 shows the iShares Core S&P 500 ETF (IVV)’s calendar year returns.
Figure 8 – BDJ calendar year returns (blackrock.com)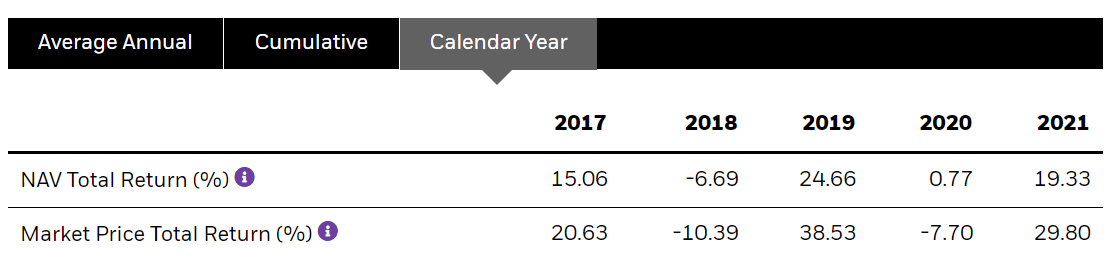
Figure 9 – IVV calendar year returns (ishares.com)
This concept may be better explained using probability and statistics. While the S&P 500 has generated 12% average annual returns since 1928 (10.2% CAGR), the year-to-year distribution is highly variable and can range from -44% to +53%. If we were to write calls and trade away the ‘upside’ for income (for example write an 11% out-of-the-money call for a 5% distribution), then we are essentially giving up most of the right side of the return distribution curve (Figure 10). Therefore, almost by definition, investors will end up worse off since they will only capture the left-sided distributions.
Figure 10 – S&P 500 Annual Returns Histogram (Author created with returns data from upmyinterest.com)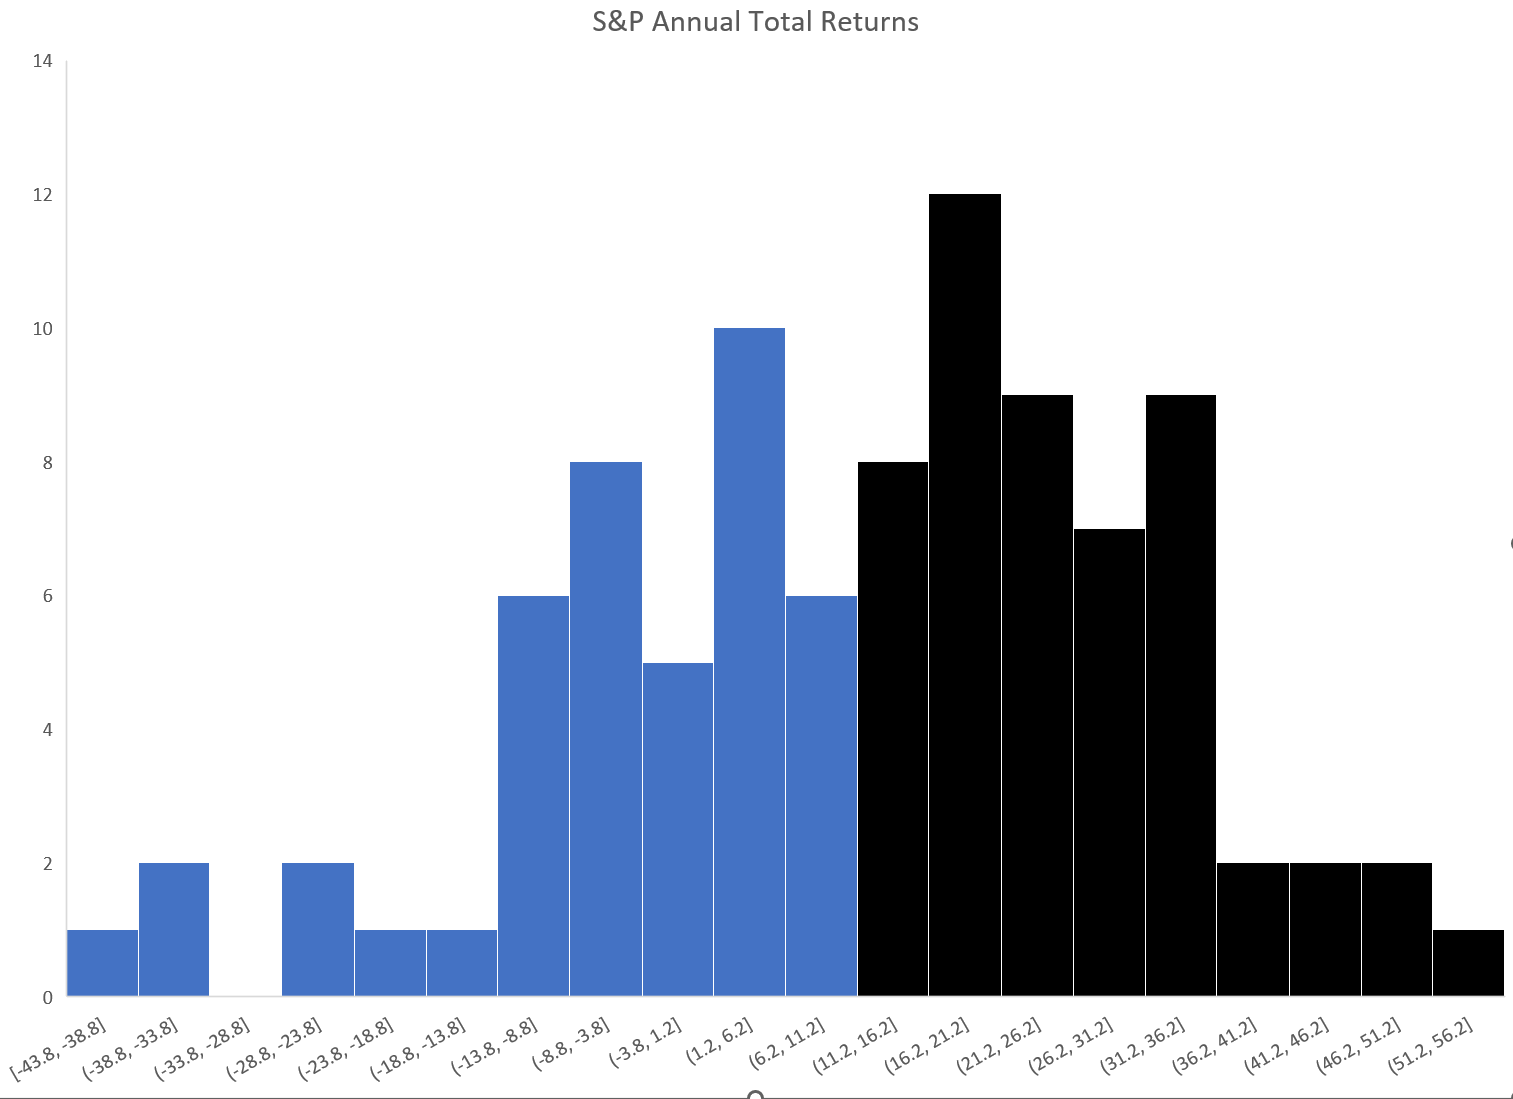
Writing calls is especially problematic during market drawdowns, as rallies can be fast and furious, and calls written near the lows will get triggered quickly, stunting any portfolio recovery, like what happened in 2020.
Selling VIX Futures May Be A Better Mouse-Trap
An alternative to writing calls to generate income may be to sell moderate amounts of VIX futures, like the strategy employed by the Simplify Volatility Premium ETF (SVOL) that I recently reviewed. While still early days, the fundamental idea behind selling VIX futures to generate income makes more sense than writing calls, as it does not cap portfolio returns upside as shown in the example above. On the other hand, I am still waiting to see more evidence SVOL’s tail hedge can protect against outsized drawdowns.
In the coming quarters, I will be closely tracking the performance of SVOL to compare and contrast its VIX-selling strategy against call writing strategies like BDJ and the Global X S&P 500 Covered Call ETF (XYLD). Stay tuned!
Conclusion
While BDJ’s current yield of 7.2% is attractive, investors should understand that BDJ’s call writing strategy trades away ‘upside’ for current income. Personally, I prefer to focus on total returns and thus would avoid call writing strategies.
Be the first to comment