

PM Images
Written by Nick Ackerman, co-produced by Stanford Chemist. This article was originally published to members of the CEF/ETF Income Laboratory on August 28th, 2022.
BlackRock Enhanced Equity Dividend Trust (NYSE:BDJ) has been one of my core covered call writing funds for several years. It continued to trade at deep discounts for years. More recently, though, the fund has begun to stretch its valuation. We are now seeing a premium show up on the fund. That hasn’t happened since 2011.
One of the reasons for this could be the fund’s strategy. They utilize a covered call strategy on a portion of their individual holdings. They also have a portfolio that is tilted towards healthcare and financials. Healthcare is a defensive sector that can perform in any environment.
Financials are a more cyclical sector but should benefit from higher interest rates producing more earnings. Of course, we have seen that bank expenses are rising, as noted in JPMorgan’s (JPM) latest earnings call. A softer economic forecast also leaves the sector in an odd position.
That being said, it is a great differentiator from the overall “market” that has seen its shift go towards mega-cap tech names more and more over the years. I love tech just as much as the next person, but I’m conscious of not wanting to put too much into one sector. With an income focus, tech is generally not all that appealing in that objective, either.
The Basics
- 1-Year Z-score: 2.18
- Premium: 1.18%
- Distribution Yield: 7.15%
- Expense Ratio: 0.85%
- Leverage: N/A
- Managed Assets: $1.73 billion
- Structure: Perpetual
BDJ’s primary objective is to “provide current income and current gains.” The fund intends to achieve this by “investing in common stocks that pay dividends and have the potential for capital appreciation.” They concentrate on dividend-paying stocks with “80% of its total assets in dividend-paying equities.”
They will also utilize an option strategy on single stocks within the portfolio to “enhance distributions paid to the Trust’s shareholders.” The fund last reported being overwritten by 48.13%. This is quite a substantial portion of their portfolio, considering their target is between 30 to 40% overwritten.
The fund’s expense ratio is quite low for a closed-end fund structure. This is a common feature with most of BlackRock’s (BLK) funds. Being a massive asset manager means you have more flexibility on what you can charge to operate a fund. With no leverage being utilized on the fund, that’s also one less thing to worry about.
Performance – Valuation Stretched
Here we can see how BDJ has performed YTD relative to the SPDR S&P 500 (SPY). As mentioned, the fund’s positioning and strategy have contributed positively relative to the broader market.
Ycharts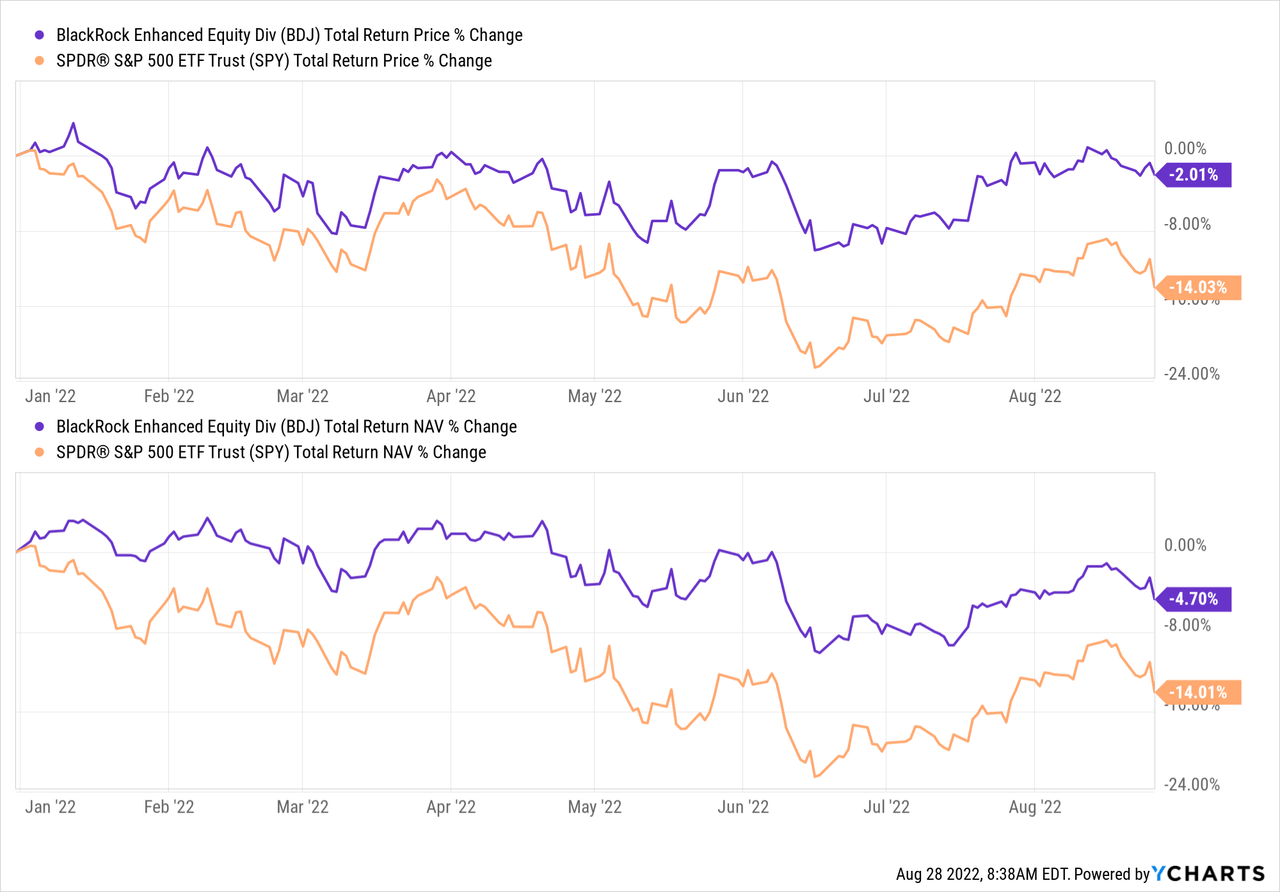
Over the longer term, we would have seen the opposite, where BDJ underperformed most of the last decade. This is due to several reasons. Of course, the positioning towards the value sectors and away from growth and tech was a large factor.
Additionally, BDJ is focused on being an income generator for its shareholders. The fund utilizes managed distributions that keep a level payout to investors for sometimes years.
To do that, they pay out from sources of income, capital gains and return of capital. When capital gains are realized now, that leaves less in the fund to compound off of later. I view SPY as a total return or growth investment, not an income investment.
While low for the CEF structure, the fund’s expense ratio will also play a role in reduced performance.
All that being said, the fund’s current premium is a rare spectacle. This fund hasn’t touched a premium since 2011, making the latest premium expensive relative to its historical level.
Ycharts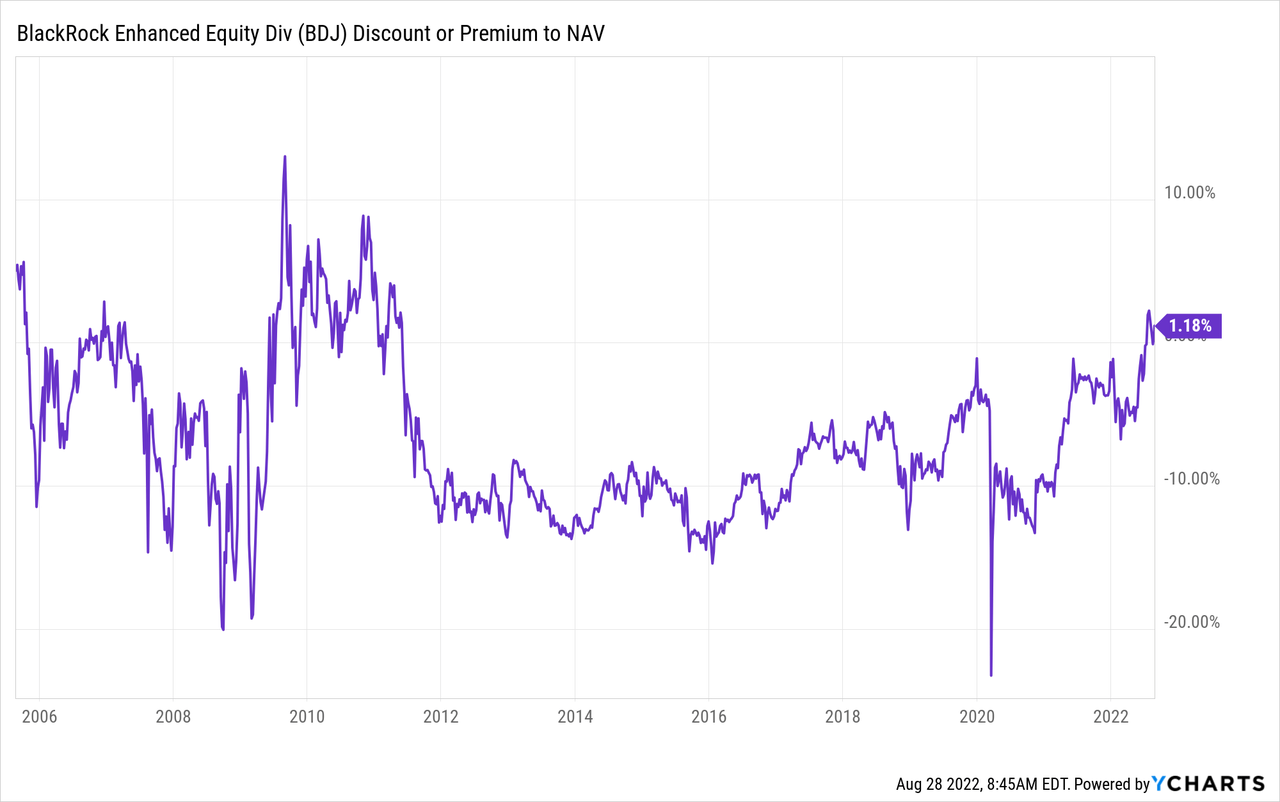
On the other hand, equity markets across the board are still being pressured. If we get a rebound from these levels, BDJ could participate in more upside. I believe it would be relatively capped as the downside for the fund – as we saw – hasn’t been nearly as bad as the broader market.
BDJ Distribution – Attractive 7.15% Rate
The fund had bumped up its distribution earlier this year in March. That was the second bump since the fund had cut its distribution a few times following the GFC. However, the historical chart might look a bit unusual. The fund went to a monthly payout, then quarterly, then back to monthly.
BDJ Distribution History (CEFConnect)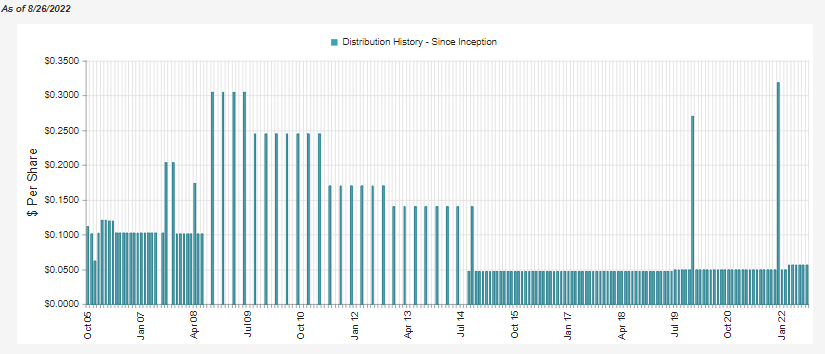
The latest distribution reaches a NAV rate of 7.24%, with its market price yield only at 7.15%. That reflects the fund’s slight premium, meaning the fund has to generate more earnings than shareholders receive. That’s the opposite of what we want to see.
Since the fund is holding up so well, I don’t think we will need to see a cut this year. In fact, the fund has already earned its entire distribution for the year based on net investment income and capital gains realized. NII comes in quite short alone, but that’s typical for an equity fund.
BDJ Semi-Annual Report (BlackRock)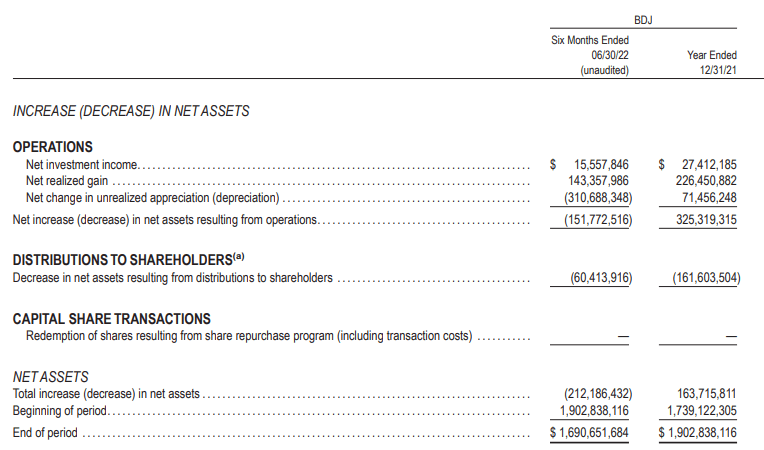
The realized gains, on the other hand, were massive so far. Of course, we can also see that there was sizeable unrealized depreciation in the underlying portfolio.
Based on the outstanding shares of 186,003,434 and the annualized $0.6744 distribution, we would anticipate the fund requiring $125.44 million for its payout. That makes the $15.558 million NII and $143.358 million in realized gains already enough in the first 6 months of the year.
One thing that has helped contribute to the gains was the options premium the fund collected. It wasn’t substantial, but it certainly didn’t hurt, either.
BDJ Semi-Annual Report (BlackRock (highlights from author))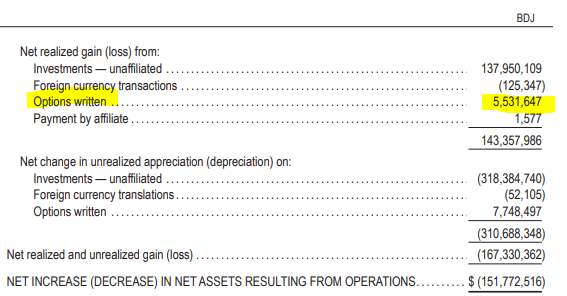
For tax purposes, the bulk of the distribution was long-term capital gains, as one would expect in 2021. We also see a hefty portion identified as qualified dividend income; and, to a small degree, some non-qualified dividend income or ordinary income. I believe that makes it appropriate for a taxable account with these types of distribution classifications. They are generally lower tax obligations for most investors.
BlackRock Tax Classifications (BlackRock (highlights from author))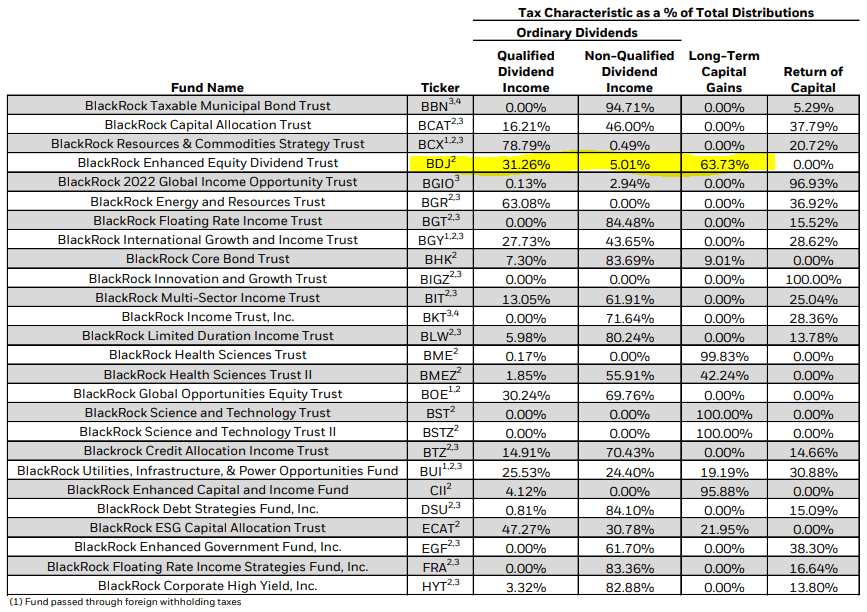
If the earnings are any indication so far, the distribution classification could be similar for 2022. As I’d always caution, anything can happen between now and the end of the year. Something drastic could happen, and the expected tax character could shift significantly.
BDJ’s Portfolio
Since we last touched on the fund, the weighting of the sector allocation has shifted. The previous data we looked at was at the end of January 2022. It had financials at nearly 26% and healthcare at 21%. While healthcare exposure has essentially stayed flat, the financial exposure was reduced by a relatively meaningful amount. Energy also saw a small boost in its allocation.
BDJ Sector Allocations (BlackRock)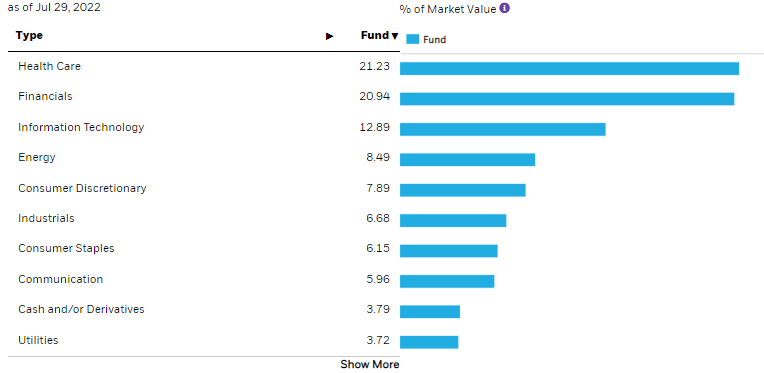
One thing that could have contributed to that besides different positioning within the fund could have simply been the relative performance of the underlying names. The fund reported a turnover rate of 26%. It is frequently between the 40 and 50% turnover rate, too, so the managers are active.
Enterprise Products Partners (EPD) and BP (BP) have made their way up on the top ten list with growing weightings.
BDJ Top Ten (BlackRock)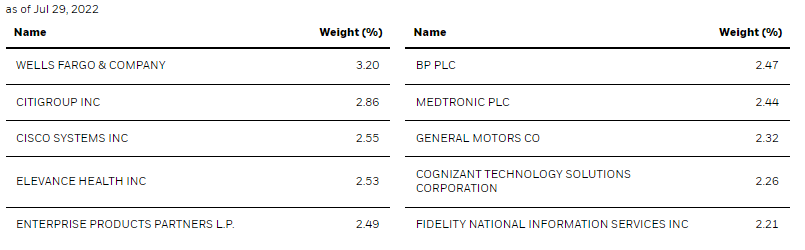
Wells Fargo (WFC) and Citigroup (C) have both been reduced in their weightings, while Bank of America (BAC) has completely fallen off the top holdings list. BAC was listed as a position at the end of June 30th, 2022, found on the semi-annual report.
Interestingly, we also see that General Motors (GM) now makes its way into the top ten too. This is a name that I believe might have been consciously added.
Here’s a look at the performance of these names and how they’ve performed from the end of January to the end of July. We can see that EPD and BP have thrived or held up well relative to the other names.
That makes sense then that they would make some moves higher on the top ten list for BDJ. BAC had performed poorly; thus, we see the opposite happen where the fund isn’t a top holding anymore.
Ycharts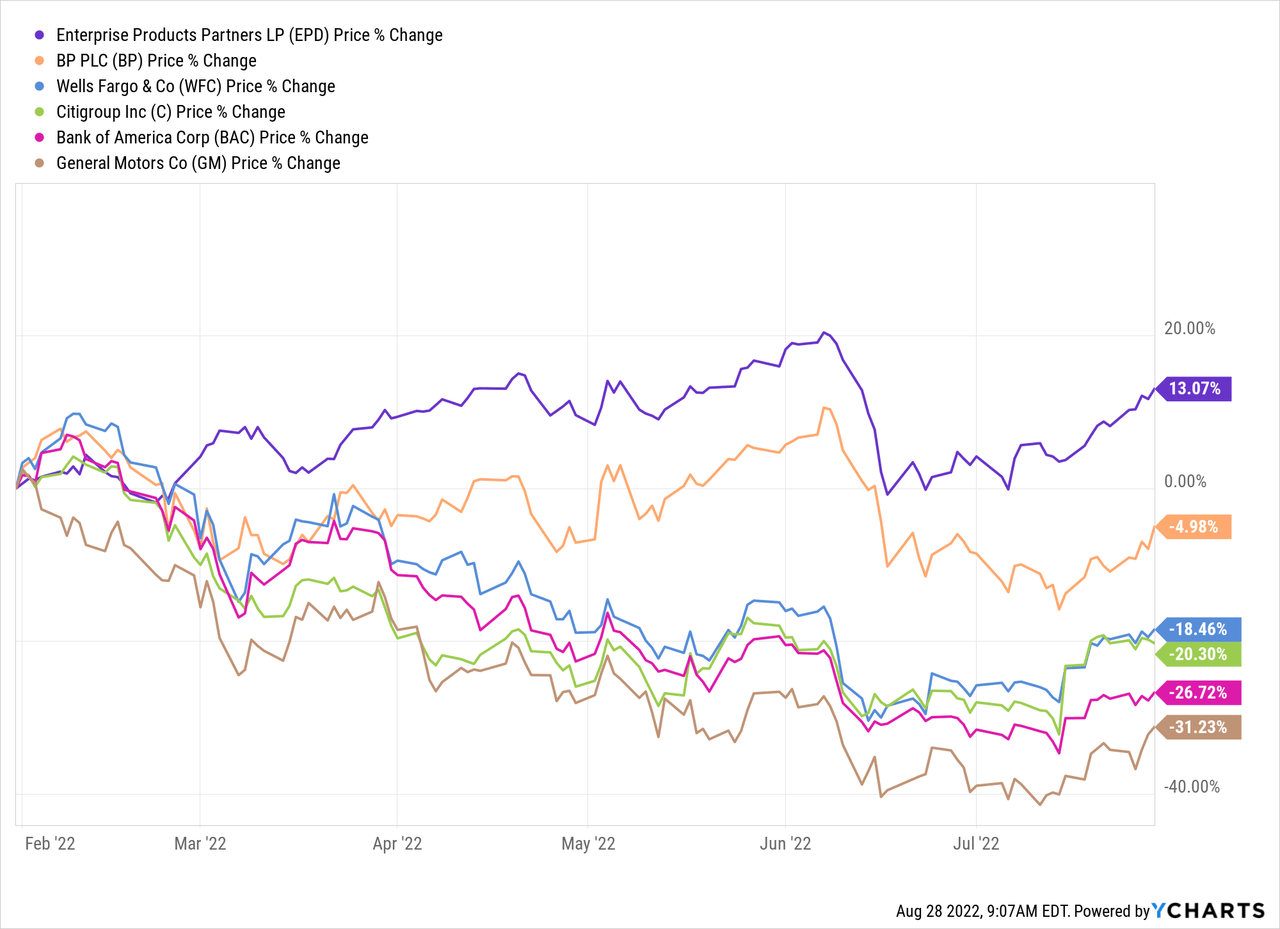
We can see GM performed the worst of this bunch. That’s what suggests to me that they consciously added to the position in the period reflected above. The semi-annual report showed the stock at a 2% weighting. The previous annual report showed that BDJ held 643,807 shares of GM. This was increased to 1,067,062, so they have definitely been adding.
When looking at BAC, they took their total share count from 1,104,331 to 863,441. WFC went from 1,521,080 to 1,287,552. For C, we saw shares held go from 925,758 to 972,863 – meaning they added to their allocation a bit.
EPD also saw its unit count bumped up from 1,487,454 to 1,644,702. BP went from 7,597,042 to 8,946,829.
All this means that the managers have been shifting around the portfolio, but it has also been shifting due to the gyrations of the underlying holdings. Energy, in particular, would have seen the largest benefit. We have seen energy hold up very well on a YTD basis relative to all other sectors.
The relative performance of the financial sector has it in about the middle on a YTD basis. The managers trimming BAC and WFC positions seems to have contributed to the overall reduced financial weighting.
Conclusion
BDJ will remain a core-type position for me. Something I can set and forget about. They help provide a differentiated approach to a market that has become increasingly reliant on mega-cap tech names to perform. Due to its value-tilt and covered call-writing strategy, the fund has held up better YTD. That being said, the fund’s valuation also isn’t attractive as it once was. That makes me a bit more cautious, and I would probably avoid adding new positions at this level.
Be the first to comment