

Darren415
This article was first released to Systematic Income subscribers and free trials on Oct. 1.
Welcome to another installment of our BDC Market Weekly Review, where we discuss market activity in the Business Development Company (“BDC”) sector from both the bottom-up – highlighting individual news and events – as well as the top-down – providing an overview of the broader market.
We also try to add some historical context as well as relevant themes that look to be driving the market or that investors ought to be mindful of. This update covers the period through the last week of September.
Be sure to check out our other Weeklies – covering the Closed-End Fund (“CEF”) as well as the preferreds/baby bond markets for perspectives across the broader income space. Also, have a look at our primer of the BDC sector, with a focus on how it compares to credit CEFs.
Market Action
It was a brutal September for BDCs with around a 14% drop. Unusually, BDCs underperformed the broader income space in September – only the mREIT sector posted a worse return.
Systematic Income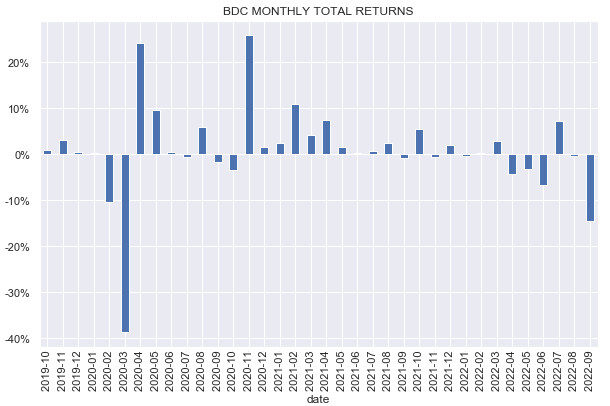
The sector has moved well below its June low and is around 28% off its peak. It has also done a roundtrip in the last three years, moving back to its starting point in total return terms.
Systematic Income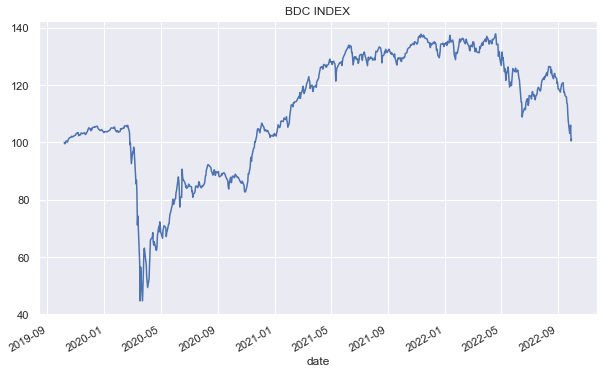
Our holdings such as Blackstone Secured Lending Fund (BXSL), Golub Capital (GBDC), Trinity Capital (TRIN) and Oaktree Specialty (OCSL) outperformed the sector in September, though they still faced significant drops.
Systematic Income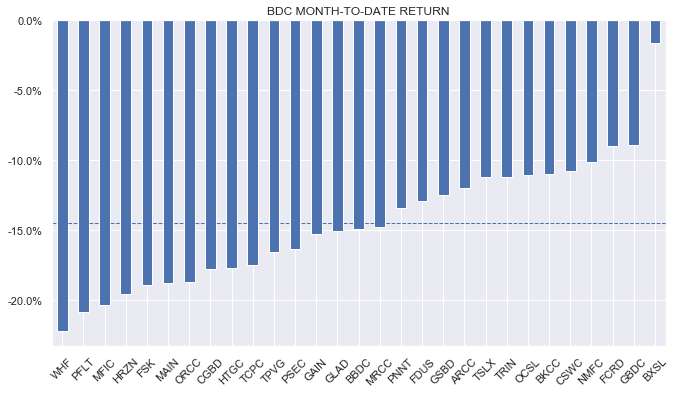
The beta of the sector relative to Treasuries has risen significantly (more than its beta to stocks). There is no obvious reason why this should be the case (given the low duration profile of BDCs) apart from the typical higher-beta / risk sentiment / recession worries that often cause BDCs to underperform.
Systematic Income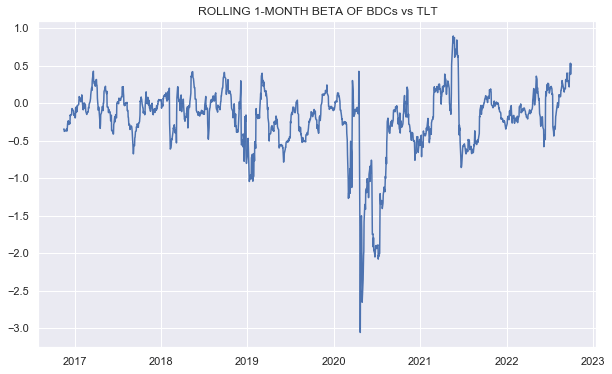
Short-term rates rose about 0.35% in September – further raising the net income profile of the sector. A number of BDCs raised their dividends during the month which suggests sector income levels continue to rise and that portfolio quality is not falling off a cliff.
Sector traded volume rose but remains well below its June level and a fraction of its 2020 level.
Systematic Income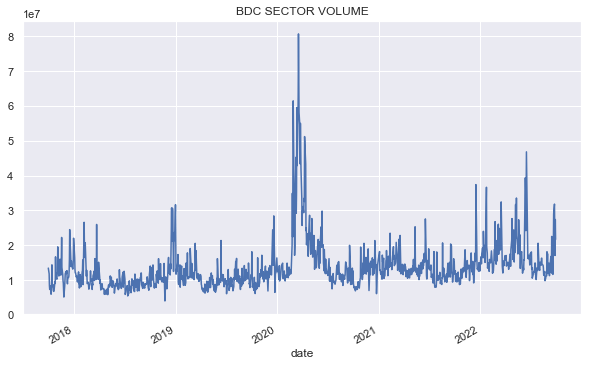
Sector valuation has only been lower during the GFC and the COVID crash and is in line with the troughs seen during the Euro crisis, the Energy crash and the Fed auto-pilot tantrum. Given we don’t expect the next recession to carry existential risks (unlike GFC and COVID), the current sector valuation looks very attractive in aggregate. Obviously, this valuation is off a relatively stale Q2 NAV; however, default rates remain low and credit spreads finished Q3 below their Q2 levels which argues for possibly a modest drop in NAVs from Q2.
Systematic Income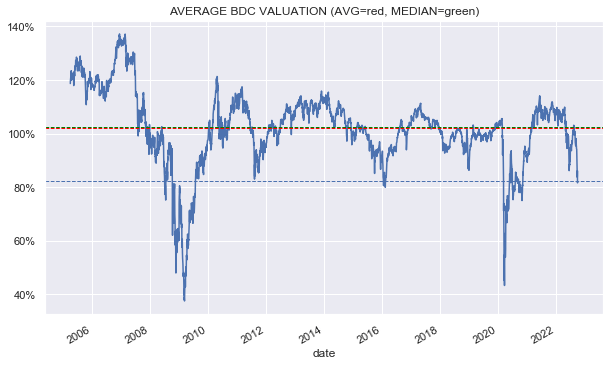
BDC Tool Update
This week we added another metric to our subscriber BDC Tool. The new metric captures the given stock’s historic valuation percentile. Given the sharp drop of the sector in recent days, it’s particularly interesting to see how the latest valuation compares to its historical level.
Systematic Income CEF Tool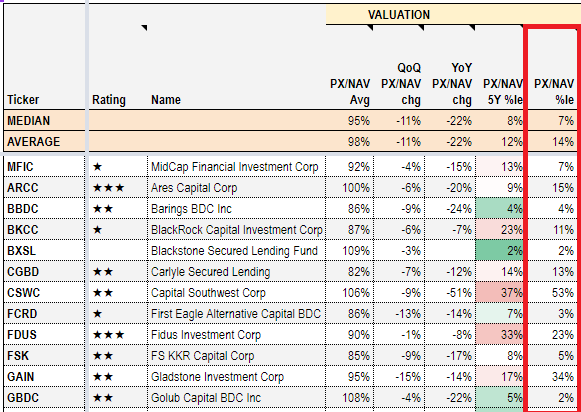
The new metric is called the PX / NAV %le for short which stands for the price / NAV percentile or, simply, the valuation percentile. As an example consider the 2% figure for GBDC. What it means is that GBDC has only traded at a lower valuation than its current 81% 2% of the time in its history. The starting period in question is April of 2010 to today. This suggests that GBDC is attractively valued on a relative basis (i.e. relative to its own history). On the other hand, the 53% figure for Capital Southwest (CSWC) shows that the current valuation of CSWC is about in line with its historical median level.
Keep in mind that this metric is not directly comparable across different BDCs because the starting point for each BDC is different (the 5Y percentile figure in the adjacent column is better for this purpose).
Also some BDCs don’t have a particularly long public history. For example, while the very low figure for TRIN might signal it’s especially cheap relative to its own history, TRIN only started trading in 2021 – a period when BDC valuations were well above current levels.
Also keep in mind that BDCs change. For example, it might make sense for a particular BDC to warrant a high valuation (if it outperformed the sector earlier in its life) and a lower valuation (if it has underperformed the sector more recently).
Stance And Takeaways
This week we took advantage of the air pocket in the sector and added to our BDC allocation by rotating from a fixed-income mutual fund that has held up reasonably well this year. Specifically, we added to our OCSL position in the Core Income Portfolio and to our TRIN position in the High Income Portfolio. We also see value in Carlyle Secured (CGBD) and PennantPark Investment (PNNT) at current levels.
Be the first to comment