

Darren415
This article was first released to Systematic Income subscribers and free trials on Sep. 3.
Welcome to another installment of our BDC Market Weekly Review, where we discuss market activity in the Business Development Company (“BDC”) sector from both the bottom-up – highlighting individual news and events – as well as the top-down – providing an overview of the broader market.
We also try to add some historical context as well as relevant themes that look to be driving the market or that investors ought to be mindful of. This update covers the period through the first week of September.
Be sure to check out our other Weeklies – covering the CEF as well as the preferreds/baby bond markets for perspectives across the broader income space. Also, have a look at our primer of the BDC sector, with a focus on how it compares to credit CEFs.
Market Action
BDCs were under pressure this week with a 3% drop. This year only the two months of March and July saw gains in the sector.
Systematic Income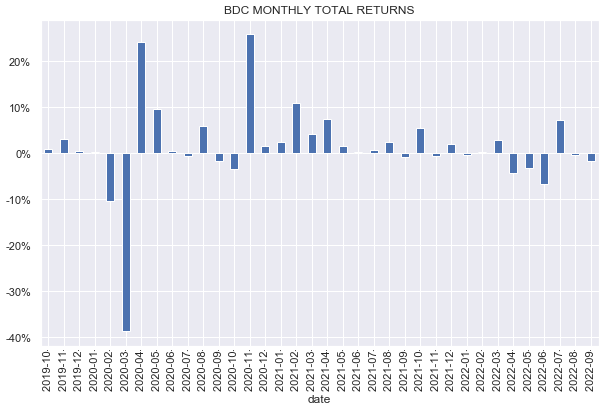
The sector has given back about half of its recent recovery and stands roughly where it was in early June after a big roundtrip. The year-to-date return is around -7%. That still puts it among the best across the income space.
Systematic Income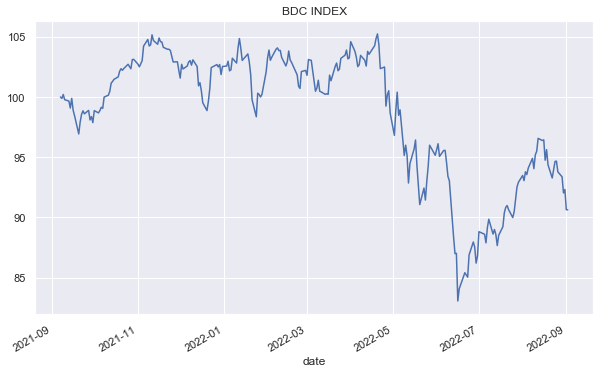
The average sector valuation of 96% is around 6% below its historic average and is in the fair-value range in our view given the broader macro dynamics.
Systematic Income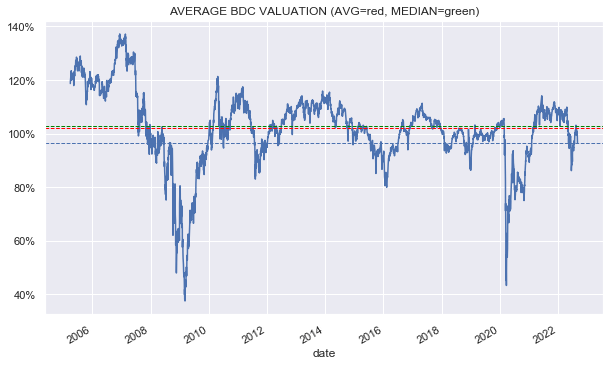
Market Themes
Higher base rates are one of the key themes relevant to the BDC sector. Given predominantly floating-rate assets, BDC net income will see a boost from the rise in base rates, all else equal.
Many BDCs have already hiked dividends in expectation of a rise in net income and some BDCs are guiding to a significant uplift in net income over Q3. The average BDC is expected to see a net income jump of 12% for a 1% rise in base rates from the end of Q2. Rates have already risen 0.8% from that level as the Fed continues in its attempt to rein in inflation.
Moreover, BDC net income figures released in Q2 do not fully reflect even the base rates as of the end of Q2 as higher rates only flow through net income with a significant lag of around 3-6 months. For instance, BXSL said on the call that their net income would have been 18% higher if its loans were accrued at Q2-end level of base rates.
The evidence that runs counter to this optimistic scenario is simple – in the last hiking cycle net income or core ROE actually fell as this chart shows.
JPM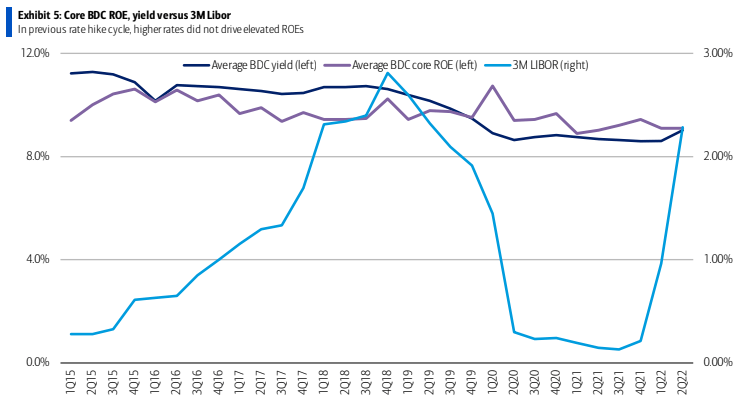
A repeat is clearly a risk and it’s worth highlighting. That said, we are somewhat more optimistic as there are a number of key differences between this tightening cycle and the previous one.
First, the rise in base rates has been significantly higher and steeper this cycle than it was in the previous one. Rates have already risen by over 3% (and are expected to keep rising) versus a rise of 1.8% in the last cycle. As a proxy for base rates the 3-Month Treasury Bill rate shows how the two cycles compare so far.
FRED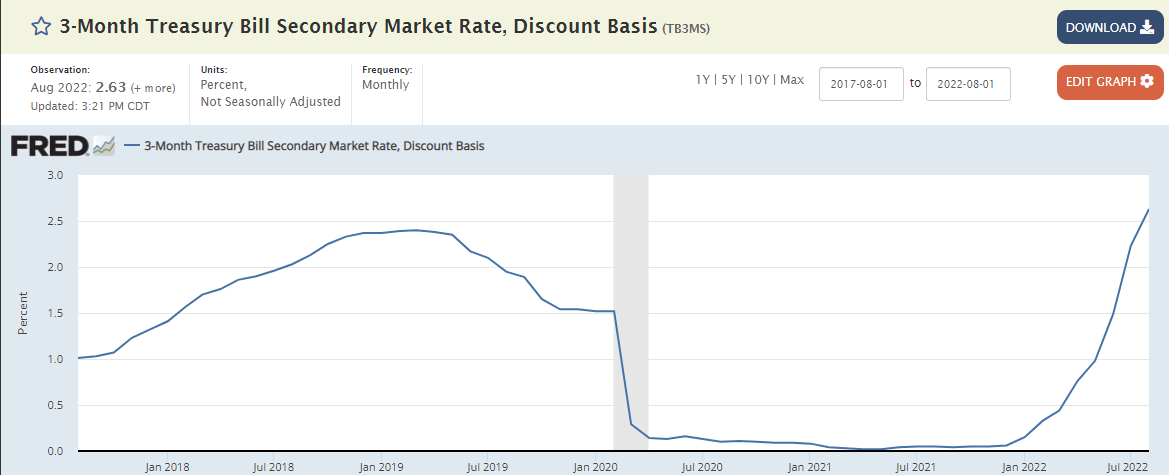
Secondly, we are starting off at a significantly lower level of defaults so there is a lower initial income headwind from defaults this time around. In the last cycle, loan default rates peaked in 2014 at around 4% due to the distress in the Energy/resources sector – more than 10x above the current level.
S&P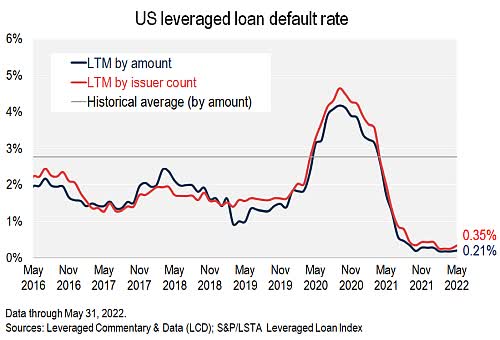
Additional concerns are around tighter spreads, higher credit costs and lower leverage. BDCs that have commented on the level of credit spreads have universally said that spreads are wider – that’s pretty much the reason why NAVs have come in lower in Q2. Credit costs are indeed higher but the average BDC only has about half of its liabilities in floating format. Floating-rate liabilities are also about a quarter of its floating-rate assets. And finally, leverage has not meaningfully decreased over Q3 – in fact it increased somewhat and not just because of a drop in NAVs but due to an increase in net new investments.
Overall, we remain fairly upbeat about Q3 net income levels. We don’t expect BDCs to see a double-digit increase but a solid single-digit bump is not a crazy scenario.
Market Commentary
BDC PSEC finally reported results (more on the timing in the next paragraph). NAV fell just over 3% – that’s a bigger than average drop and not overly surprising for a portfolio which is higher-beta in nature with significant CLO Equity and REIT exposure. Basic net income (excluding the preferred dividends) ticker higher by a penny to $0.21.
PSEC make a big song and dance about how they run a very low leveraged portfolio and that’s true; however, there are two important points. First, there is more embedded leverage and cyclicality within the portfolio than for an average BDC due to CLO Equity and REIT holdings.
And two, PSEC have decided to use preferred equity for a big chunk of their financing over debt. Only one other BDC – CGBD – does this and only for a small portion of financing which was done as a precautionary measure in 2020 with an affiliate. This means that common shareholders still have to pay out dividends to preferreds shareholders as they would to debt holders but at a higher dividend rate, meaning there is less left on the common, all else equal.
PSEC focus on net income that strips out preferred dividends which is OK – they can publish any figure they want – but it’s a little misleading since preferred dividends are a real cost to common shareholders. It’s also somewhat misleading as the size of the preferreds have been growing, meaning a larger and larger income outflow is not showing up in their preferred version of net income.
PSEC had to delay its annual report and earnings release because of a snafu in its CLO valuation reviews. Management expect to report a weakness in its internal controls over CLO financial reporting. Seems like the issue itself has less to do with CLO marks in the portfolio and more to do with the review procedures. Best case scenario here is that the CLO valuations are perfectly fine but that John Barry signs off on them while playing pinochle on his iPad while floating in his pool. Overall, this is probably not a huge deal, particularly given the low allocation to CLOs in the portfolio but it’s not a great look. The stock fell 6.5% on the news but has clawed back some of it.
Be the first to comment