

Baris-Ozer/iStock via Getty Images
Do you love high-yield? I know I do. That’s one of the reasons I and so many income investors and retirees love midstream, the energy utilities that own and operate North America’s pipelines and oil & gas distribution systems.
But do you know what many income investors and I hate? K1 tax forms.
While most tax preparation software and CPAs have no trouble with K1s, some horror stories out there give many investors pause.
For example, I heard from one reader about how Turbotax full service dropped their 2021 tax return just one week before the filing deadline. Why? Because a single unfilled box in one of their K1s made it too hard for Turbotax’s experts to do.
Mind you this was merely an inconvenience (they filled out everything other than the K1), but it did mean that this reader had to mail their state and federal returns, which ended up costing $50 and taking some extra time.
But for those that love the yield of midstream but hate K1 tax forms, there is supposedly a great alternative that is very popular on Seeking Alpha, the Alerian MLP ETF (AMLP).
Why is this so popular? How about a 7.5% yield with no K1 tax form?
Ycharts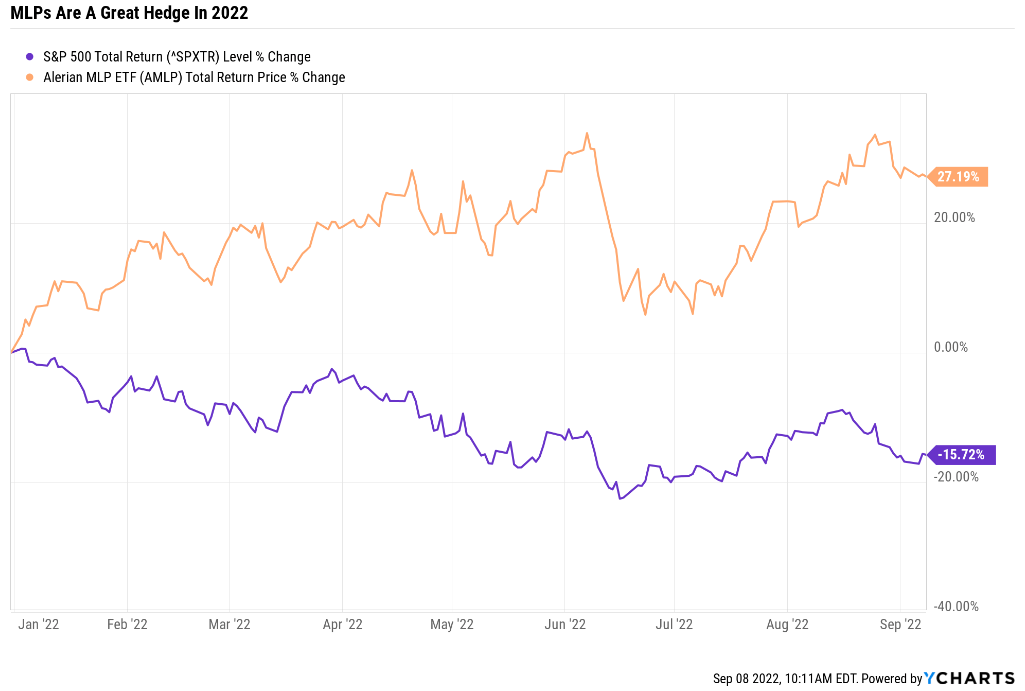
How about being up 27% in 2022 and outperforming the market by 43%!
Talk about sleeping well at night and getting paid to ride out the bear market in style! My god, this is such an amazing ETF; everyone should own it right?
WRONG! In fact, AMLP, the most popular MLP ETF, is actually a dangerous yield trap you should avoid like the plague. The lack of a K1 tax form and this year’s great return are the only redeeming qualities in an otherwise low-quality value trap.
So let me show you the three reasons why AMLP is a dangerous “sucker yield” and why those seeking the joys of safe midstream super yield, with NO K1 tax forms, have 6 far better blue-chip alternatives they can safely buy today.
Reason One Alerian Is A Yield Trap: It Owns 70% Low-Quality MLPs
There is nothing more important to long-term safe yield and strong returns than the quality of your assets. A diversified portfolio of crap is still crap.
If you’re tired of losing money, stop buying crap. – Kevin O’Leary
(Source: Morningstar) (Source: Morningstar)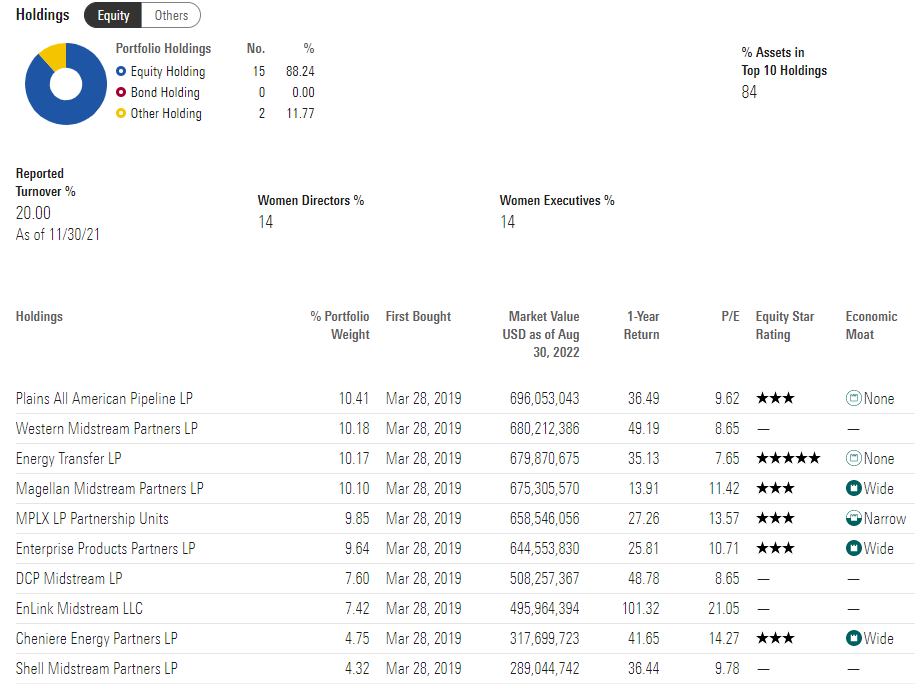
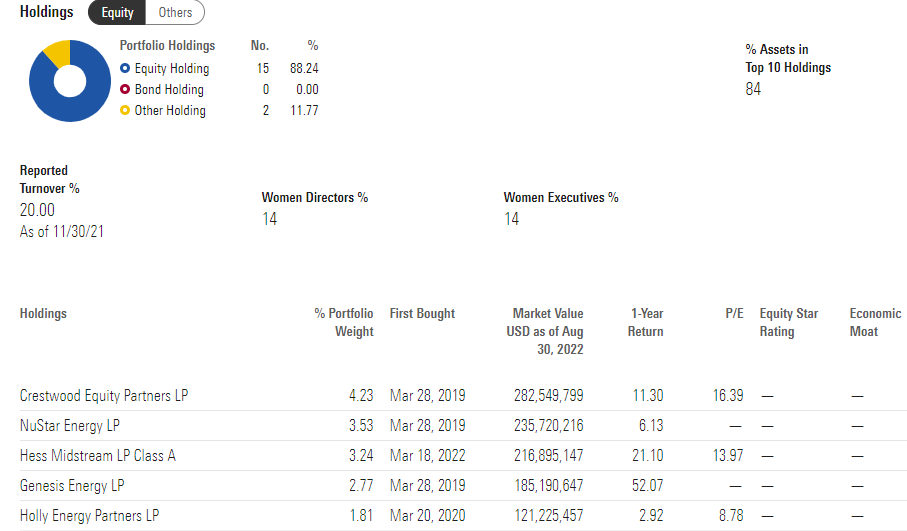
AMLP owns 15 MLPs, and just three are worth owning.
- EPD, MPLX, and MMP
- 70% of its portfolio is in unsafe MLPs
If you own 70% unsafe yield traps, you should expect terrible income security, and terrible long-term returns. Guess what investors in AMLP have gotten over the years?
Reason Two Alerian Is Sucker Yield: A Terrible Dividend Track Record
There is a saying on Wall Street, “when in doubt, zoom out”.
This means using long-term historical track records to see whether or not an investment is too good to be true.
Ycharts
Does this seem like a high-yield ETF that retirees can depend on in all economic and market conditions?
The 2016 cut? Sure that’s when a lot of MLPs cut due to the oil crash and having to shift to a self-funding business model.
But AMLP’s distribution kept falling long after most MLPs started raising their payouts again. Why?
Because of what AMPL owns.
Ycharts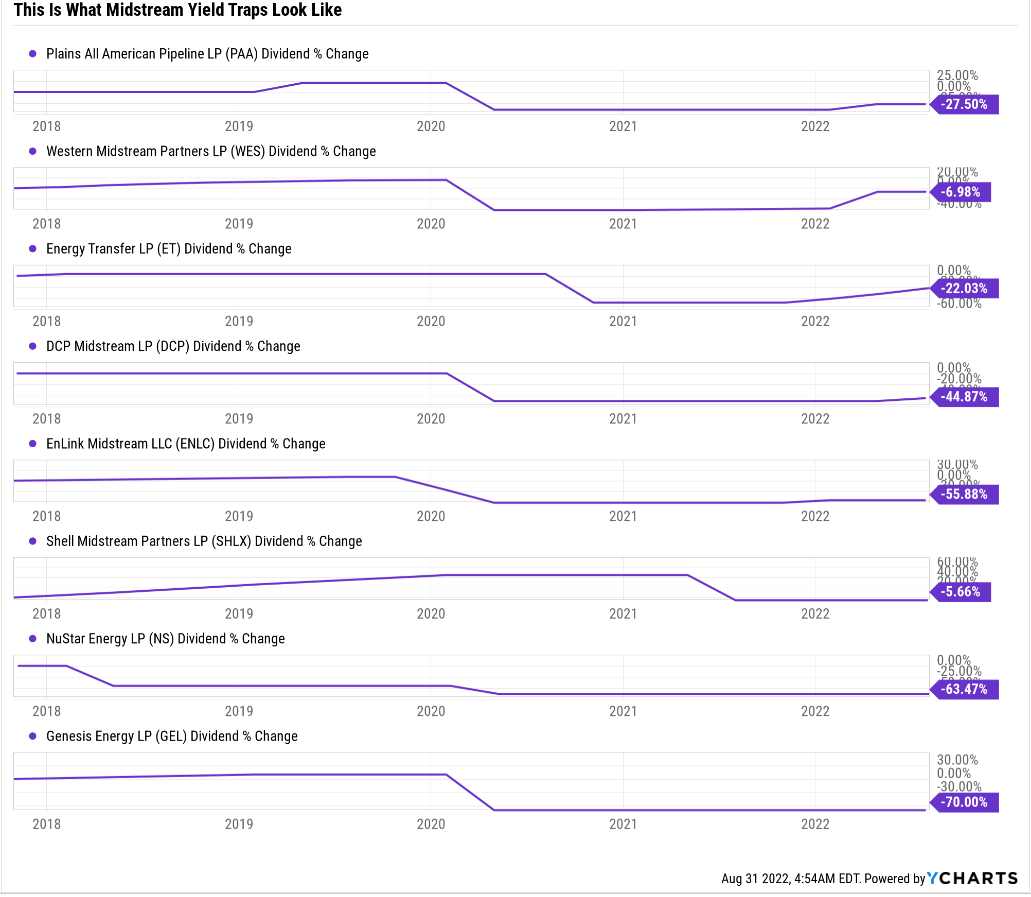
AMLP’s holdings are a murder’s row of low-quality sucker yield that I’ve spent three years warning Dividend Kings members to avoid.
Wait a second though. Wasn’t 2016 through 2020 the single worst time for midstream and oil & gas in history?
Market Insider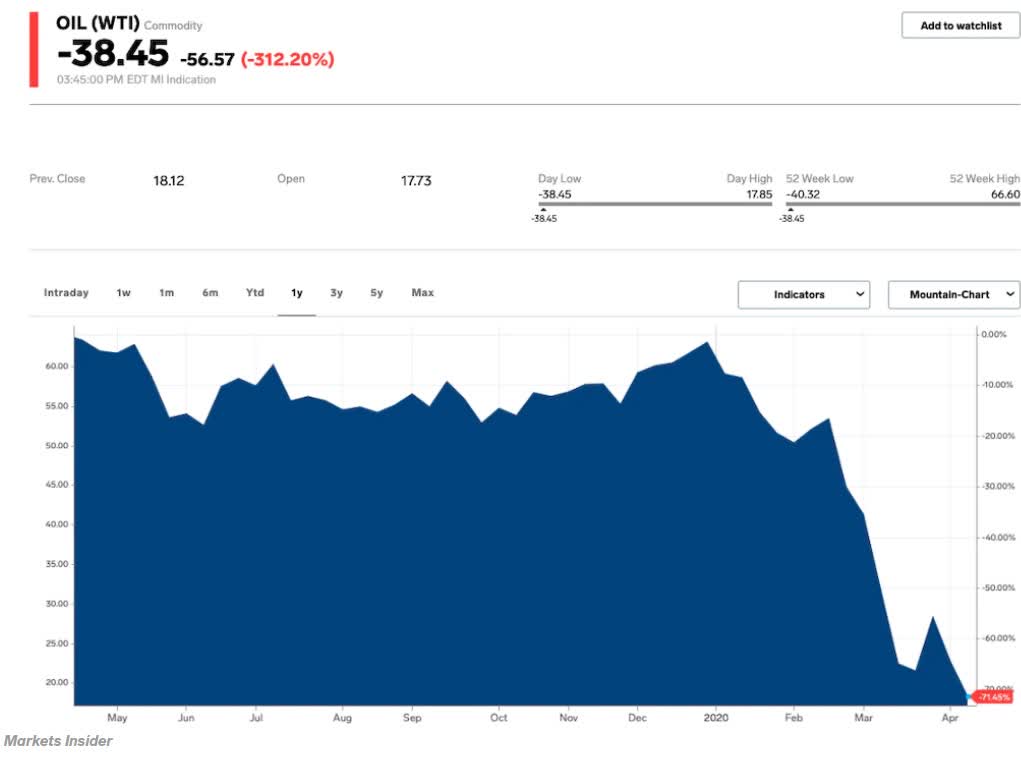
For God’s sake! Oil hit -$38 on April 20th, 2020! How on earth can anyone blame so many MLPs for cutting their distributions during an event so crazy that oil traded negative!
Except for one simple fact. Plenty of midstreams cut their dividends or distributions.
Ycharts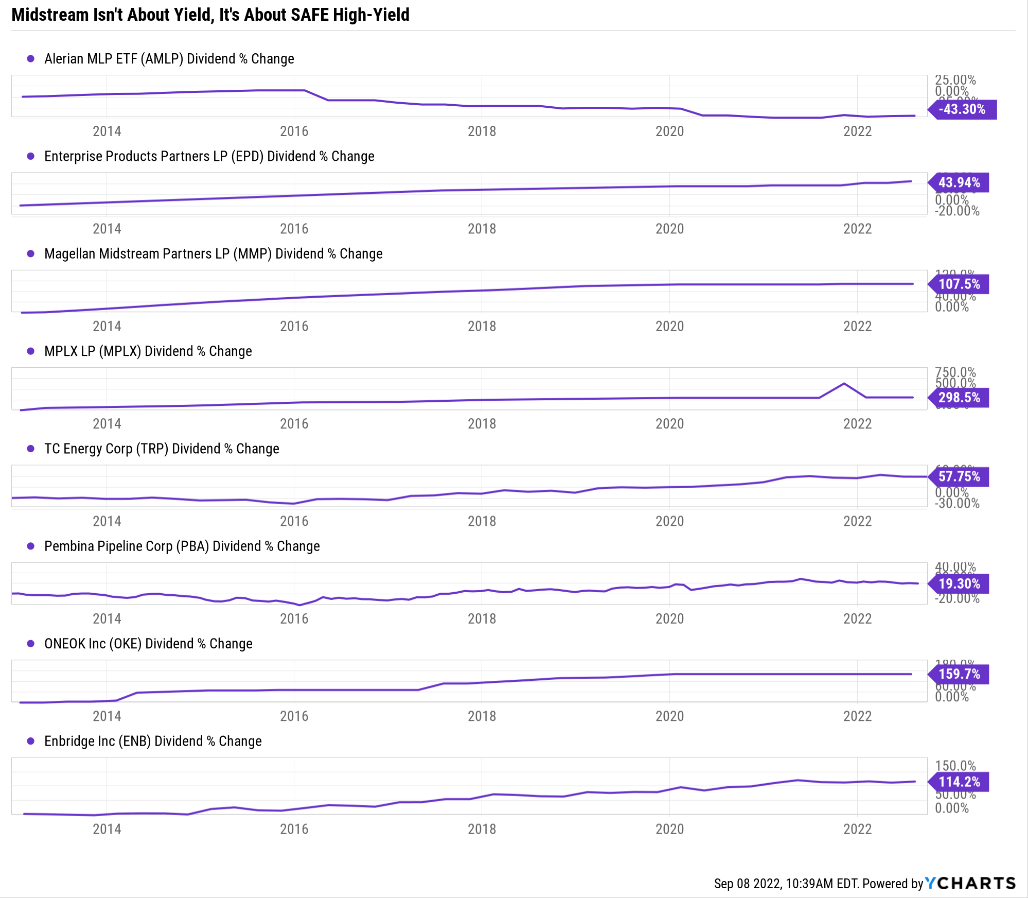
Don’t get me wrong, plenty of MLPs and midstreams cut during the crisis and have since found religion about strong balance sheets, self-funding business models, and safe payouts.
But the fact remains that the best blue-chip midstreams not only avoided cutting through the worst energy downturn in human history, but they also kept right on raising their payouts.
Reason Three Alerian Is A Value Trap: Unforgivably Terrible Returns
The future doesn’t repeat, but it often rhymes. – Mark Twain
In our case, ‘Past performance is no guarantee of future results.’
Still, studies show that over time, blue-chips with relatively stable fundamentals offer predictable returns based on yield, growth, and valuation mean reversion.
Bank of America
Over 7+ years, we can get a statistically significant view of whether or not a company, ETF, or investment strategy is working and likely to keep working in the future.
So how has AMLP performed for dividend-hungry investors? We have 12 years of historical data to work with, which can tell us with 90% statistical confidence whether or not this is a value trap or an attractive high-yield buy.
Total Returns Since September 2010: This Is What Value Traps Look Like
(Source: Portfolio Visualizer Premium)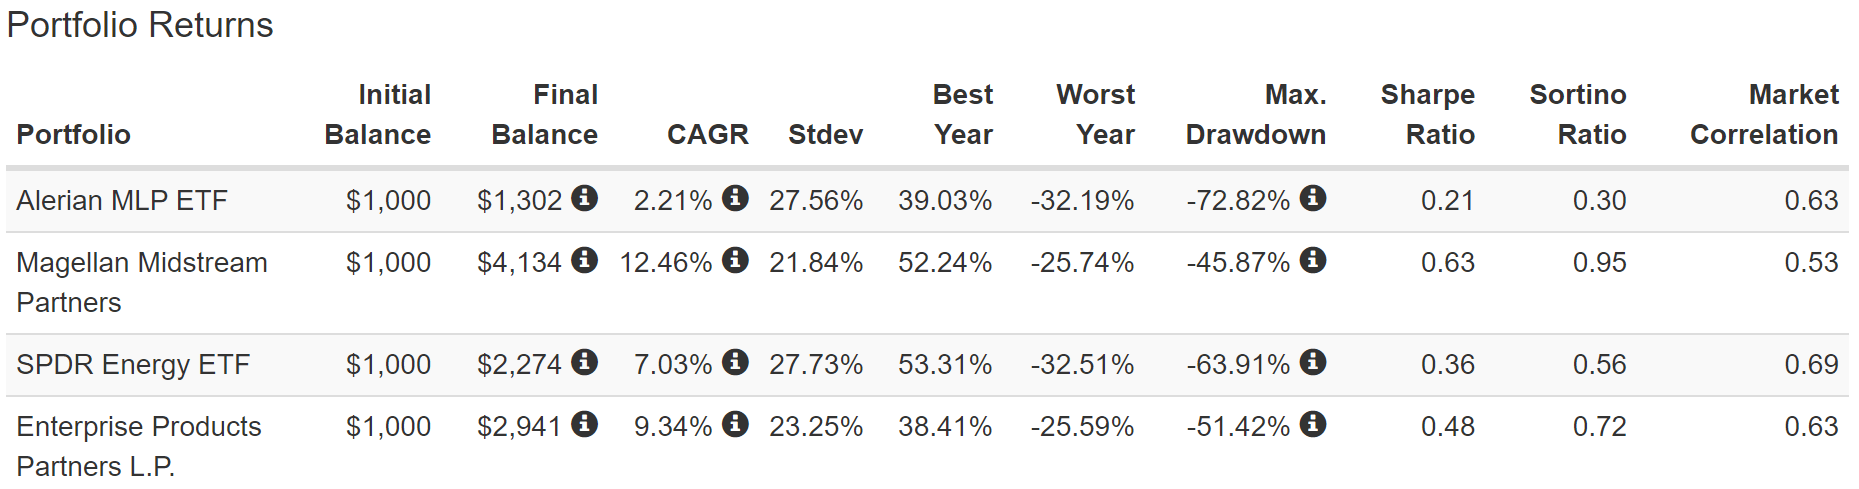
The lost decade for energy explains why XLE has delivered modest 7% annual returns, about half that of the S&P 500.
But then, how do you explain EPD and MMP delivering solid 9% to 12.5% annual returns?
And more importantly, what explains AMLP’s horrendous 2% annual return, with a 73% peak decline and 1/3rd the negative-volatility adjusted total returns of MMP (Sortino ratio)?
The answer is simple. AMLP is 70% low-quality sucker yield and value traps. And terrible returns are what you should expect from low-quality MLPs.
But wait, it gets worse.
Inflation-Adjusted Total Returns Since September 2010
| Stock | Ticker | Inflation-Adjusted Return Since September 2010 | Annual Real Return Since September 2010 |
X Better Returns Than AMLP |
| Alerian MLP ETF | AMLP | -4% | -0.3% | NA |
| SDPR Energy ETF | XLE | 68% | 4.4% | -17.00 |
|
Magellan Midstream Partners |
MMP | 205% | 9.7% | -51.25 |
| Enterprise Products Partners | EPD | 117% | 6.7% | -29.25 |
| S&P 500 | VOO | 249% | 11.0% | -62.25 |
(Source: Portfolio Visualizer Premium)
Energy sucked over the last 12 years, no doubt. XLE delivered just 4.4% annular returns, a paltry 68%, compared to the S&P 500’s 249% real return, or nearly 3X less on an annual basis.
But look at AMLP! -4% real returns over 12 years! Negative returns for over a decade, while world-class MLPs like EPD and MMP delivered far superior returns to most oil & gas stocks. Even with the lost decade for energy, EPD more than doubled, and MMP more than tripled.
But wait, it gets even worse! Total returns include dividend reinvestment, but a lot of midstream investors take their payouts in cash.
What were the returns for AMLP over the last 12 years if you chose to get paid in cash instead of terribly performing but high-yielding stock?
Inflation-Adjusted Total Returns Since September 2010 (No Dividend Reinvestment)
| Stock | Ticker | Inflation-Adjusted Return Since September 2010 | Annual Real Return Since September 2010 |
| Alerian MLP ETF | AMLP | -61% | -7.6% |
| SDPR Energy ETF | XLE | 13% | 1.0% |
| Magellan Midstream Partners | MMP | 53% | 3.6% |
| Enterprise Products Partners | EPD | 5% | 0.4% |
| S&P 500 | VOO | 180% | 9.0% |
(Source: Portfolio Visualizer Premium)
If a stock generates negative long-term real returns if you get paid in cash instead of stock, it’s a value trap sucker yield that should be avoided like the plague.
In other words, there are no excusing AMLP’s terrible returns. Energy delivered positive real returns, and the highest quality MLPs delivered very attractive returns while raising their payouts every year.
OK, so maybe AMLP is a value trap and sucker yield trash. But what if you just can’t stand K1 tax forms?
How To Find The Best Safe Midstream Blue-Chips, Without K1 Tax Forms, In 2 Minutes
I use the Dividend Kings Zen Research Terminal for every article I write because it’s a super simple and effective way to find the best blue-chips for any goal, time horizon, or risk profile.
The Zen Research Terminal runs off the DK 500 Master List, one of the world’s best watchlists, which includes:
- every dividend aristocrat (S&P companies with 25+ year dividend growth streaks)
- every dividend champion (every company, including foreign, with 25+ year dividend growth streaks)
- every dividend king (every company with 50+ year dividend growth streaks)
- every foreign aristocrat (every company with 20+ year dividend growth streaks)
- every Ultra SWAN (wide moat aristocrats, as close to perfect quality companies as exist)
- 40 of the world’s best growth stocks
Let me show you how incredibly easy it is to find the best safe midstream blue-chips without K1 tax forms far superior to AMLP.
| Step | Screening Criteria | Companies Remaining | % Of Master List |
| 1 | Reasonable Buy, Good Buy, Strong Buy, Very Strong Buy, Ultra Value Buy (Never Overpay For Stocks) | 324 | 64.29% |
| 2 | Safe Midstream List | 9 | 1.79% |
| 3 | None-K1 Tax Forms | 6 | 1.19% |
| 4 | Watchlist Creation Tool, Enter Those 6 Midstream c-Corps | 6 | 1.19% |
| Total Time | 2 Minutes |
(Source: DK Zen Research Terminal)
There are 13 safe midstreams I can recommend, and six of them are non-K1 tax form c-Corps, currently reasonable or attractive valuations.
6 Far Superior High-Yield Non-K1 Midstreams You Can Safely Buy Today
(Source: DK Zen Research Terminal)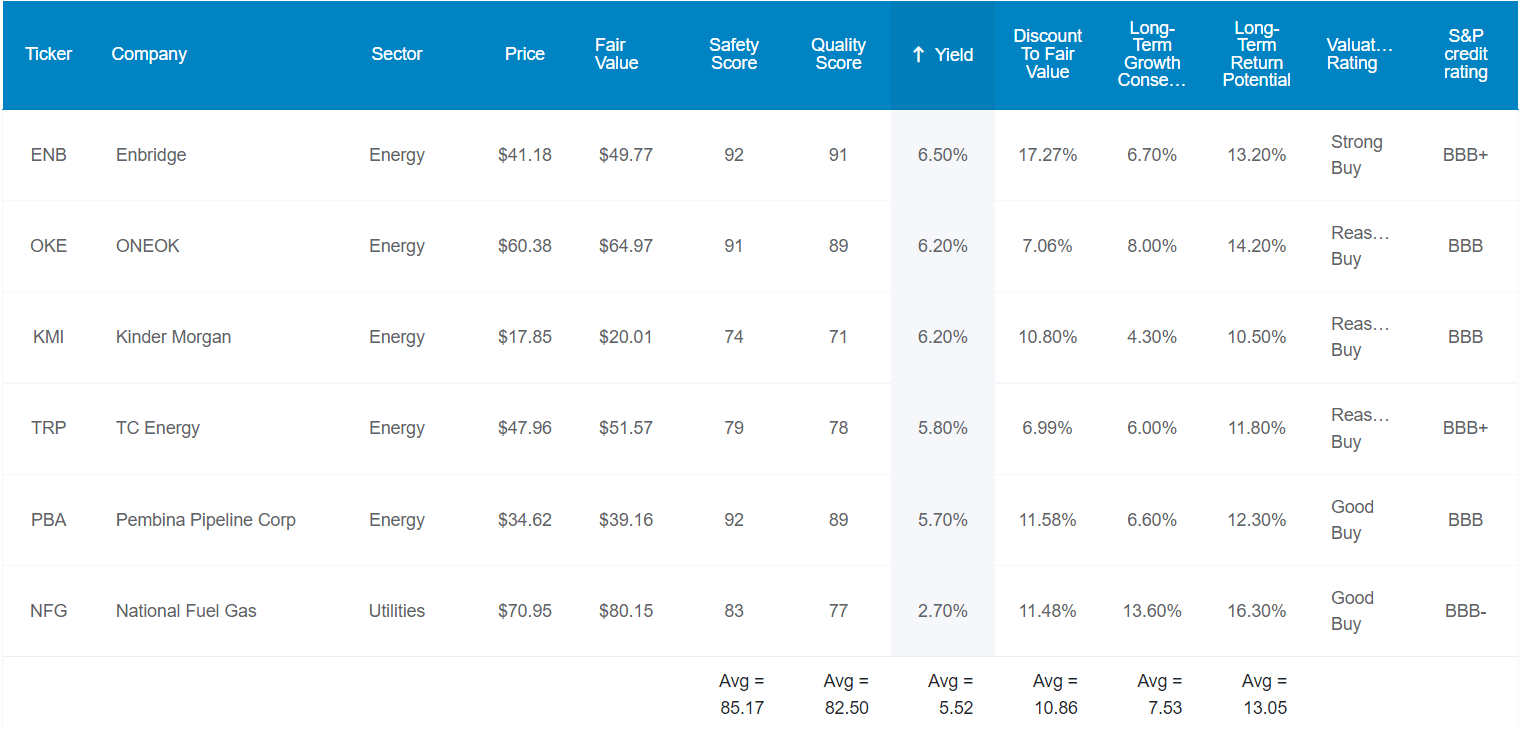
I’ve linked to articles exploring each company’s investment thesis, risk profile, growth prospects, valuation, and return potential.
- Enbridge (ENB) -global dividend aristocrat
- ONEOK (OKE)
- Kinder Morgan (KMI)
- TC Energy (TRP)
- Pembina Pipeline (PBA) – monthly dividend
- National Fuel Gas (NFG) – dividend king
Tax Implications
- ENB, TRP, and PBA are Canadian midstream corps
- they withhold 15% for taxes
- EXCEPT in tax-deferred accounts (IRAs, 401Ks, Roth IRAs)
- for taxable accounts, you can get a tax credit
- though it might involve a bit of paperwork
FAST Graphs Up Front
Enbridge 2024 Consensus Total Return Potential
(Source: FAST Graphs, FactSet)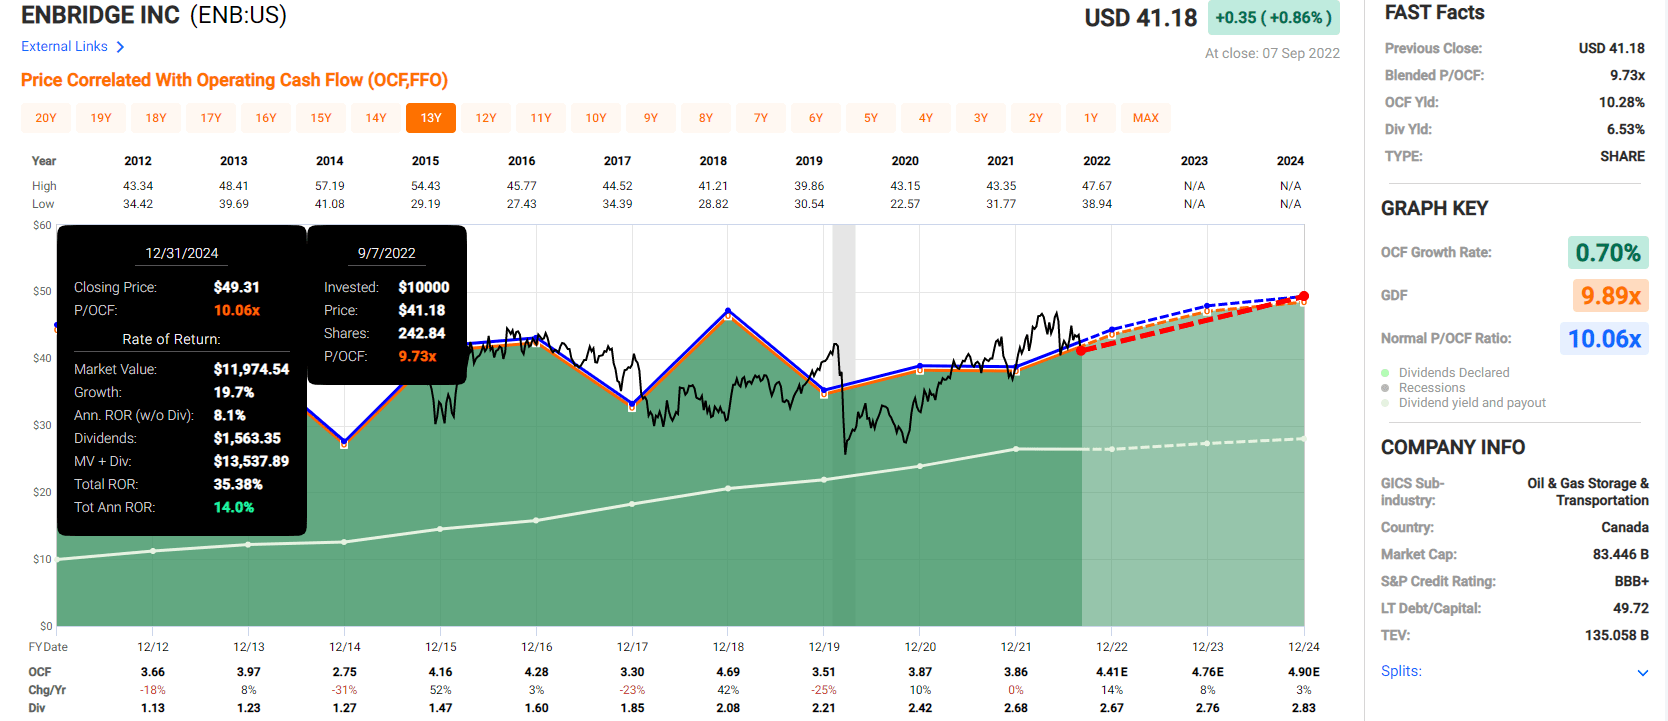
ONEOK 2024 Consensus Total Return Potential
(Source: FAST Graphs, FactSet)
Kinder Morgan 2024 Consensus Total Return Potential
(Source: FAST Graphs, FactSet)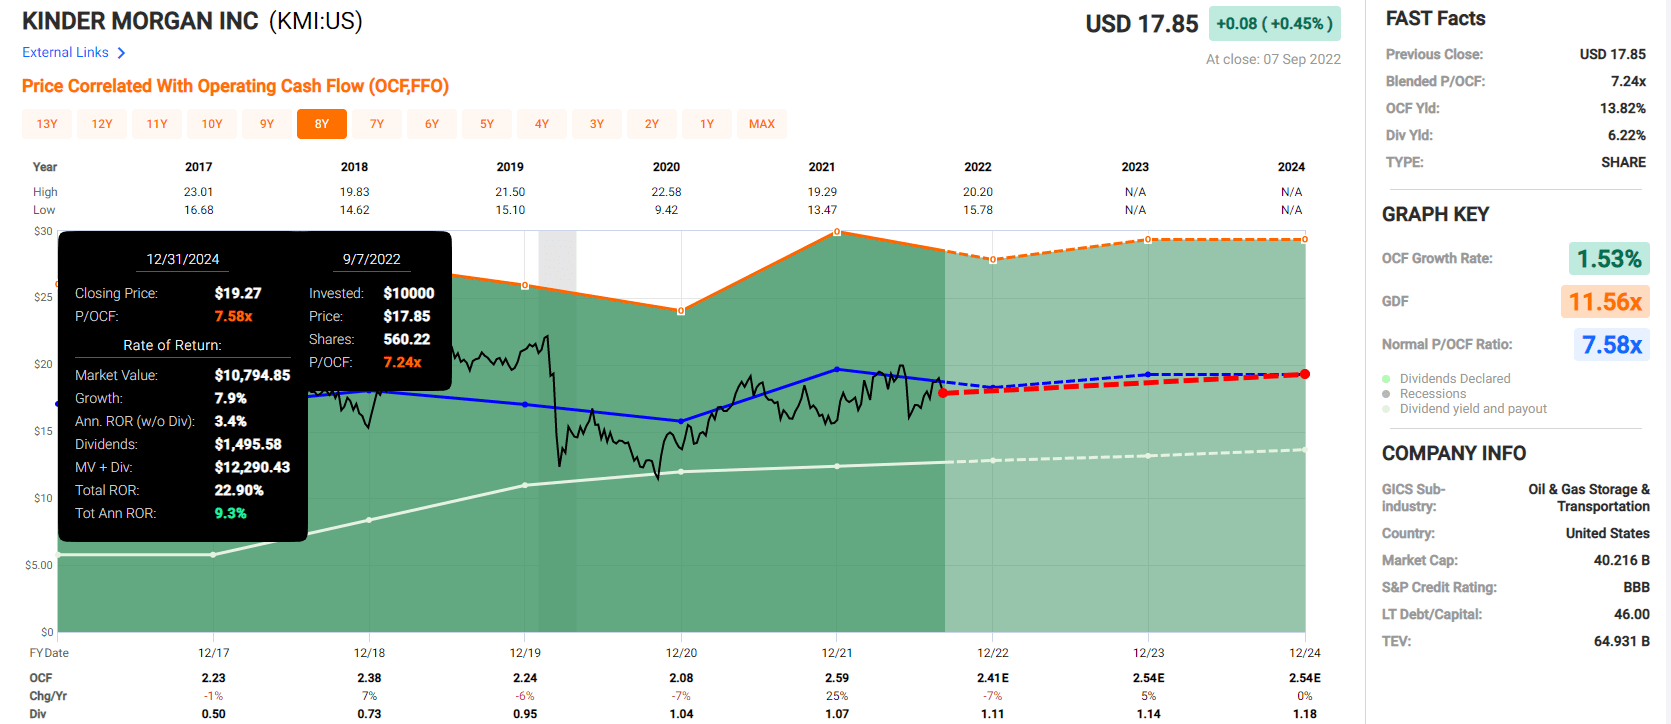
TC Energy 2024 Consensus Total Return Potential
(Source: FAST Graphs, FactSet)
Pembina Pipeline 2024 Consensus Total Return Potential
(Source: FAST Graphs, FactSet)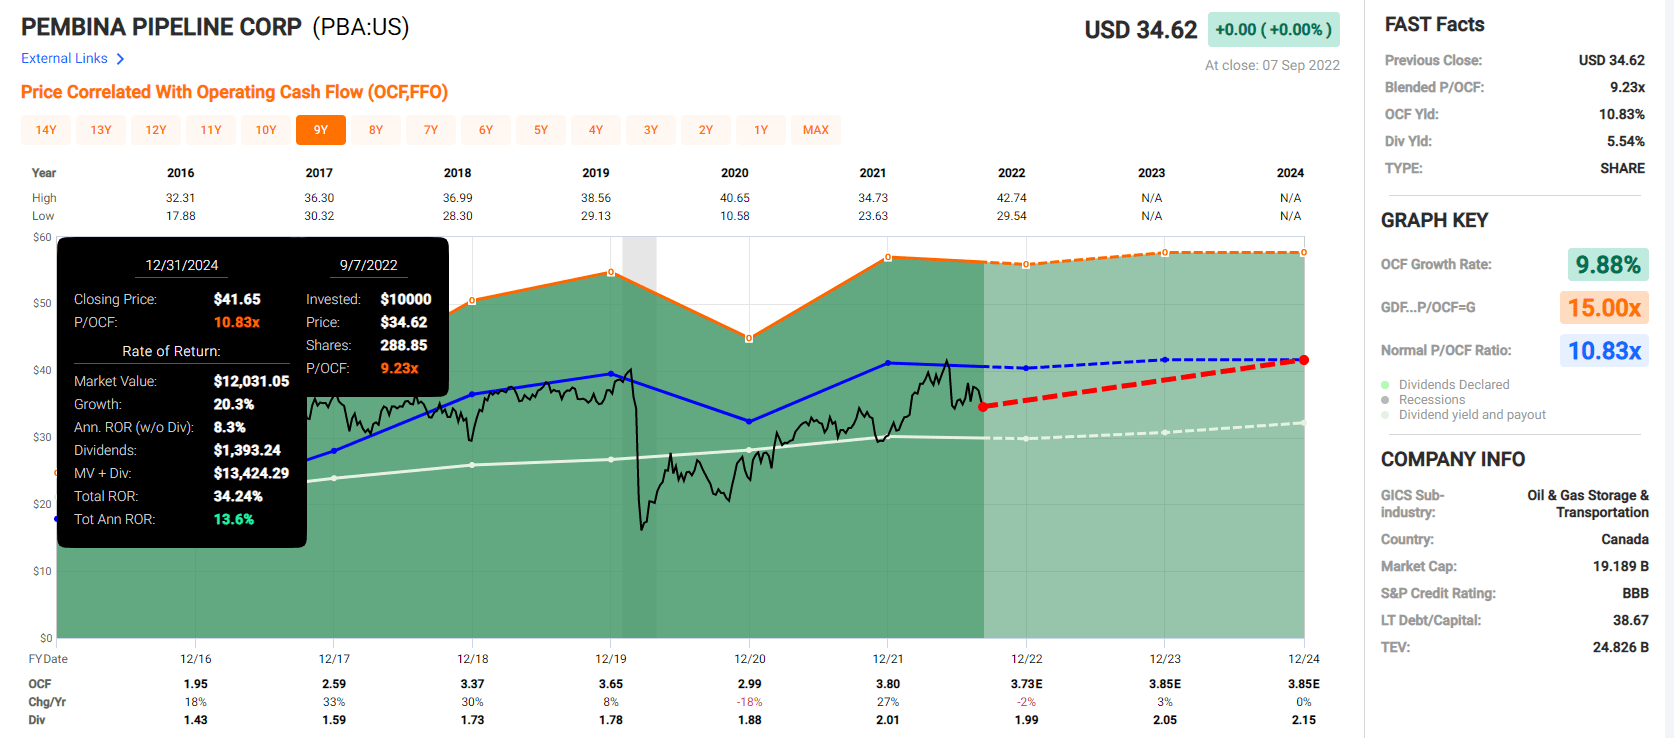
National Fuel Gas 2024 Consensus Total Return Potential
(Source: FAST Graphs, FactSet)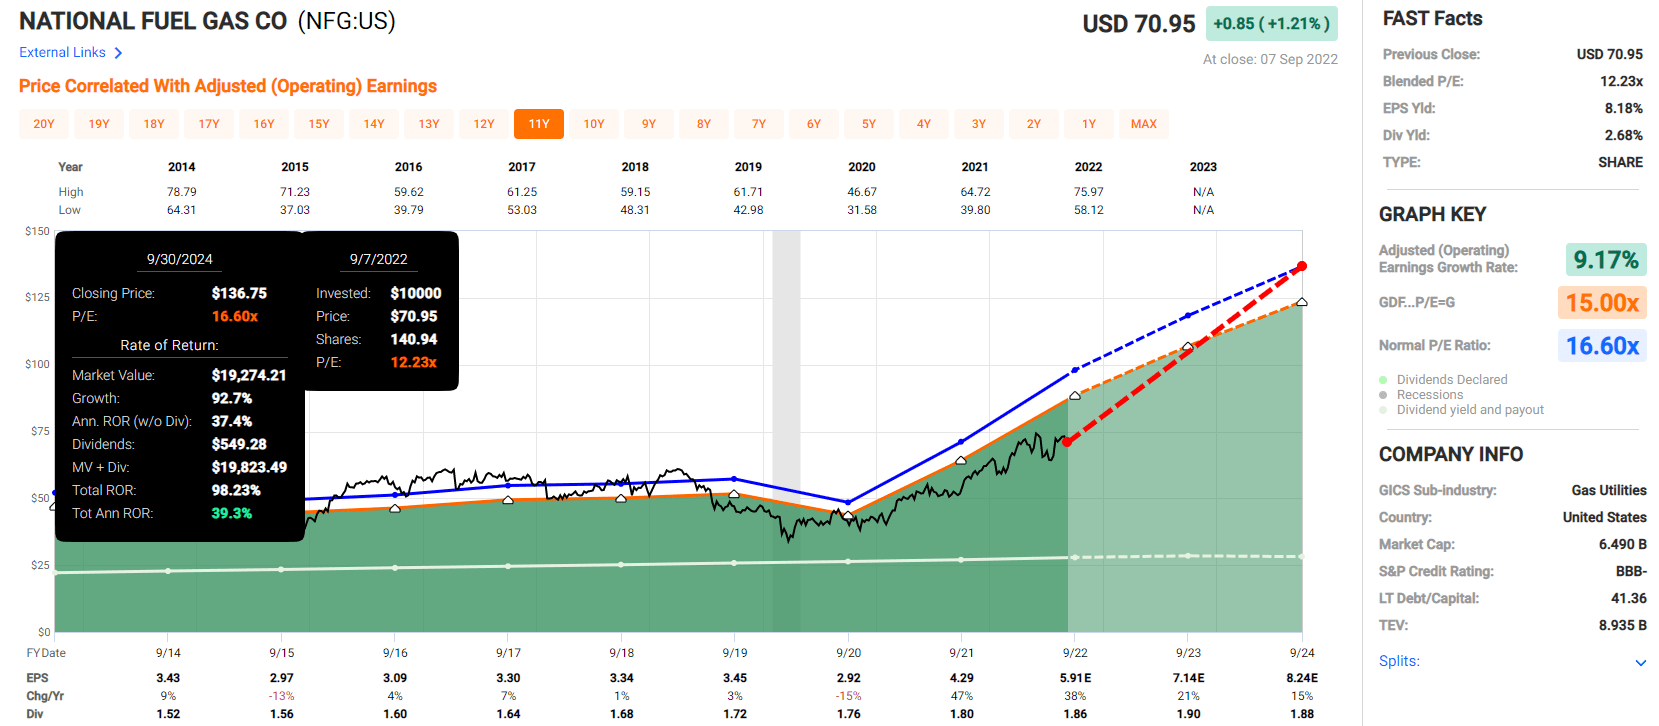
Now compare that to the S&P 500’s consensus return potential.
S&P 500 2024 Consensus Total Return Potential
(Source: FAST Graphs, FactSet)
Analysts expect 9.5% annual returns from the S&P over the next 2.5 years, a decent return.
But these six non-K1 midstreams could deliver 16% annular returns.
- equal to the S&P 500’s annual returns since 2009
- during one of the hottest bull markets in US history
But my goal isn’t to help you earn a 45% return over the next 2.5 years, but to achieve life-changing safe income and strong returns that can potentially help you retire rich and stay rich in retirement.
Why I Trust These Safe Non-K1 Midstreams, And So Can You
(Source: Dividend Kings Zen Research Terminal)
There are two ways I know that each of these non-K1 midstreams is better than AMLP. First, none of them cut their dividends in the Pandemic crash.
- validating KMI’s return to dividend grace after its successful turnaround since 2016
Second, their safety and quality is almost as good at the dividend aristocrats, the bluest of blue-chips.
This Is Quality You Can Trust
| Metric | 6 Non-K1 Safe Midstreams |
| Quality | 83% (Super SWAN) |
| Safety | 85% |
| Average Recession Dividend Cut Risk | 0.5% |
| Severe Recession Dividend Cut Risk | 1.8% |
| Dependability | 81% |
| Dividend Growth Streak (Years) | 17.5 |
| Long-Term Risk Management Industry Percentile |
64% Above-Average, Low Risk |
| Average Credit Rating | BBB Stable |
| Average Bankruptcy Risk | 7.25% |
| Forward P/Cash Flow | 9.3 |
| Discount To Fair Value | 11% |
| DK Rating | Good Buy |
| Yield | 5.5% |
| LT Growth Consensus | 7.6% |
| Total Return Potential | 13.1% |
| Risk-Adjusted Expected Return | 8.7% |
| Inflation & Risk-Adjusted Expected Return | 6.5% |
| Conservative Years To Double | 11.1 |
(Source: Dividend Kings Zen Research Terminal)
Ben Graham considered 20+ years without a dividend cut a sign of quality and a 20+ year dividend growth steak a sign of excellence.
These non-K-1 midstreams average a 17.5-year dividend growth streak, and ENB and NFG are dividend aristocrats and kings, respectively.
S&P estimates the average risk of bankruptcy in the next 30 years (including the energy transition) is 7.3%, a BBB stable credit rating.
The average risk of a dividend cut from these midstreams in a historically average recession since WWII is about 0.5%. Even in a Pandemic level recession, it’s about 1.8%.
Seven risk rating agencies estimate their long-term risk management to be in the 64th industry percentile, low-risk companies with above-average risk management.
These Midstream’s Long-Term Risk Management Is The 241st Best In The Master List (52nd Percentile)
| Classification | Average Consensus LT Risk-Management Industry Percentile |
Risk-Management Rating |
| S&P Global (SPGI) #1 Risk Management In The Master List | 94 | Exceptional |
| Strong ESG Stocks | 78 |
Good – Bordering On Very Good |
| Foreign Dividend Stocks | 75 | Good |
| Ultra SWANs | 71 | Good |
| Low Volatility Stocks | 68 | Above-Average |
| Dividend Aristocrats | 67 | Above-Average |
| 6 Non-K1 Midstreams | 64 | Above-Average |
| Dividend Kings | 63 | Above-Average |
| Master List average | 62 | Above-Average |
| Hyper-Growth stocks | 61 | Above-Average |
| Monthly Dividend Stocks | 60 | Above-Average |
| Dividend Champions | 57 | Average bordering on above-average |
(Source: DK Research Terminal)
Their risk-management consensus is in the top 48% of the world’s highest quality companies and similar to that of such other blue-chips as
- Emerson Electric (EMR): Ultra SWAN dividend king
- Illinois Tool Works (ITW): Ultra SWAN dividend king
- Coca-Cola (KO): Ultra SWAN dividend king
- Medtronic (MDT): Ultra SWAN dividend aristocrat
- Nike (NKE): Ultra SWAN
The bottom line is that all companies have risks, and these midstreams are above-average, at managing theirs.
How We Monitor These Midstreams’ Risk Profile
- 111 analysts
- 4 credit rating agencies
- 7 total risk rating agencies
- 118 experts who collectively know this business better than anyone other than management
- and the bond market for real-time fundamental risk updates
When the facts change, I change my mind. What do you do, sir?” – John Maynard Keynes
There are no sacred cows at iREIT or Dividend Kings. Wherever the fundamentals lead, we always follow. That’s the essence of disciplined financial science, the math behind retiring rich and staying rich in retirement.
So now that you see why these are much better and more dependable alternatives to AMLP, let’s see why you might want to buy some of them today.
Wonderful Companies At Attractive Prices
(Source: Dividend Kings Zen Research Terminal)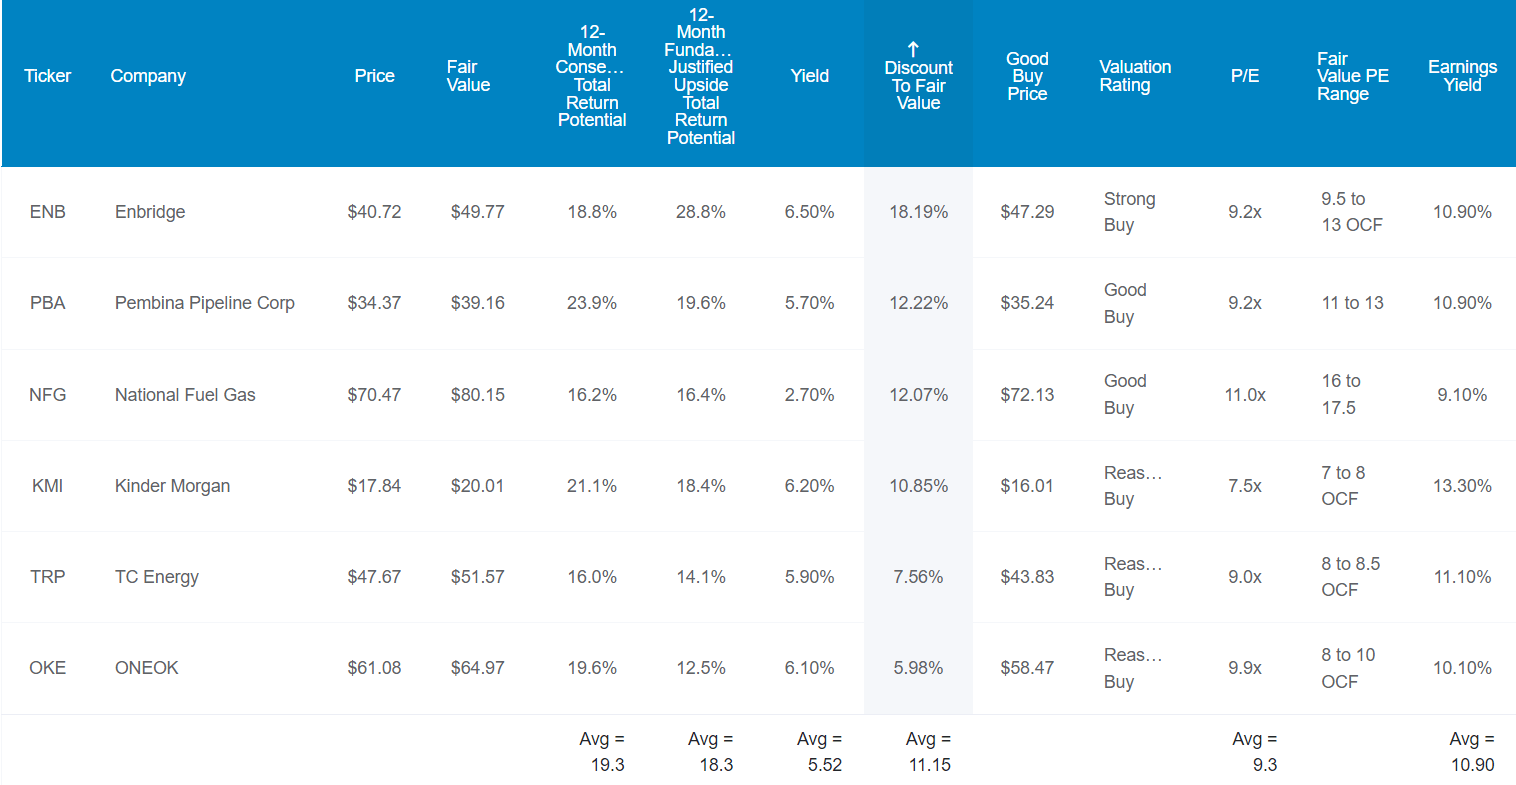
For context, the S&P is trading at 17X earnings and 13X cash flow. These midstreams are trading at just 9.3X cash flow, an 11% historical discount.
According to the Graham/Dodd fair value formula, they are priced for just 1.6% long-term growth, a fraction of their actual growth rates.
Analysts expect 19% total returns in the next 12 months, and that’s 100% justified by their fundamentals.
- if they all grow as expected over the next year and return to market-determined historical fair value investors will earn 18% total returns
But my goal isn’t to help you score a quick 18% in a year, or even 45% through 2024. My goal is to help you achieve life-changing income and potentially 40X returns over the coming decades.
How These Non-K1 Midstreams Could Help You Retire In Safety And Splendor
(Source: Dividend Kings Zen Research Terminal)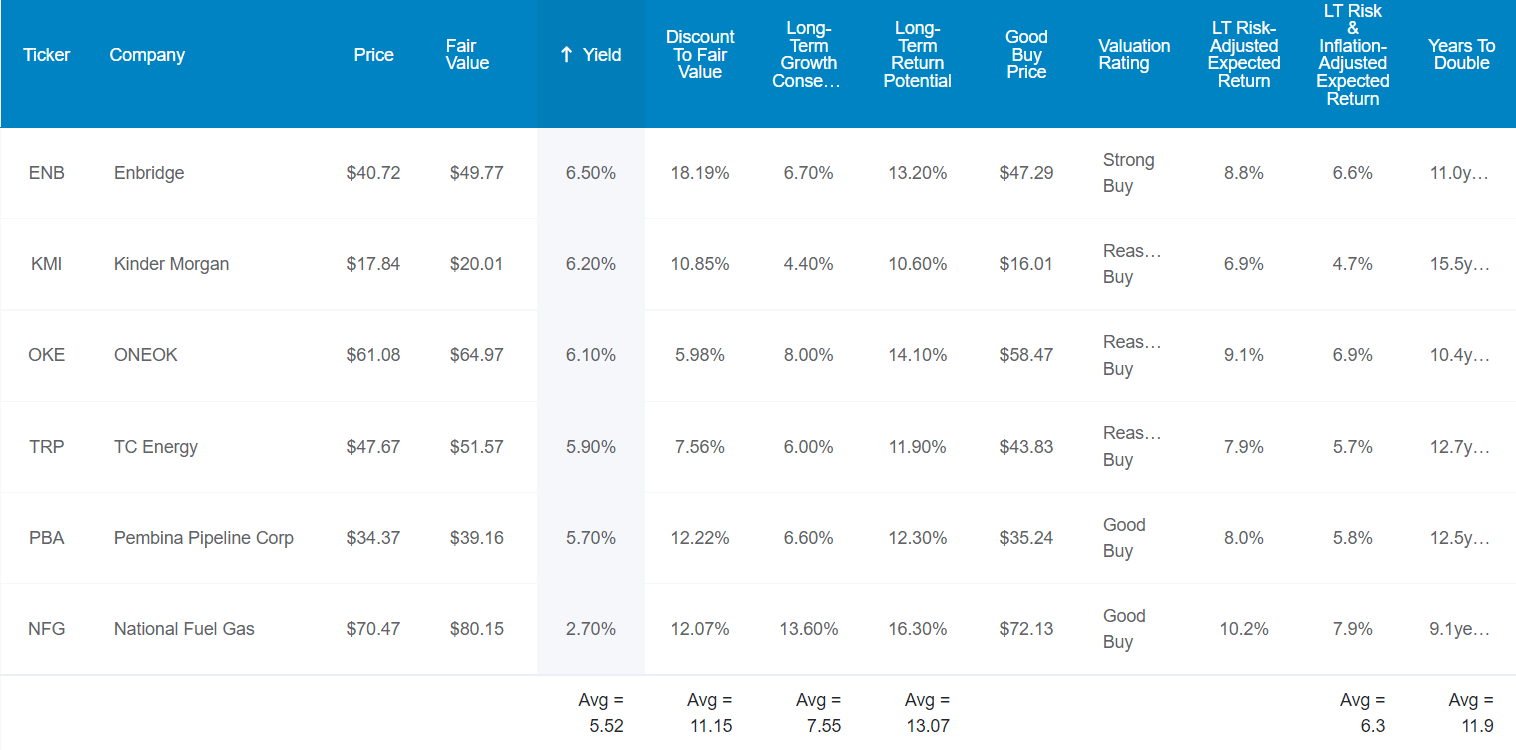
Not only do these non-K1 midstreams offer a very safe 5.5% yield, but they are growing at almost 8% per year.
- utilities are growing at 6.3% CAGR
- and yield just 2.6%
- half the safe yield of these midstreams and 2% slower growth
Analysts think they can deliver 13.1% CAGR long-term returns. How impressive is that?
| Investment Strategy | Yield | LT Consensus Growth | LT Consensus Total Return Potential | Long-Term Risk-Adjusted Expected Return | Long-Term Inflation And Risk-Adjusted Expected Returns | Years To Double Your Inflation & Risk-Adjusted Wealth |
10-Year Inflation And Risk-Adjusted Expected Return |
| 6 Non-K1 Midstreams | 5.5% | 7.6% | 13.1% | 9.1% | 6.9% | 10.4 | 1.95 |
| Dividend Aristocrats | 2.4% | 8.6% | 11.0% | 7.7% | 5.5% | 13.2 | 1.70 |
| S&P 500 | 1.7% | 8.5% | 10.2% | 7.1% | 4.9% | 14.6 | 1.62 |
| Nasdaq | 0.9% | 11.8% | 12.7% | 8.9% | 6.7% | 10.8 | 1.91 |
(Source: Dividend Kings Zen Research Terminal, Morningstar, Ycharts, FactSet)
That’s more than the S&P 500, dividend aristocrats, and even the Nasdaq.
Inflation-Adjusted Total Return Potential: $1,000 Initial Investment
| Time Frame (Years) | 8.0% CAGR Inflation-Adjusted S&P 500 Consensus | 8.8% Inflation-Adjusted Dividend Aristocrats Consensus | 10.9% CAGR Inflation-Adjusted 6 Non-K1 Midstreams Consensus | Difference Between Inflation-Adjusted 6 Non-K1 Midstreams Consensus And S&P Consensus |
| 5 | $1,467.97 | $1,523.16 | $1,675.97 | $208.00 |
| 10 | $2,154.93 | $2,320.01 | $2,808.87 | $653.94 |
| 15 | $3,163.37 | $3,533.75 | $4,707.59 | $1,544.22 |
| 20 | $4,643.72 | $5,382.46 | $7,889.77 | $3,246.05 |
| 25 | $6,816.84 | $8,198.35 | $13,223.01 | $6,406.17 |
| 30 (retirement time frame) | $10,006.90 | $12,487.39 | $22,161.37 | $12,154.46 |
| 35 | $14,689.81 | $19,020.28 | $37,141.77 | $22,451.96 |
| 40 | $21,564.18 | $28,970.91 | $62,248.47 | $40,684.29 |
| 45 | $31,655.53 | $44,127.31 | $104,326.53 | $72,671.01 |
| 50 | $46,469.30 | $67,212.91 | $174,848.08 | $128,378.78 |
| 55 | $68,215.45 | $102,375.96 | $293,040.03 | $224,824.58 |
| 60 (investing lifetime) | $100,138.11 | $155,934.88 | $491,126.12 | $390,988.01 |
| 100 (institutional time frame) | $2,159,396.10 | $4,517,575.80 | $30,571,850.47 | $28,412,454.37 |
(Source: Dividend Kings Zen Research Terminal, FactSet)
Analysts think these non-K1 midstreams could deliver 22X inflation-adjusted returns over the next 30 years and over an investing life-time, could be a potential 491X bagger.
What about the energy transition? Won’t the end of the age of oil mean these midstreams can’t grow?
- each has a plan for transitioning to green energy
- carbon sequestration
- hydrogen
- biofuels
Rating agencies consider them above-average at managing their energy transition risk and the bond market is very confident in their plans. How do we know?
- ENB’s longest bonds don’t mature until 2112
- the bond market is confident that ENB will still be around in 90 years
- literally, the most risk-averse investors on earth are betting millions that ENB will outlive us all
| Time Frame (Years) | Ratio Dividend Aristocrats/S&P Consensus | Ratio Inflation And ARE Consensus vs. S&P consensus |
| 5 | 1.04 | 1.14 |
| 10 | 1.08 | 1.30 |
| 15 | 1.12 | 1.49 |
| 20 | 1.16 | 1.70 |
| 25 | 1.20 | 1.94 |
| 30 | 1.25 | 2.21 |
| 35 | 1.29 | 2.53 |
| 40 | 1.34 | 2.89 |
| 45 | 1.39 | 3.30 |
| 50 | 1.45 | 3.76 |
| 55 | 1.50 | 4.30 |
| 60 | 1.56 | 4.90 |
| 100 | 2.09 | 14.16 |
(Source: Dividend Kings Zen Research Terminal, FactSet)
On the bond market’s time frame of nearly a century, these safe midstreams might deliver 14X the inflation-adjusted returns of the S&P 500 and 7X more than the dividend aristocrats.
On the bond market’s time frame, if you leave your portfolio to your grandkids or charity, these non-K1 midstreams might deliver 31,000X inflation-adjusted returns.
This sounds absolutely amazing, but what evidence is there that these non-K1 safe midstreams can deliver anything close to 13% returns over the long-term?
Historical Returns Since April 1990 (Equally Weighted, Annual Rebalancing)
(Source: Portfolio Visualizer)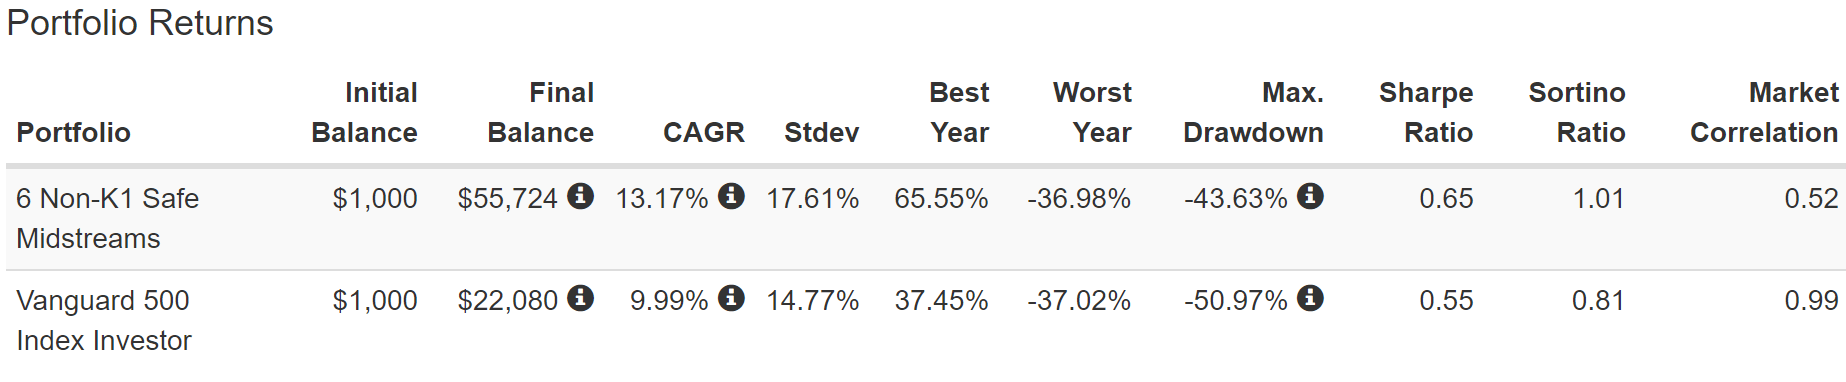
How plausible is it that these midstreams can grow at 13% annually for decades? That they can outperform the broader market and even the Nasdaq? Well, they’ve done it for the last 32 years.
(Source: Portfolio Visualizer)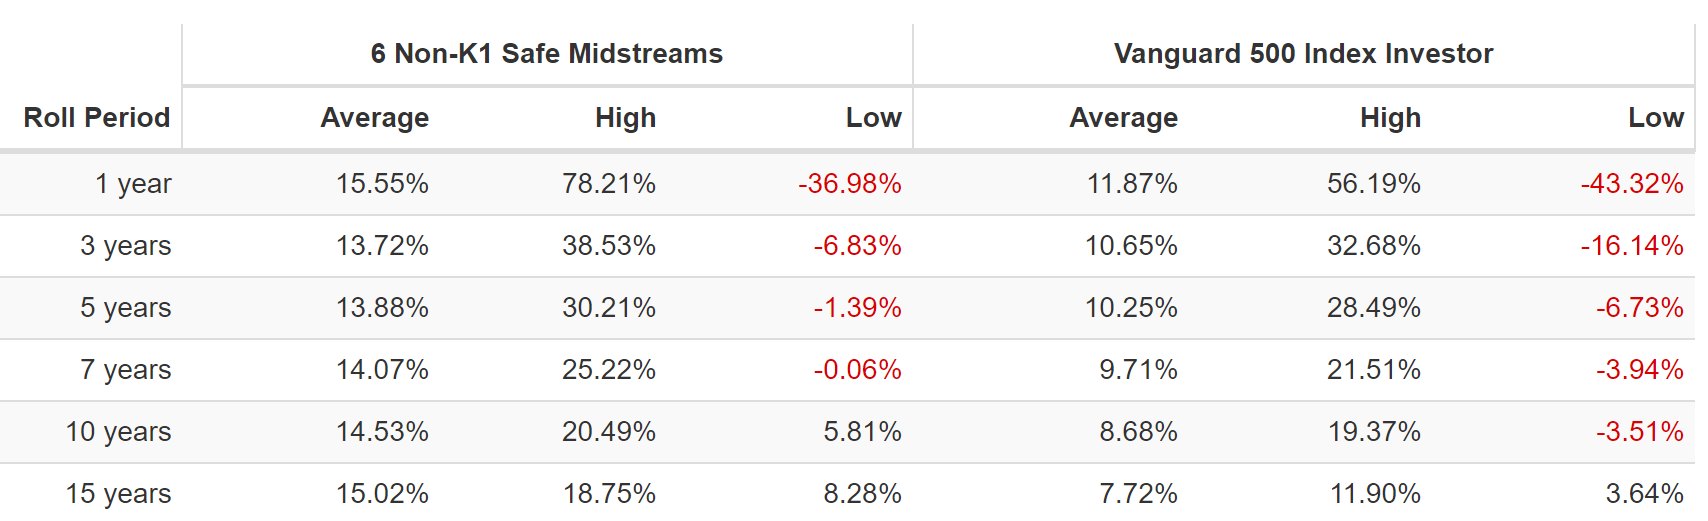
And the last 23 years.
Historical Returns Since April 1999 (Equally Weighted, Annual Rebalancing)
(Source: Portfolio Visualizer) (Source: Portfolio Visualizer)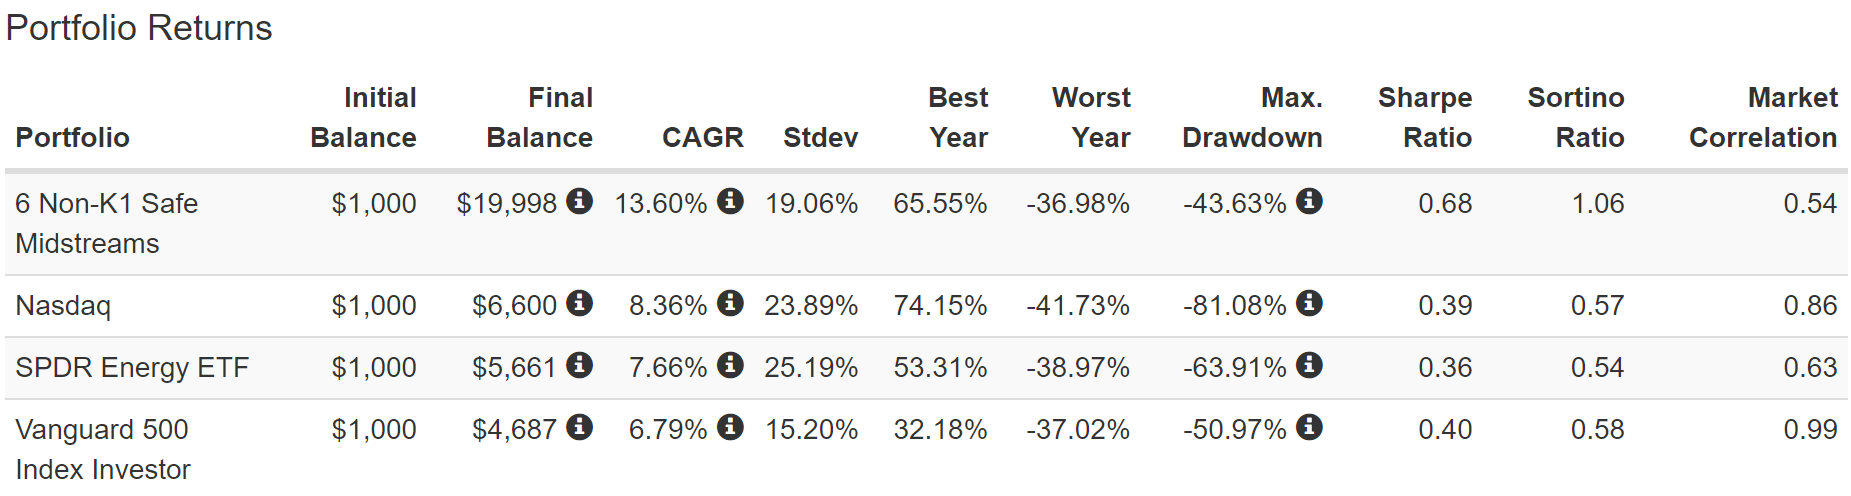

Higher returns than the Nasdaq and with less volatility to boot. In fact, their peak decline during the Great Recession was 44%, less than the S&P 500’s 50%< the Nasdaq’s 50%, and XLE’s 64% crash.
And what about compared to AMLP? What about the lost decade for energy? What about the ESG crowd gunning for pipelines?
Historical Returns Since September 2010 (Lost Decade For Energy)
(Source: Portfolio Visualizer) (Source: Portfolio Visualizer)

They still delivered close to 13% annual returns in the worst decade for energy in human history.
In fact, their average 12-month return was almost 12%, 4X that of AMLP and 2X that of XLE.
- 3X better negative-volatility-adjusted returns than AMLP
And when we take a look at their inflation-adjusted returns compared to AMLP?
Inflation-Adjusted Returns Since September 2010
| Stock | Ticker | Inflation-Adjusted Return Since September 2010 | Annual Real Return Since September 2010 |
| Alerian MLP ETF | AMLP | -4% | -0.3% |
| SDPR Energy ETF | XLE | 68% | 4.4% |
| 6 Non-K1 Safe Midstreams | ENB, OKE, KMI, TRP, PBA, NFG | 167% | 8.5% |
| S&P 500 | VOO | 249% | 11.0% |
(Source: Portfolio Visualizer Premium)
How’s that for quality beating yield traps? What about my personal gold standard test for sucker yield traps?
Total Returns Since September 2010 (Worst Decade For Energy In Human History)
(Source: Portfolio Visualizer Premium)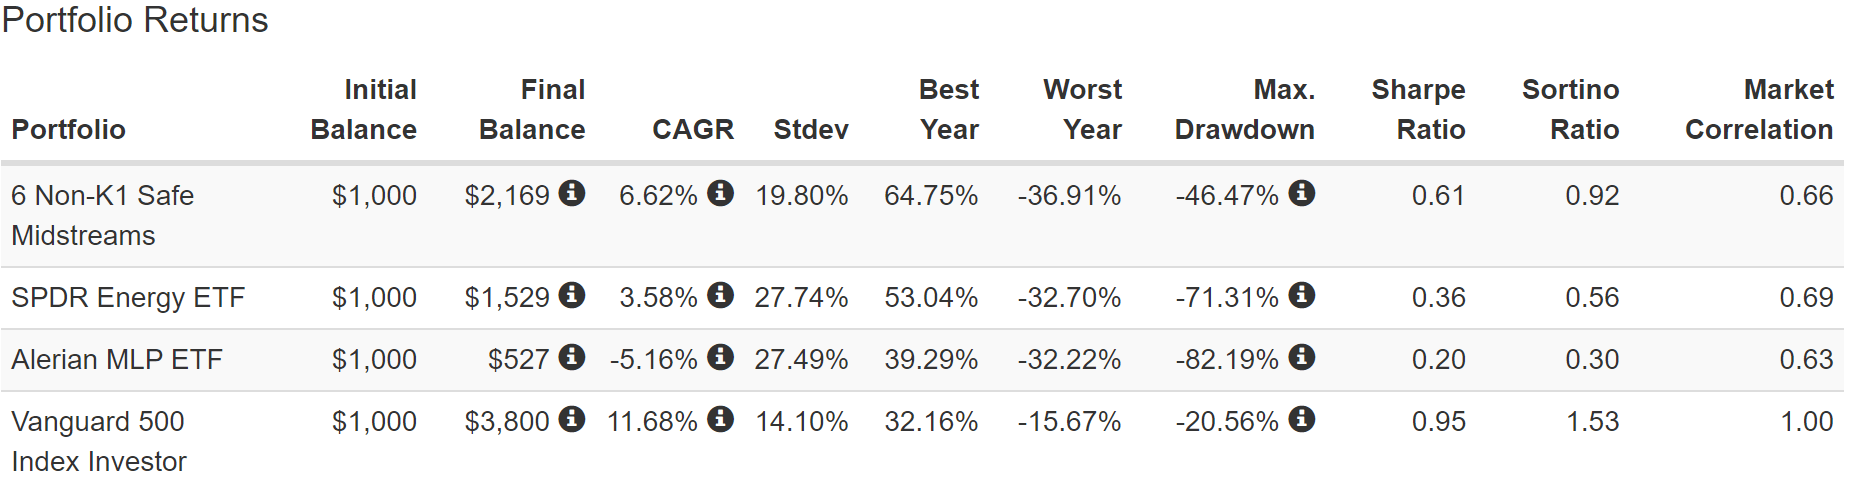
Anyone taking their dividends in cash would have still earned health 6.7% annual returns, 2X that of the energy sector and 12% more annual returns than AMLP.
What about adjusting for inflation?
Total Returns Since September 2010 (No Dividend Reinvestment): Sucker Yield Trap Test
| Stock | Ticker | Inflation-Adjusted Return Since April 1999 | Annual Real Return Since April 1999 |
| Alerian MLP ETF | AMLP | -61% | -7.6% |
| SDPR Energy ETF | XLE | 16% | 1.2% |
| 6 Non-K1 Safe Midstreams | ENB, OKE, KMI, TRP, PBA, NFG | 60% | 4.0% |
| S&P 500 | VOO | 180% | 9.0% |
(Source: Portfolio Visualizer Premium)
Was energy a value trap in the last decade? Not really. Investors collected healthy dividends and still earned positive returns.
What about these non-K1 midstreams? They generated massive income and still delivered 4% inflation-adjusted returns on your original investment.
AMLP? You lost 61% of your investment in exchange for income that fell 41% over the last 12 years.
- AMLP is undeniably a sucker yield trap
OK, but what about that income over time? Sure AMLP has been cutting steadily, and its real returns have been negative for a dozen years. But maybe it was still worth it if it generated a big enough income stream?
Income Since September 2010 (No Dividend Reinvestment) $1,000 Initial Investment
(Source: Portfolio Visualizer Premium)
AMLP’s income stream has been falling steadily since 2016. Every year, in fact.
- midstream as an industry stopped cutting back in 2017
- but not AMLP’s 70% yield trap holdings
Cumulative Dividend Since 2011: $1,000 Initial Investment (No Dividend Reinvestment)
| Metric | S&P 500 | Alerian MLP ETF | SPDR Energy ETF |
6 Non-K1 Safe Midstreams |
| Total Dividends | $515 | $709 | $495 | $938 |
| Total Inflation-Adjusted Dividends | $381.48 | $525.19 | $366.67 | $694.81 |
| Annualized Income Growth Rate | 8.0% | -1.3% | 10.0% | 11.7% |
| Total Income/Initial Investment | 0.52 | 0.71 | 0.50 | 0.94 |
| Inflation-Adjusted Income/Initial Investment | 0.38 | 0.53 | 0.37 | 0.69 |
| More Inflation-Adjusted Income Than S&P 500 | NA | 1.38 | 0.96 | 1.82 |
| Starting Yield | 2.4% | 6.7% | 2.1% | 4.4% |
| Today’s Annual Dividend Return On Your Starting Investment (Yield On Cost) | 5.6% | 5.8% | 6.0% | 14.8% |
| Today’s Inflation-Adjusted Annual Dividend Return On Your Starting Investment (Inflation-Adjusted Yield On Cost) | 4.1% | 4.3% | 4.4% | 11.0% |
(Source: Portfolio Visualizer Premium)
AMLP’s income growth has been negative, while XLE’s has been a robust 10% annually. But these non-K1 midstreams delivered 12% annual dividend growth, through the worst decade for energy in human history.
If you invested $1,000 into these safe midstreams 12 years ago and taken all your dividends in cash, you’ve collected almost $700 in inflation-adjusted dividends.
You’re earned back 70% of your investment in inflation-adjusted cash, and today are earning an inflation-adjusted yield on cost of 11%.
- within three years your entire investment will be repaid in inflation-adjusted dividends
- and your fundamental risk of losing money drops to zero
Now compare that to AMLP, which has cost investors 61% of their initial investment in exchange for higher volatility, falling income, and -4% real returns over 12 years.
Bottom Line: AMLP Is A Sucker Yield Value Trap, But These 6 Non-K1 Safe Midstreams Can Help Your Retire Rich And Stay Rich In Retirement
Every midstream article I write has someone in the comments saying that AMLP is a better choice because it doesn’t have a K1.
Well, neither do ENB, OKE, KMI, TRP, PBA, or NFG.
Math and quality don’t lie. AMLP is 70% value traps and sucker yield stocks and no long-term investor whose owned it for the last 12 years has been glad they did.
- -4% inflation-adjusted return, including dividend reinvestment
- -61% inflation-adjusted return if taking dividends in cash instead of terrible performing stock
It was the worst decade for energy in human history. That’s not midstream’s fault; that’s not AMLP’s fault.
But selecting the highest-yielding sucker yield trap crap was most definitely the fault of AMLP’s managers.
But it was also the fault of investors who kept buying this ETF, despite objectively terrible returns and steadily falling income.
When midstream is growing its dividends but AMLP is cutting theirs every single year since 2017? That’s a sign to get out before you lose even more of your hard-earned savings.
Could things get better for AMLP investors in the future? Sure, they MIGHT. But hope isn’t an investment strategy and just take a look at what these 6 non-K1 safe midstreams offer.
- 5.5% very safe yield
- average credit rating: BBB stable (7.25% 30-year bankruptcy risk)
- 7.6% CAGR long-term growth consensus
- 13.1% CAGR long-term return potential (which they have delivered for the last 32 years, 23 years, and 12 years)
In fact, these 6 non-K1 safe midstreams have paid back investors 70% of their initial investments, adjusted for inflation, and without dividend reinvestment.
And yet they STILL grew their dividends 11% annually, through the worst decade in energy market history.
This is the power of safe high-yield over sucker-yield traps.
This is the power of focusing on safety and quality first, and prudent valuation and sound risk management always.
This is why you should avoid AMLP like the plague and buy non-K1 blue-chip midstreams if you hate K1s with a passion.
And if you don’t want to deal with Canadian tax withholdings? Then own them in retirement accounts where there are no withholdings.
Want to avoid withholding taxes in a taxable account? Then buy KMI and OKE over AMLP.
In the world of investing, there are few worst evils for retirees than sucker yield trap crap, and that’s what AMLP is.
But there are few things more wonderful than safe high-yield you can count on in even the most extreme industry and economic conditions.
And that’s why you should avoid AMLP, a dangerous yield trap, and buy these six high-yield non-K1 safe midstream blue-chips instead.
Be the first to comment