

Darren415
This article was first released to Systematic Income subscribers and free trials on Nov. 26.
Welcome to another installment of our BDC Market Weekly Review, where we discuss market activity in the Business Development Company (“BDC”) sector from both the bottom-up – highlighting individual news and events – as well as the top-down – providing an overview of the broader market.
We also try to add some historical context as well as relevant themes that look to be driving the market or that investors ought to be mindful of. This update covers the period through the fourth week of November.
Be sure to check out our other Weeklies – covering the Closed-End Fund (“CEF”) as well as the preferreds/baby bond markets for perspectives across the broader income space. Also, have a look at our primer of the BDC sector, with a focus on how it compares to credit CEFs.
Market Action
BDCs had a strong week, gaining 2%. Through November, the sector rallied around 7%, recovering nearly all the ground lost over the September drawdown.
The BDC sector stands only a couple of percent below its starting point this year in total return terms – a great result for investors.
Systematic Income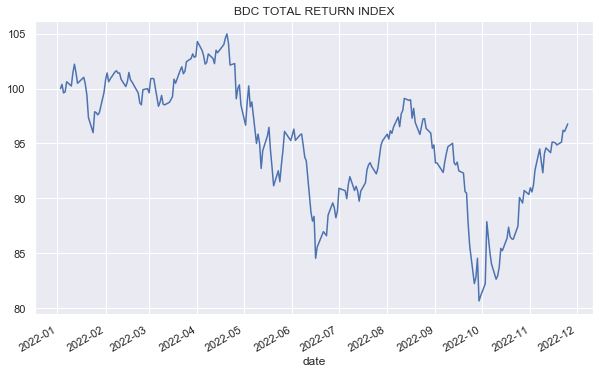
October and November are likely to deliver two strong positive months in a row, something we haven’t seen since early 2021.
Systematic Income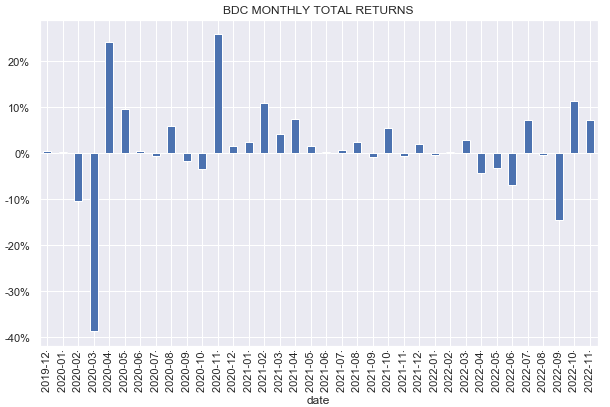
BDC valuations climbed back from their second dip this year and stand only a couple of percent below their longer-term average. Peak-to-trough the two large dips this year were close to 20% – offering terrific opportunities for investors to acquire BDCs at a significant margin of safety. To reflect a less attractive valuation backdrop we continue to move some of our BDC holdings from Buy to Hold.
Systematic Income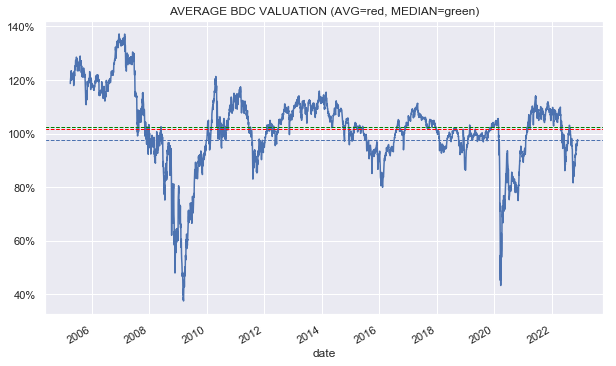
Market Themes
One of the key risk metrics for BDC investors is the level of interest coverage or IC in the overall portfolio. This is particularly important in a period of rising short-term rates which puts significant pressure on borrowers of floating-rate loans.
Guggenheim recently put together a useful snapshot of what this looks like in the bank loan space. Assuming flat EBITDA, we see that IC is expected to fall to 2.8x when short-term rates rise to 5%. With 3M Libor at 4.76%, we are not a million miles away from this number.
Guggenheim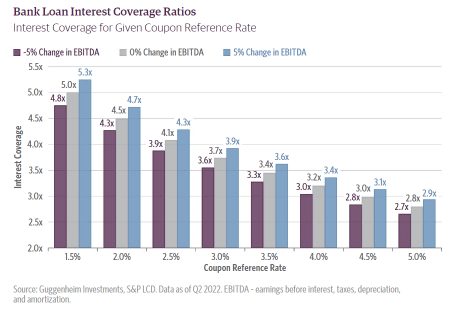
The key risk for investors is that rates: 1) rise well above 5%, 2) stay there for a considerable point of time, and 3) earnings continue to fall, all putting further pressure on IC and driving a deterioration in borrower credit quality and an increase in non-accruals.
For investors tracking IC in the BDC sector, there are three things to watch out for when comparing interest coverage. First, some companies report on a last-twelve-month or LTM basis while some report on a quarterly basis. IC on an LTM basis will be above the quarterly figure for the simple reason that rates have been rising over the last year.
Secondly, a weighted-average figure, which is the only metric most BDCs report, does not capture the distribution of IC in the portfolio. Specifically, it’s important to know where the left tail of the IC distribution is, i.e., what percentage of the portfolio will have IC, say, below 1x. Companies with a similar weighted-average figure may have very different allocations to sub-1x IC holdings.
Third, IC is a ratio of EBITDA to interest expense. BDCs with those companies that are able to continue to grow their earnings are in a better position, all else equal.
To get a sense of where IC is across the BDC sector, below are some of the figures that have been mentioned in presentations or transcripts.
- BXSL estimated quarterly IC of 2.2x with 2% of the portfolio below 1x on a quarterly basis. At the expected peak policy rate the company estimates IC will fall to 1.8x with 10% of the portfolio below 1x.
- NMFC estimated IC to be above 2x today on an LTM basis. At the policy rate of 5% (i.e. near the expected peak) IC is expected to fall to 1.5x. See the snapshot from the presentation below.
- GSBD IC fell to 1.8x from 2.1x in the previous quarter on a quarterly basis. On an LTM basis the figure was 2.4x.
- BBDC IC was 3.1x – the basis is not mentioned but is likely to be LTM.
NMFC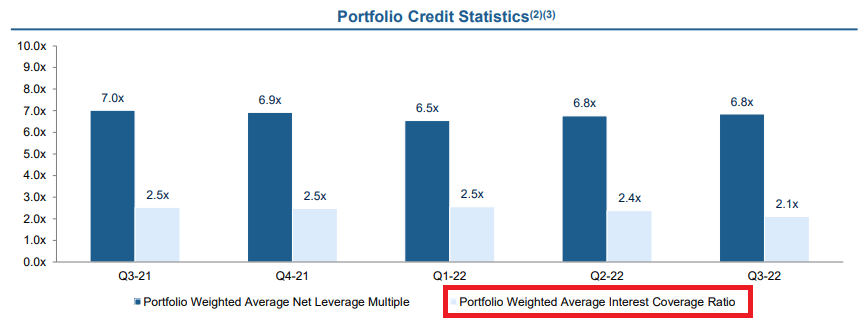
Falling IC and the knock-on impact on the solvency of BDC holdings remains a key risk for investors. That said, NAVs have been pushed lower mostly via unrealized depreciation in anticipation for this worsening in credit metrics. In addition, yields on existing and new investments have risen while BDC valuations remain below their historic average. All these factors provide a margin of safety for investors in the sector that can help to soak up an expected drop in credit quality. In other words, a deterioration in credit metrics is something for investors to pay close attention to but is not a reason to avoid the sector entirely.
Market Commentary
Golub Capital BDC (GBDC) reported results. NAV fell 1.7%, which is slightly worse than the median. Adjusted net income rose 6% and the company hiked the dividend by 10% to match its net income. A big driver of the rise in net income was a jump in yields on its holdings – a direct result of rising short-term rates. The hike brings the dividend back to its pre-COVID level.
Systematic Income BDC Tool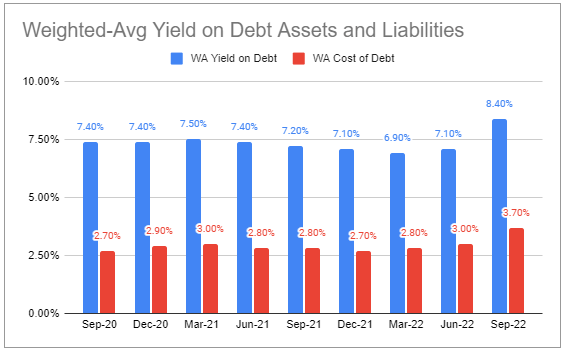
Total NAV return for each of the past 3 quarters this year has been positive. Non-accruals remained low and there was another quarter of net realized gains. GBDC maintains a pretty robust high-quality portfolio should hold up relatively well if the macro situation continues to deteriorate.
Stance and Takeaways
GBDC caught a bid in the last week on the back of good results as its valuation has now nearly converged with the rest of the sector.
Systematic Income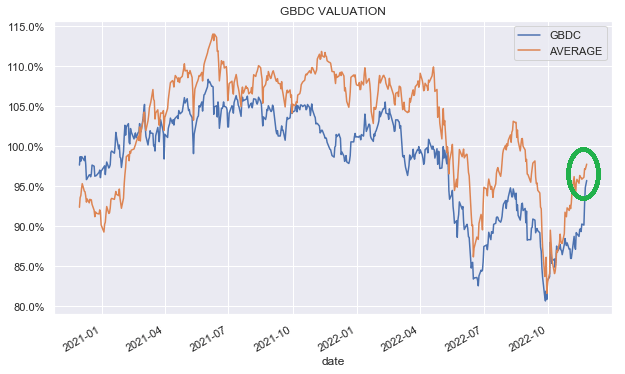
Over the past year the stock has moved out to a double-digit discount relative to the sector a number of times (highlighted in green) – a level at which it offers a very strong value proposition.
Systematic Income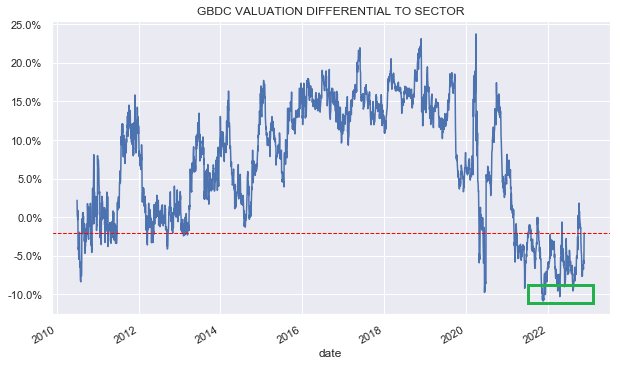
To reflect this recent outperformance in Golub Capital BDC, we now move GBDC stock to Hold from Buy in our Core Income and High Income Portfolios.
Be the first to comment