shapecharge/iStock via Getty Images
This article was first released to Systematic Income subscribers and free trials on Apr. 9
Welcome to another installment of our BDC Market Weekly Review where we discuss market activity in the Business Development Company sector from both the bottom-up – highlighting individual news and events – as well as the top-down – providing an overview of the broader market.
We also try to add some historical context as well as relevant themes that look to be driving the market or that investors ought to be mindful of. This update covers the period through the first full of April.
Be sure to check out our other Weeklies – covering the CEF as well as the preferreds/baby bond markets for perspectives across the broader income space. Also, have a look at our primer of the BDC sector with a focus on how it compares to credit CEFs.
Market Action
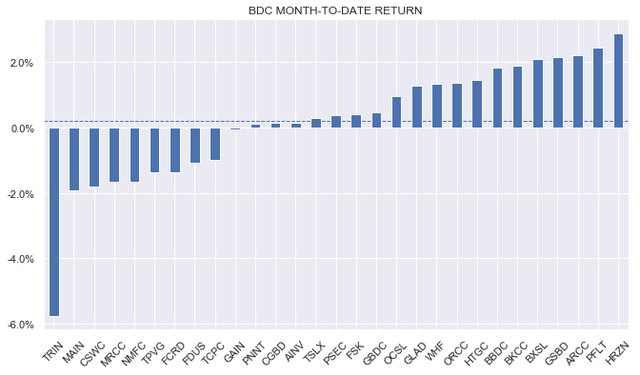
The BDC sector was down about 1% on the week, although this was a fairly modest drop relative to the overall weakness in the income space. Month-to-date, the sector is up a touch.
The underperformer so far this month has been Trinity Capital (TRIN) which had a public offering of stock well below its traded price.
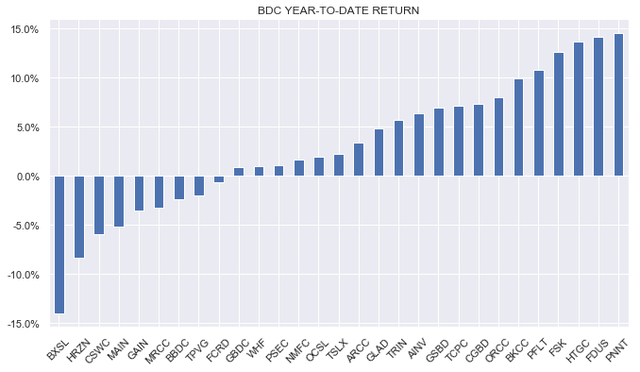
On a year-to-date basis, underperformers remain the group of usual suspects of high-valuation names like Capital Southwest (CSWC) and Main Street (MAIN), those under lock-up expiration such as Blackstone Secured Lending (BXSL) and another name with a recent public offering Horizon Technology Finance (HRZN).
Market Themes
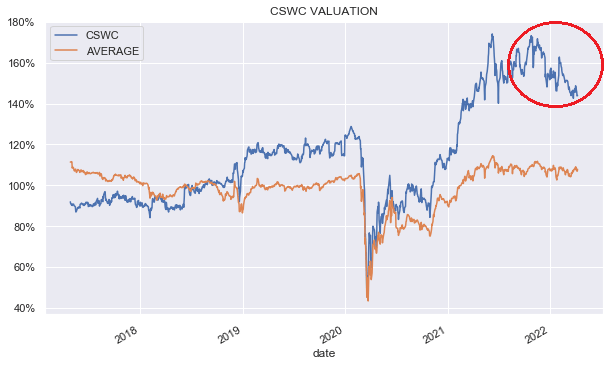
A subscriber asked why we don’t have Capital Southwest in our portfolios since its valuation has fallen over the last few months by around 30% to 144% as of this writing.
Systematic Income BDC Tool
This raises an important question of – what should be the basis of ratings that investors often hear from the income commentariat such as “Buy” or “Strong Buy”?
There are different types of investors for whom these ratings have different meanings. Splitting them into two broad groups – for tactical investors a Buy rating very likely means price performance in the near term, i.e. buy this at 144% because it’s going to 154% in a few weeks.
For strategic / buy-and-hold investors, it probably means that something is a buy because at a given valuation it is very likely to deliver superior longer-term returns relative to other available options in a given sector.
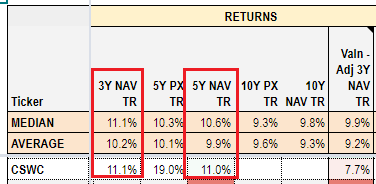
If we focus on the latter formulation which is probably more of interest to those reading this – CSWC has delivered total NAV returns that are more-or-less in line with the median of the BDC sector over the last 3-5 years (exactly equal to the median over the last 3 years and 0.4% above the median over the last 5 years).
Systematic Income BDC Tool
So far so good. CSWC has performed either in line with the median BDC over the last 3 years and a touch stronger than the median BDC over the last 5 years in generating total book value returns (i.e. including dividends). This argues for its inclusion in investor portfolios.
However, we also know that investors don’t have access to total NAV returns because BDCs don’t trade at their NAVs. For instance, holding a BDC at a valuation of 110% means you pay an additional 10% “tax” on the stock’s total NAV returns. The key point here is that if you pay an above-average tax for fairly average historic performance, the return on your capital is below average. In short what matters for performance on investor capital is not just total NAV returns but also the valuation of that return stream.
A good question to ask is if the entire sector delivers the same exact return over the next 3 years as it did over the past 3 years in total NAV terms (the absolute numbers aren’t relevant for this example – what matters is the relative returns of CSWC to the rest of the sector), how will the CSWC return on investor capital compare to the rest of the sector. To answer this question we calculate what we call the Valuation-adjusted 3Y total NAV return which is simply the historical 3Y total NAV return divided by the company’s valuation (i.e. the price / NAV ratio).
If we look at the table above, we see this metric in the rightmost column. In short, if CSWC performs in line with its 3-year trend, a position in the company’s stock at its current valuation of 144% will underperform the sector by 1.7% per annum, all because of the drag of its valuation.
What this suggests to us is that investors who are happy to hold the company at its high 144% valuation are betting that the company’s forward total NAV returns will be significantly above the sector. In other words, investors holding the company’s stock implicitly believe that, while CSWC delivered historic total NAV returns roughly in line with the sector median (a bit above the sector average), the company’s performance relative to the sector will be significantly stronger over the next few years than it has been over the last few. If that doesn’t happen, it does raise the question of whether CSWC is simply mispriced.
Market Commentary
TRIN did a $50m offering at $18.15 or about 4% below the previous closing price. It closed the day at $17.83. With the accretion to the NAV, the stock was trading at a valuation that was right in line with the market average of about 108% (keep in mind that its recent exits have knocked a few percentage points off the NAV – see our recent article).
At that level we highlighted on the service that the stock was quite attractive, particularly for investors more comfortable with the higher equity allocation of the company (about double the sector average at 16%). It has recently rallied and now trades at a 111% valuation.
Some investors hate public offerings and sometimes grumble about dilution but that’s a misunderstanding (at least in this case). Specifically, there are two definitions of dilution. One definition of dilution is that after the offering everyone owns a smaller percentage of the company than they did before (unless you also bought at the offering in the right proportion). This dilution should not bother any retail investor because retail investors aren’t going to try to get control of the board, so if you own 0.002% of the company before the offering and now own 0.0019% of the company then who cares.
The second definition of dilution that investors should possibly worry about is when the company issues stock below the NAV – this is referred to as being dilutive to the NAV because the company sells $1 of company assets at a price below $1 which – in effect, giving away some of its assets for free. This is bad but it rarely happens. BDCs have to get special permission from shareholders to be able to do this and even though many have, it’s typically not acted on.
TRIN issued stock at a price well above the NAV so, all else equal, the company’s NAV increased slightly which is a good thing for current shareholders. The offering is, arguably, also a good thing for new shareholders because they can buy the stock at a price below where it traded the previous day – TRIN closed 6% below the pre-offering price.
Elsewhere, BDC Ares Capital (ARCC) upsized its credit facility by half a billion or about 11%. Interestingly, they also switched to using term SOFR from Libor. Term SOFR is the version of SOFR for a period longer than a day. Libor-based credit facilities are typically 3-month so to turn the published daily SOFR rate into a 3-month Libor-equivalent requires extending SOFR over a given term like 3-month (i.e. making it a term SOFR) as well as applying a credit adjustment (mentioned in the ARCC press release) given Libor is an unsecured rate and SOFR is a secured rate. What’s interesting is that there has not been a lot of communication about switching the loans in BDC portfolios from Libor to SOFR. This should start happening pretty soon now that the transition was addressed in the omnibus bill (see recent Preferreds weekly)
Stance and Takeaways
With analysts trying to out-hawk themselves with regard to the end point of the Fed policy rate, 4% is the new 3% it seems. In other words, some analysts are now penciling in a 4% Fed Funds rate for 2023. Such a large and fast move is likely to be a windfall for BDC income levels, most of which hold primarily floating-rate portfolios.
However, at the same time we should be clear that such a sharp move in short-term rates will increase the debt servicing cost of companies in BDC portfolios by 20-40%. BDC companies are also less likely to have fixed-rate debt (by virtue of not having access to the unsecured debt market) so their interest rate coverage is likely to be stressed to a larger extent. This suggests that non-accruals may increase, particularly if the macro expansion rolls over.
For this reason we think higher-quality portfolio BDCs such as Oaktree Specialty Lending (OCSL) and Golub Capital BDC (GBDC) are worth an allocation in the current environment. Both are attractive, in our view, at below 100% valuations.


Be the first to comment