

Darren415
This article was first released to Systematic Income subscribers and free trials on Sep. 10.
Welcome to another installment of our BDC Market Weekly Review, where we discuss market activity in the Business Development Company (“BDC”) sector from both the bottom-up – highlighting individual news and events – as well as the top-down – providing an overview of the broader market.
We also try to add some historical context as well as relevant themes that look to be driving the market or that investors ought to be mindful of. This update covers the period through the first full week of August.
Be sure to check out our other Weeklies – covering the Closed-End Fund (“CEF”) as well as the preferreds/baby bond markets for perspectives across the broader income space. Also, have a look at our primer of the BDC sector, with a focus on how it compares to credit CEFs.
Market Action
It was a terrific week for the BDC space with a nearly 2% return. The sector is now flat over September after a bad start. BXSL is in the lead with a 5% gain in September due to the dividend hike as we discuss below.
The sector stands about 8% below its level a year ago – roughly equivalent to a year’s worth of dividends.
Systematic Income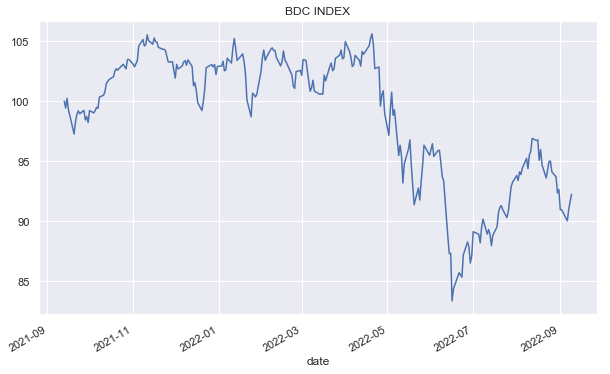
The average BDC valuation of 98% stands a few percentage points below its historic level. Given the current macro environment, a level above 100% would push the sector into expensive territory in our view.
Systematic Income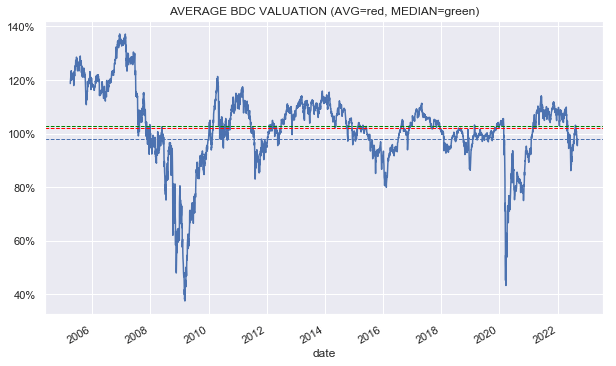
Market Themes
There are many ways to break down the BDC sector – by allocation (equity/credit), by capital structure focus (first-lien / non-first-lien), by focus (traditional / venture-backed) etc. Each of these provides a different perspective on the sector.
Another way we like to think of the sector is in terms of three groups:
- Value Traps – BDCs that trade at low valuations but have terrible historic NAV returns so that their low valuations are not low enough
- High Flyers – BDCs with strong historic performance that trade at very high valuations so that their high valuations are typically too high relative to their sector outperformance
- Undervalued Performers – BDCs with average or above average historic performance whose valuation is well below their level of historical performance, i.e. they look too cheap relative to their strong performance.
If we take a look at how BDCs have performed this year, we can see a very distinct pattern. This pattern is not perfect but it’s good enough to shed light on how BDCs behave in periods of stress. The chart below shows the total return of each BDC in our coverage this year (y-axis) versus their valuation at the end of the year (x-axis). For example, the top performer FDUS (top left quadrant) traded at a valuation of around 90% at the end of last year and has delivered a 17% total return so far this year.
Systematic Income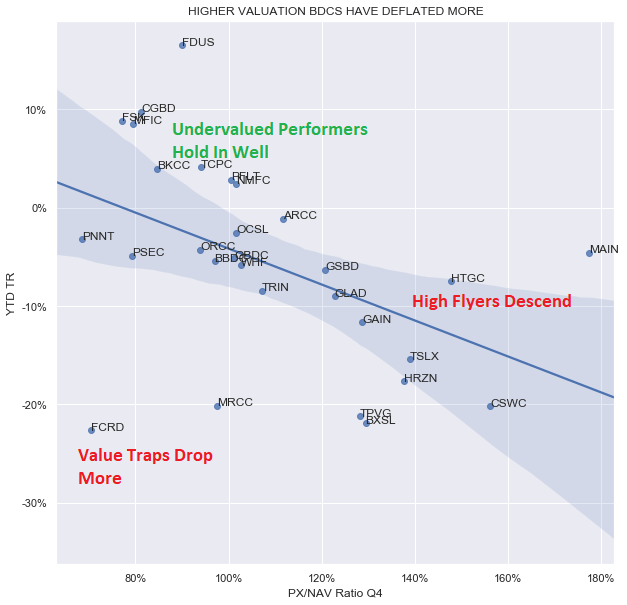
What we tend to see is that some of the worst performers have been value traps such as FCRD and MRCC. These companies tend to struggle in a difficult market environment due to their lower-quality portfolios and poor underwriting track record. What we also see is that the High Flyers – strong historical performers that trade at excessive valuations for their returns – have deflated quite a bit. This is a common pattern that we see in other assets such as CEFs which makes it difficult for investors to maintain conviction in these companies. Finally, what we see is that Undervalued Performers have performed relatively well this year. This includes most of our holdings since the start of the year such as FDUS, CGBD, OCSL, PNNT, NMFC, and TCPC. The last two positions were rotated a few months ago into other BDCs to take advantage of their resilience.
The key takeaway here is that in tough market environments (and we would argue over longer market cycles as well) BDCs that stand the best chance of delivering strong results are those good performers which are also undervalued.
Market Commentary
The Blackstone Secured Lending Fund (BXSL) raised its base dividend by 13% causing the stock to rise over 5% on the week. Our Q2 update highlighted the company was very likely to raise the dividend. Net investment income has been running at a rate of $0.62-0.66 versus a base dividend of $0.53 which we can see in the blue and red bars below.
Systematic Income BDC Tool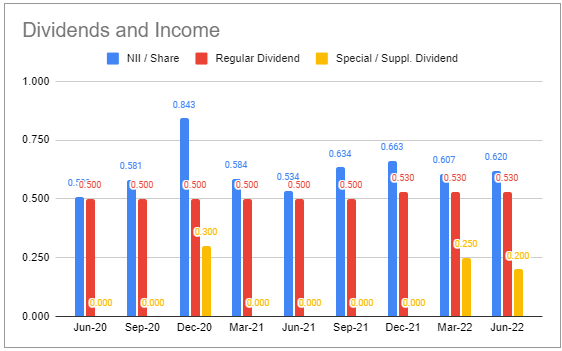
With additional income tailwinds in place for Q3 and the fact that no more special dividends have been declared, the raise is not a surprise.
Given its strong portfolio quality and low fee structure, it doesn’t make much sense for the stock’s valuation to remain significantly below the sector average. The rally this week closed the valuation gap to 2% with BXSL at 96% versus a sector average valuation of 98%. We continue to hold BXSL in our Core Income and High Income Portfolios.
Carlyle Secured Lending (CGBD) tumbled earlier in the week on the back of a rating change by JPM to neutral from overweight, although it fully recovered by the end of the week. The downgrade appears to be driven by the fact that the stock got close to the JPM target of $14.50 which is a 0.85x target multiple off the expected 2023 NAV of $17.13 (Q2 NAV was $16.81).
This target multiple is apparently based on the remaining non-accruals plus NAV erosion from legacy assets that have been exited. In our view, this reasoning makes little sense.
First, management has guided the company’s Q3 non-accruals to be below 3% which would put it not far from the sector average. As we discussed in our Q2 update, the fair-value of non-accruals rose in Q2; however, this was due to a mark-up of existing non-accrual investments which is a good thing as their health has improved. In fact, if management simply writes off all of their non-accruals, the company’s valuation would rise to around 90% which would still put it well below the sector average despite a superior non-accrual stance. In other words, the 0.85x target in no way corresponds to the company’s actual level of non-accruals.
And secondly, it’s not clear why the company’s valuation target should be so low for legacy investments that have long been exited. Perhaps JPM believe that these legacy investments are evidence of a poor underwriting track record at CGBD; however, there is little evidence of a poor track record from the company’s total NAV returns as the chart below shows. The longest “round number” return period we have for CGBD relative to the sector is 5 years on which basis the company has delivered 93% of the average sector return (i.e. 8.58% / 9.21%) – a number which is well above the 85% JPM target. Moreover, over the last 1-3 years, the company has outperformed the sector in total NAV terms and it has delivered net realized gains which would not be possible if its underwriting track record has really been poor.
Systematic Income BDC Tool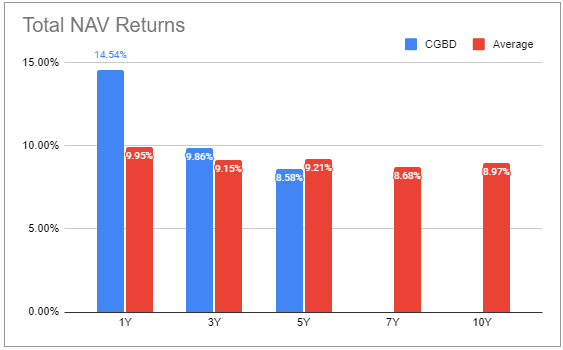
We continue to have a Buy rating on CGBD and hold it in our High Income Portfolio. The stock has outperformed the sector this year by over 15% with a 10% return.
Be the first to comment