

Darren415
This article was first released to Systematic Income subscribers and free trials on Oct. 8.
Welcome to another installment of our BDC Market Weekly Review, where we discuss market activity in the Business Development Company (“BDC”) sector from both the bottom-up – highlighting individual news and events – as well as the top-down – providing an overview of the broader market.
We also try to add some historical context as well as relevant themes that look to be driving the market or that investors ought to be mindful of. This update covers the period through the first week of October.
Be sure to check out our other Weeklies – covering the Closed-End Fund (“CEF”) as well as the preferreds/baby bond markets for perspectives across the broader income space. Also, have a look at our primer of the BDC sector, with a focus on how it compares to credit CEFs.
Market Action
This week saw very high volatility in the BDC sector. Interestingly, it happened to the upside where the sector rallied around 8% over the first two days but then gave up about half of it over the rest of the week.
Systematic Income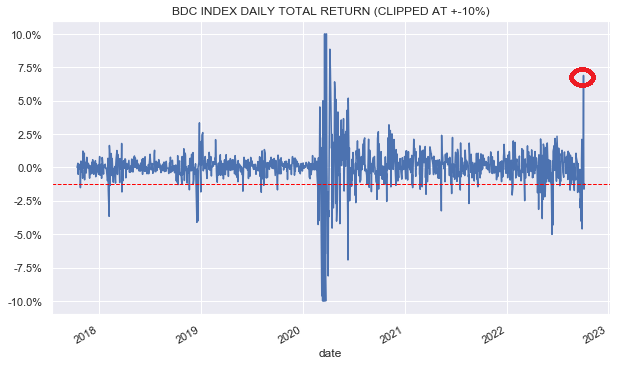
The market continues to react in a manic depressive way to macro releases, hoping for a Fed pivot but being denied it due to a strong labor market. Expectations of a pivot increased early in the week with a dovish move by the RBA that signaled a possible global policy rate peak. However, with payrolls coming in above expectations and unemployment falling to a 50-year low frees up Fed’s hand for more tightening which pushed markets lower at the end of the week.
The BDC index is 3% off the recent lows which is biased around 1% higher due to the large gain in FCRD as discussed below.
Systematic Income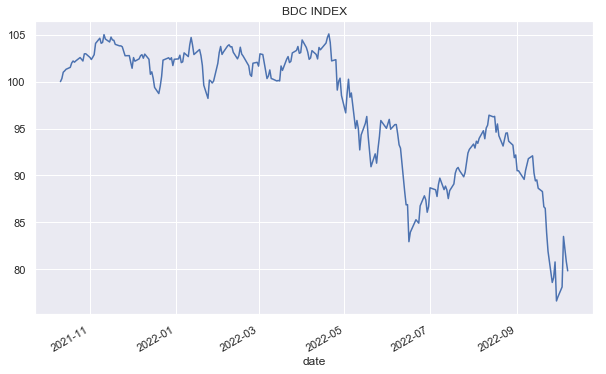
The sector valuation remains attractive by historical standards.
Systematic Income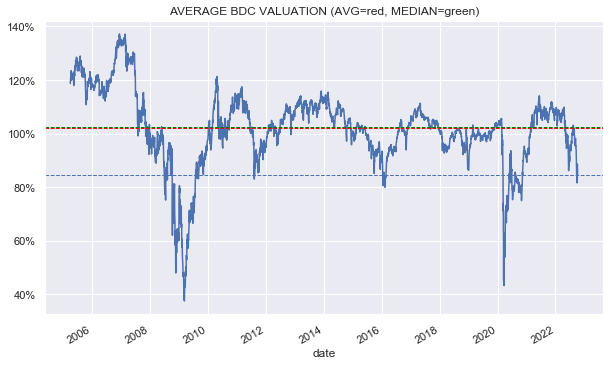
Market Themes
This week we rerun the exercise we did in Q2 and gauge the likely change in sector NAVs over Q3. For Q2 we estimated the sector NAV drop to be on the order of 2-3% which proved more or less correct (median of -2.7% and average of -2.9%).
As we discussed earlier, the basis for our estimate was the change in high-yield corporate bond credit spreads. This isn’t something we came up with – the statistical relationship with NAVs is fairly good and it’s something that management teams themselves point to when discussing changes in unrealized appreciation / depreciation in their portfolio marks.
The chart below shows the quarterly percentage changes in the median BDC NAV (x-axis) versus the quarterly change in the high-yield corporate bond spread (y-axis) since 2010. The relationship isn’t perfect but it’s there. It suggests that a 1% rise in credit spreads causes a drop in the NAV of about 2%, all else equal. If we exclude the COVID shock then a 1% rise in spreads has an impact closer to a 1% NAV drop than a 2% drop.
Systematic Income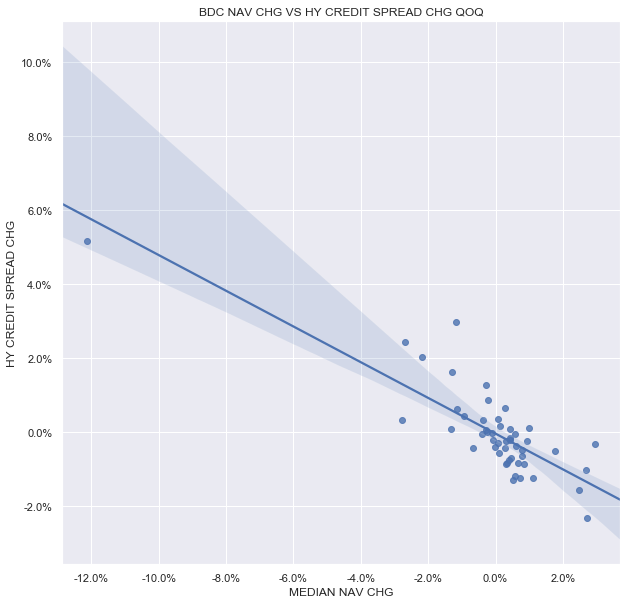
It may not have felt like it but HY corporate bond credit spreads actually tightened over Q3 by 0.44%. If we go strictly on this basis then we would expect NAVs to be roughly flat over Q3. However, given the clear downtrend in broader macroeconomic leading indicators we do expect BDCs to see some deterioration in their portfolios and, hence, some amount of unrealized depreciation.
Separately, it’s not quite right to compare high-yield corporate bond credit spreads to BDC NAVs since BDCs don’t hold publicly traded bonds – they primarily hold private loans. Plus, there are many other moving parts in BDC NAVs such as retained earnings, dividends, idiosyncratic changes in the portfolio, defaults, non-accruals, prepayments and many other factors.
Given the large amount of uncertainty around these factors, we wouldn’t expect NAVs to be flat. However, we also don’t expect them to fall off a cliff. An average number in the range of a 0-2% drop across the sector makes sense.
For some perspective, the sector valuation over Q3 has fallen by around 5%.
Systematic Income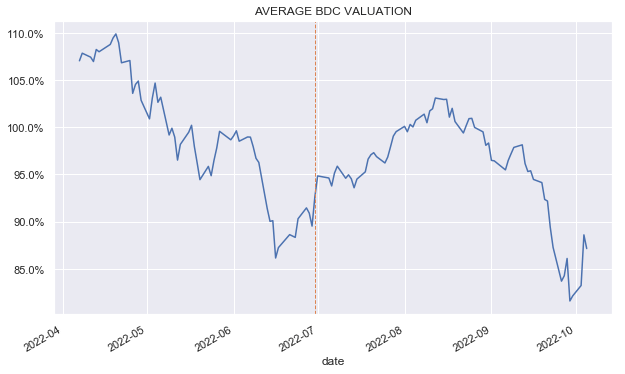
Market Commentary
Crescent Capital BDC (CCAP) plans to acquire First Eagle Alternative Capital (FCRD). The consideration will be for $4.86 per share or a 66% premium to the stock’s closing price on 3-Oct. The price represents an 8% discount to the company’s Q2 NAV. After the transaction, the ownership of the combined entity will be by 83% of CCAP shareholders and the rest by FCRD shareholders.
Our view is that this doesn’t make the combined entity particularly attractive even though CCAP looks to have decent long-term returns and an attractive valuation. FCRD has been a car crash of a BDC with the worst total NAV returns among those we follow (out of 29 names). Specifically, FCRD has a -6.7% total NAV return over the last 5 years (that’s per annum) versus 9.2% sector average (and 10.5% for the median BDC). That’s a shocking gap of 16% each year. Recent trajectory has only gotten worse. In our view, a discount of 8% to the company’s portfolio looks very expensive.
Systematic Income BDC Tool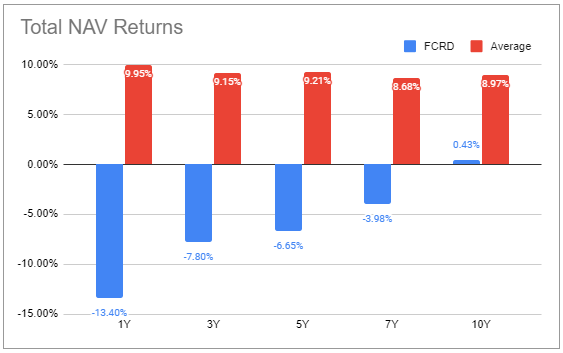
Saratoga Investment Corp (SAR) released its earnings due to its unusual quarter period profile which is shifted a month earlier from the calendar quarter. Overall the results were good. Adjusted net income rose by 9% from the previous quarter, well above expectations. GAAP net income (which includes capital gains incentive fees) fell by 3%. NAV fell 2% (0.35% of that was due to bond extinguishment) with the rest in unrealized depreciation.
Key takeaways are that loan quality has not worsened, current yield of the portfolio increased and realized gains continue to run positive. Obviously this is just one result but it’s a good early sign for the broader BDC sector. Portfolio quality is holding up very well, NAVs are not falling off a cliff and net income is moving higher (and remains understated given the current level of short-term rates). This relative stability in NAVs and rising net income should also support BDC prices.
Stance And Takeaways
We continue to find value in the sector, adding on air pockets and lower lows. For instance, ARCC traded as low as a 10.5% discount off its Q2 NAV – an unusually low level, before finishing the week at a 6% discount. Absolute valuations are attractive nearly across the board, however, valuations that are attractive in both absolute and relative terms are not as common. Ultimately, it’s hard to be overly dogmatic about this point and it can certainly make sense to start allocating to BDCs that remain relatively expensive but have attractive absolute valuations alongside a strong track record. This includes names like ARCC, GAIN and TSLX.
Be the first to comment