

Darren415
This article was first released to Systematic Income subscribers and free trials on Nov. 5.
Welcome to another installment of our BDC Market Weekly Review, where we discuss market activity in the Business Development Company (“BDC”) sector from both the bottom-up – highlighting individual news and events – as well as the top-down – providing an overview of the broader market.
We also try to add some historical context as well as relevant themes that look to be driving the market or that investors ought to be mindful of. This update covers the period through the first week of November.
Be sure to check out our other Weeklies – covering the Closed-End Fund (“CEF”) as well as the preferreds/baby bond markets for perspectives across the broader income space. Also, have a look at our primer of the BDC sector, with a focus on how it compares to credit CEFs.
Market Action
The BDC market had another terrific week, outperforming the broader income space for the second week in a row. As we highlighted a number of times in our recent weeklies, and two weeks ago in particular, right before the most recent gains, the market was set up for a decent rally on the back of likely stable NAVs and rising income.
Though most NAVs are coming in lower, the average drop is modest of less than 1% – in the middle of our expected -2% to zero aggregate range.
Systematic Income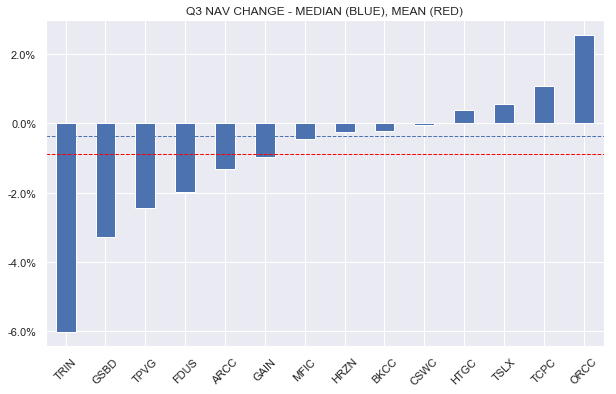
So far, the NAV profile of the sector is holding up very well compared to the previous quarter.
Systematic Income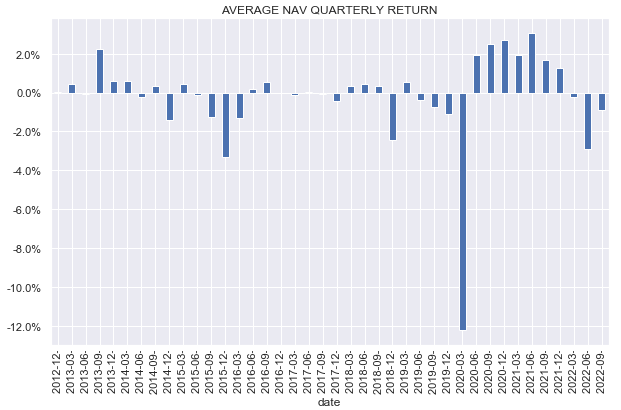
Net income is coming in sharply higher in the sector, which is reflected by nearly all companies raising their dividends, some by high single-digit figures. As we highlighted earlier, a number of factors are leading to strong dividend hikes, and these dividend hikes are pushing up prices. The net result is that year-to-date BDCs are one of the best-performing income sectors.
Systematic Income BDC Tool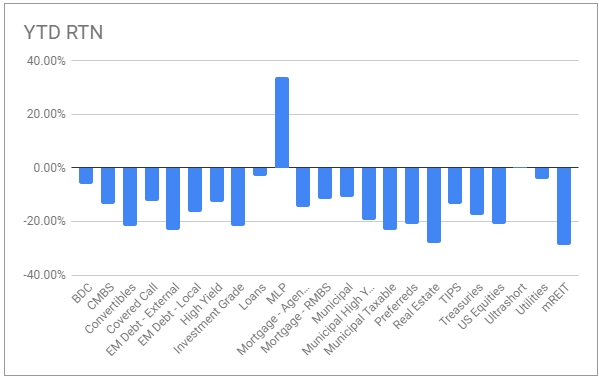
With the average sector valuation of 94%, the sector is no longer trading at historically attractive levels that we highlighted just a few weeks ago. At the same time, the valuation remains well below its longer-term average, creating some opportunities in pockets of the sector.
Systematic Income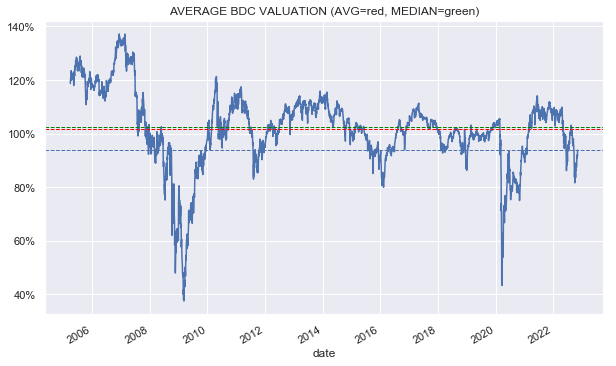
Market Themes
Close to half of the BDC sector has reported so far, and a number of themes of this earnings season are emerging. A snapshot of some of the key ones are shown below – an extract from our BDC Tool.
Systematic Income BDC Tool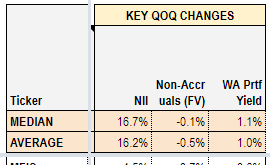
Net income has jumped around 16% on both the average and median basis over the quarter. Earlier we discussed that because of the lag with which higher short-term rates get passed through to income we would only see a significant impact of higher rates in Q3 and this is indeed what we see.
Interestingly, non-accruals have fallen in the sector – something we didn’t expect. To be fair, some of the reason for this is that non-accruing assets are being written down, causing their valuations to fall. That said, the median change in non-accruals at cost is flat vs. the previous quarter.
Finally, we are also seeing a big jump in the BDC portfolio yields of around 1%. Not all of this increase flows straight to net income since interest expense has increased as well. However, interest expense has a much lower impact on net income because it only applies to the leveraged portion of the balance sheet and because roughly half of BDC liabilities are floating-rate. In short, rising debt costs are only eating away at about a quarter of the gains on the asset side.
If interest rates stabilize and remain high, we would expect net income to slowly move lower over time as fixed-rate debt is refinanced into higher-coupon securities. That said, this will take time and is not something we expect to happen next year.
Market Commentary
Hercules Capital, Inc. (HTGC) declared results. Recall, the company increased its base dividend by 3% in October. The NAV rose by 0.4%. HTGC is also interesting to follow as it clearly lays out prepayments. As many investors know, prepayments collapsed in the first two quarters of the year as tends to happen in a period of lower risk appetite and fewer deals (e.g., IPOs, mergers, etc.). However, the Q3 prepayment number from HTGC increased substantially and stands well above Q1 and Q2 numbers. Although it’s still at a historically low level, this does suggest that deal sentiment is returning somewhat to the BDC sector and this could raise prepayment fees from the floor, if not in Q4 then next year.
HTGC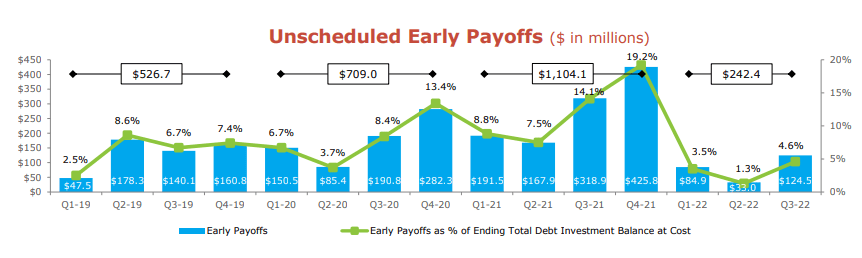
Turning to Fidus Investment (FDUS), the NAV fell around 2% which was biased lower due to the early declaration of the Q4 dividend – a result of tax rules. Absent this bias, NAV would have come in positive, outperforming the sector. This artificial drop will come back as a gain in Q4.
Internal portfolio rating quality worsened slightly but non-accruals at fair-value fell (number of companies on non-accrual status remained flat at 3).
Systematic Income BDC Tool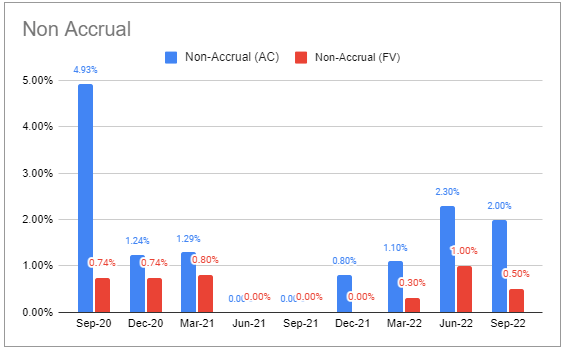
The company has a weird mix of regular, supplemental, and special dividends. For Q4, the company kept its regular dividend the same at $0.36 but increased the supplemental from $0.07 to $0.15 and declared a new special of $0.10.
For 2023, the base dividend was increased going forward to $0.39. The supplemental dividend will equate to the gap between the base dividend and adjusted NII (i.e., ex-capital gain incentive fees) while the special dividend is designed to eat away at the massive spillover that has accumulated (which itself will also be reduced in part by the deemed dividend in 2023).
Stance & Takeaways
This week, we downgraded a number of BDCs in our Income Portfolios to Hold from Buy as a result of surging valuations.
For example, the Fidus Investment Corp – our third-largest position in the High Income Portfolio – has surged to a valuation of 104%, or 10% above the sector average. This is very unusual for the stock, and although we view it as a strong BDC, the valuation looks expensive.
Systematic Income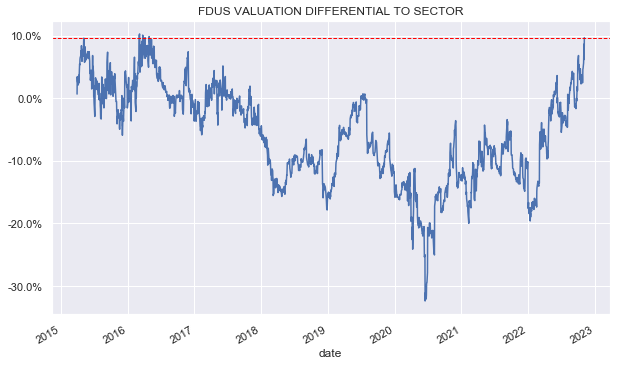
The story is very similar with Oaktree Specialty Lending (OCSL) which has moved to trade close to 5% above the sector valuation. Although this is not undeserved in our view, we could easily see some weakness ahead which could allow investors to add new capital at better levels.
Systematic Income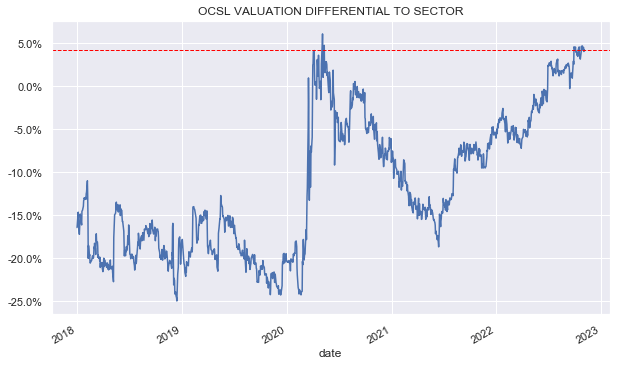
Be the first to comment