

alfexe
(This article was co-produced with Hoya Capital Real Estate)
Introduction
I decided to take a break from covering tax-free CEF reviews and compare two CEFs that invest in the taxable section of the municipal bond market. The taxable municipal bond market started after passage of the Tax Reform Act of 1986, which eliminated the issuance of tax‐exempt bonds for certain purposes. The Tax Reform Act of 1986 lowered the top tax rate for ordinary income from 50% to 28%, greatly reducing the tax advantage that tax-exempt bonds offered.
Even for investors in states with high income tax rates, they should compare after-tax returns of these funds with their tax-exempt cousins as that is what really matters: the money left in your pocket after Uncle Sam and the state tax man visit.
This article reviews the following taxable municipal bond CEFs.
BlackRock Taxable Municipal Bond Trust review
Seeking Alpha describes this CEF as:
The investment objective is to seek high current income, with a secondary objective of capital appreciation. The Trust seeks to achieve its investment objectives by investing primarily in a portfolio of taxable municipal securities, including Build America Bonds, issued by state and local governments to finance capital projects such as public schools, roads, transportation infrastructure, bridges, ports and public buildings. Benchmark: Bloomberg Taxable Municipal Bond USD. BBN started in 2010.
Source: seekingalpha.com BBN
BBN has amassed $1b in assets and has a Forward yield of 8.05%. BlackRock charges 107bps in fees. BlackRock adds the following statement about allowable investments:
The Trust also has the ability to invest up to 20% of its managed assets in securities other than taxable municipal securities. Such other securities include tax-exempt securities, U.S. Treasury securities, obligations of the U.S. Government, its agencies and instrumentalities and corporate bonds issued by issuers that have, in the investment adviser’s view, typically been associated with or sold in the municipal market, such as bonds issued by private universities and hospitals, or bonds sold to finance military housing developments.
Source: BlackRock.com BBN
BBN holdings review
BlackRock lists the following useful portfolio characteristics, of which there are 170 bonds held.
blackrock.com BBN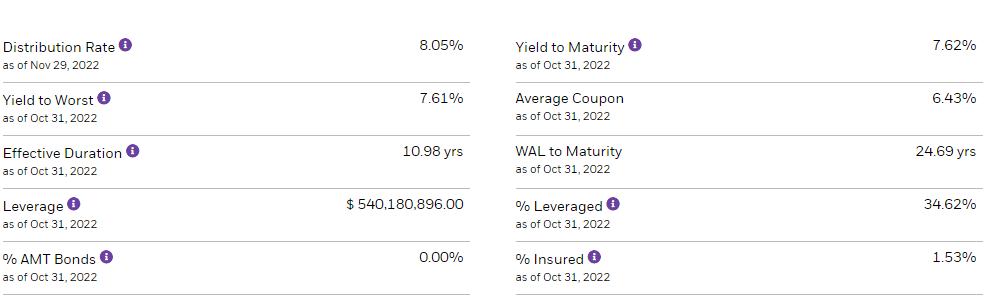
The Weighted Average Life to Maturity appears long even by municipal bond standards and helps explain the large price drop in 2022 as interest rates climbed. Bond payments and early calls result in an Effective Duration just below 11 years, under half the maturity length. Leverage is almost 35% and BlackRock listed that cost as the source for 20bps of the fund’s fees. Being taxable municipal bonds, interest payments do not affect the investor’s AMT calculation.
While sectors might differ from tax-free municipal bonds, they do exist here too, including tax-back bonds (35.4%).
blackrock.com sectors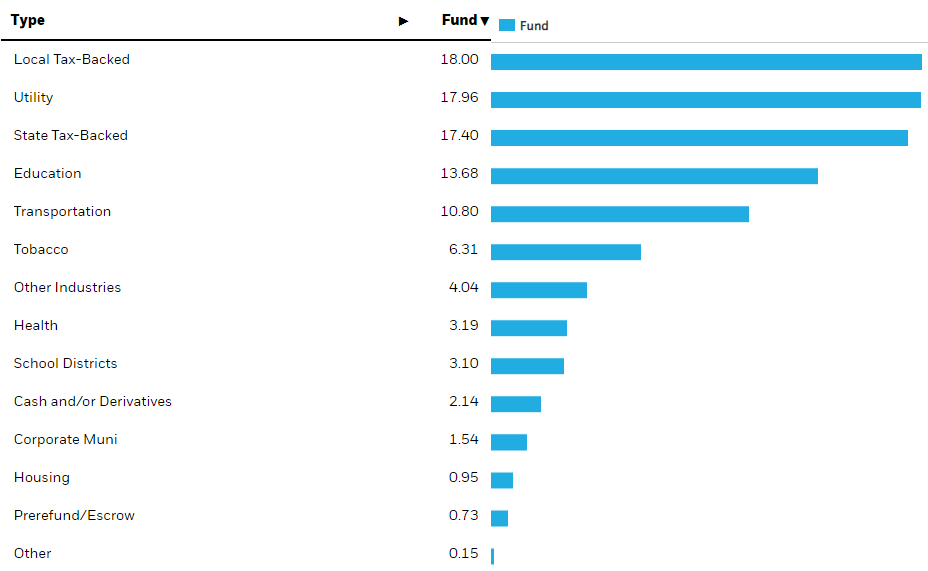
BBN holds bonds where the issuer is incorporated or resides in one of 37 states, with California being the highest exposure by far.
blackrock.com states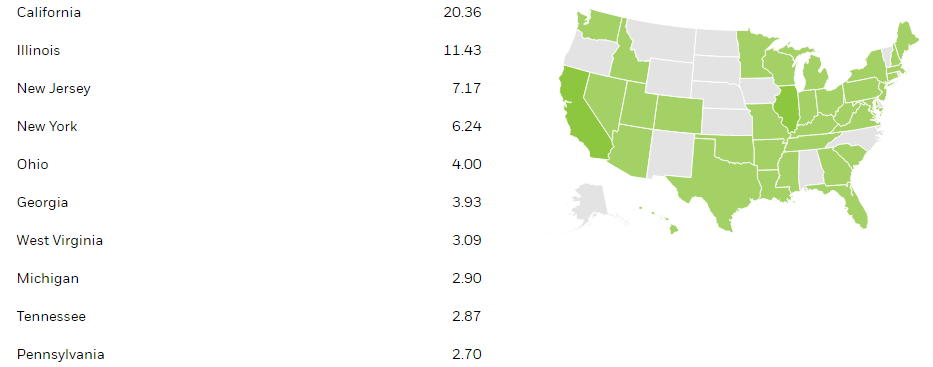
More important than state, since “state-backed” is only 17% of the portfolio weight, is how the bonds are rated for riskiness.
nuveen.com Ratings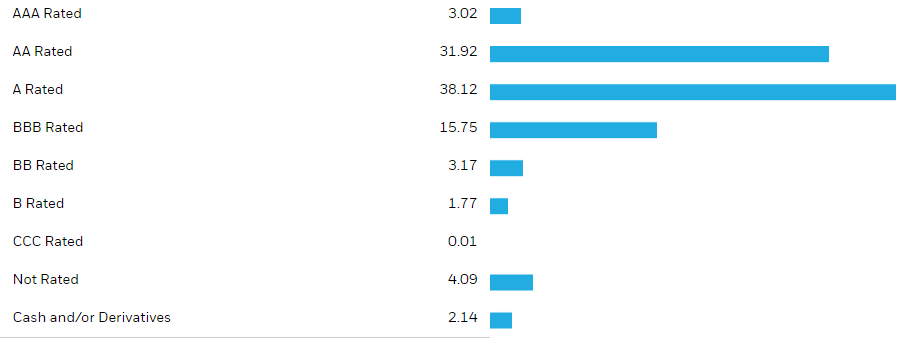
Only 5% of the rated bonds are considered below investment-grade. Morningstar gives the portfolio an overall rating of “A”. Unlike what I see in tax-free funds, very few of the bonds here are unrated.
Here is another difference between this CEF and tax-free ones: a vast majority are not callable; which gives the portfolio stability. Also, almost all the callable bonds are not until 2027 or later.
blackrock.com Call schedule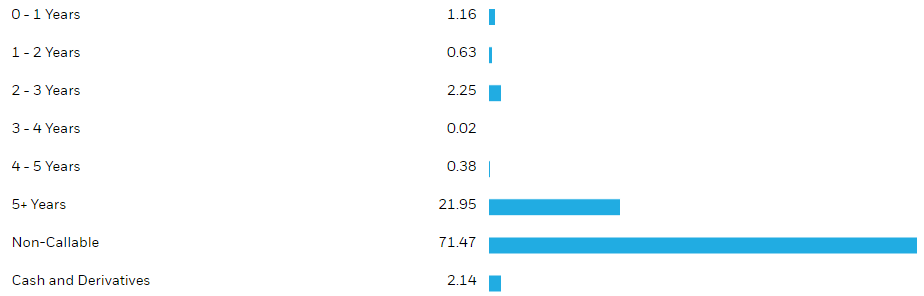
As one would expect with a near 25-year WAL-to-Maturity value, few bonds mature in the near future, which is unfortunate with rates at a multi-year high.
nuveen.com Maturity schedule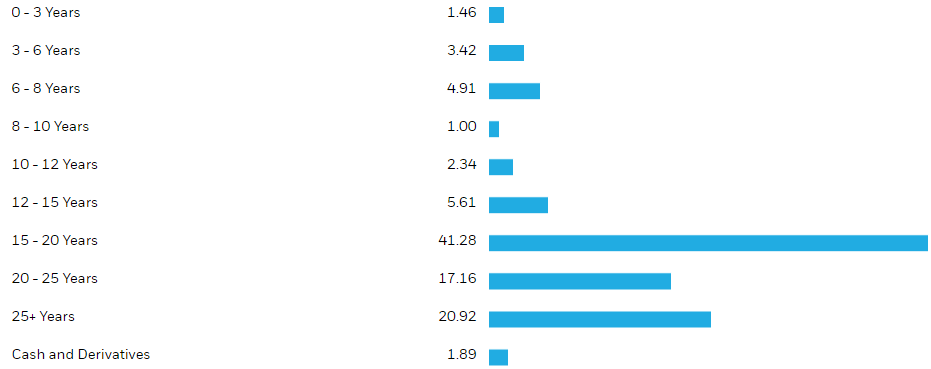
The plus side to this schedule is when rates start to retreat, the price damage of 2022 will reverse itself faster than a fund with shorter WAM.
Top holdings
blackrock.com holdings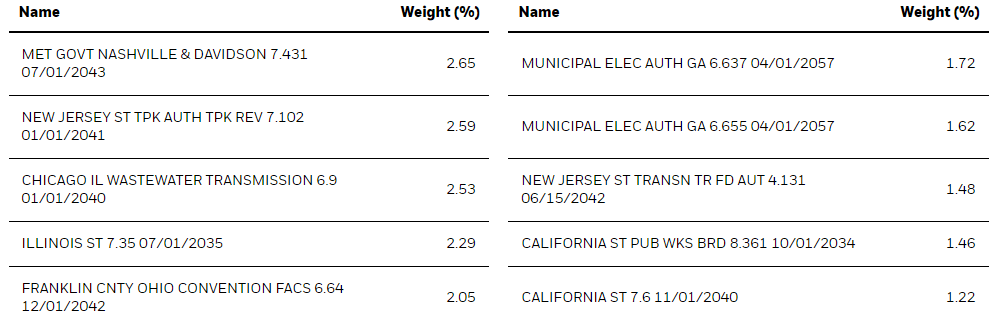
Unlike most funds, I was not able to locate a complete holdings list. The top 10 shown are just under 20% of the portfolio. The average bond price of the portfolio is $98.65. Turnover was just 3% last year.
BBN distribution review
seekingalpha.com BBN DVDs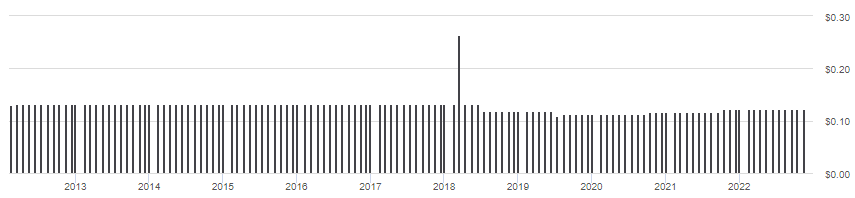
The monthly payout has been $.1229 for just over a year, which was a boost from the prior rate. With almost no bond calls or maturities in the near future, that could limit any near-term payout increases. Even more telling is the fact the latest UNII document shows BBN only earning 73% of the current payment.
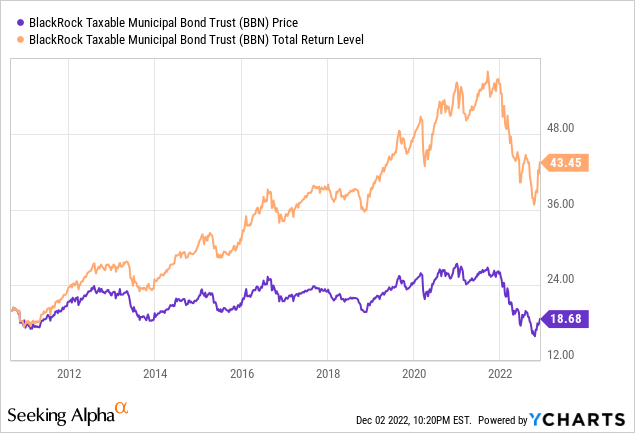
Price and NAV review
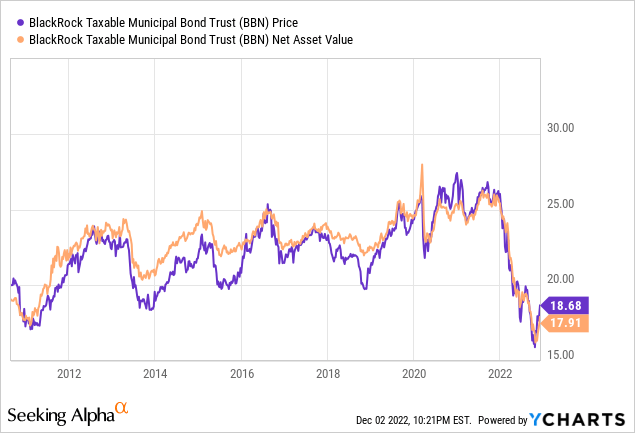
As the next chart will show, unlike times in the past, BBN has traded nears its NAV recently.
CEFConnect.com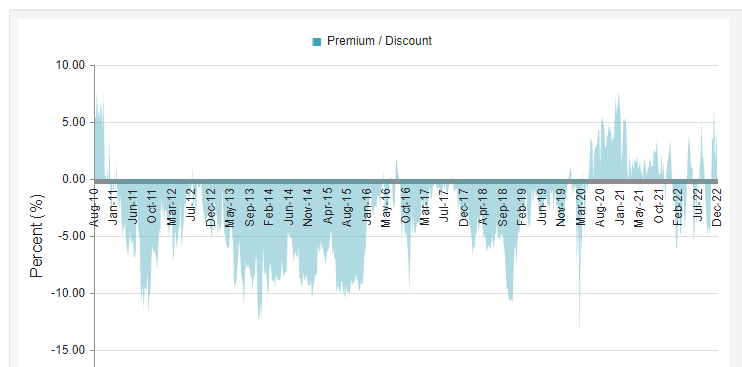
2022 has seen BBN constantly going back and forth between selling at a discount or premium, where it is now: 4.69%. Prior to COVID, this ETF spent most of its time at a discount, sometimes as deep at 10%.
Nuveen Taxable Municipal Income Fund review
Seeking Alpha describes this CEF as:
Nuveen Taxable Municipal Income Fund seeks current income and secondarily, enhanced portfolio value and total return, by investing primarily in a diversified portfolio of taxable municipal securities. Up to 20% may be invested in other securities, including tax-exempt municipal securities and U.S. Treasury and other government securities. The Fund invests at least 80% of its managed assets in securities rated, at the time of investment, investment grade. Benchmark: Bloomberg Taxable Municipal TR USD. NBB started in 2010.
Source: seekingalpha.com NBB
NBB has $456m in AUM, or about half those held by BBN. It comes with a lower yield (7%) and higher fees: 131bps too. Leverage is about 42%, with a current annualized cost of 3.76%.
NBB holdings review
nuveen.com NBB
NBB hold slightly less bonds and both the effective duration (9.55 yrs) and effective maturity (19.87 yrs) are shorter than BBN’s. The average coupon (6.28%) favors the other CEF too.
nuveen.com sectors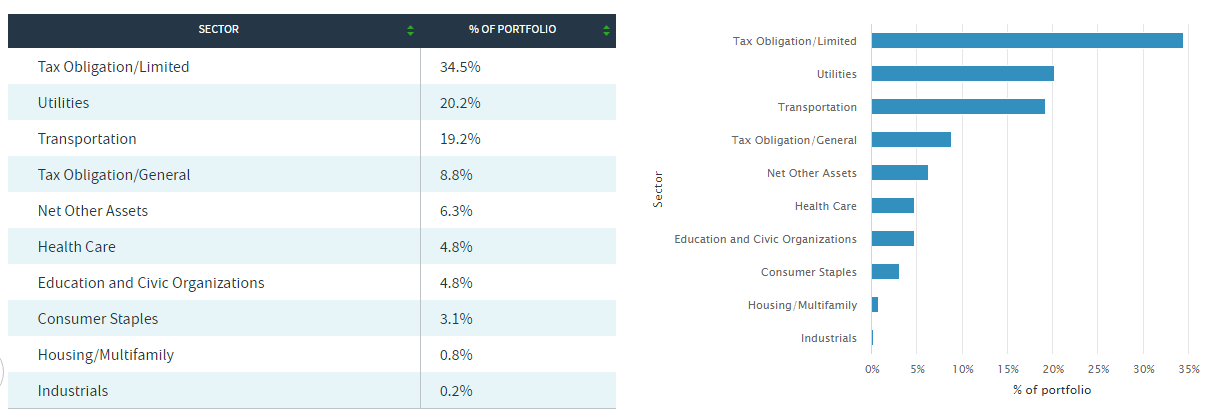
NBB has more tax-backed bonds (54%) to BBN’s 35%, making it much more dependent on the state and locals to generate tax revenue. NBB lists no exposure to the Tobacco bonds. Here, the top states are California (like BBN) and New York, comprising 41% of the portfolio weight.
nuveen.com States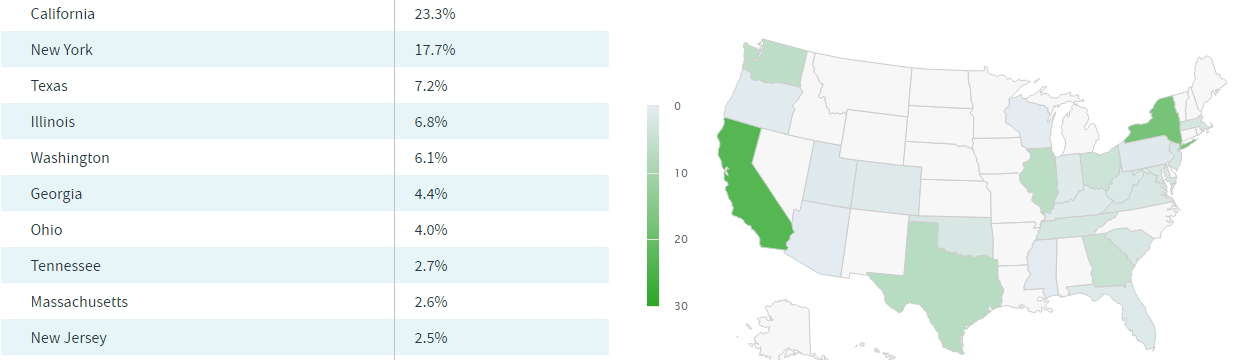
The coloration of the map is misleading as NBB has bonds from 41 states, more than BBN does. Morningstar give this portfolio a better rating at “A+”.
nuveen.com ratings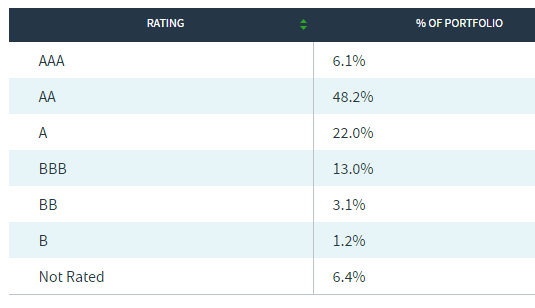
Again, the non-investment-grade and “Not rated” weights are minor. Another trait is the lack of callable bonds, 5.1% in the next five years; almost none in the next two.
nuveen.com Call schedule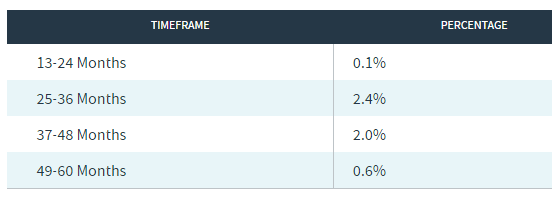
Maturities are non-existent over the next five years, and only 4% over the next five years.
nuveen.com maturities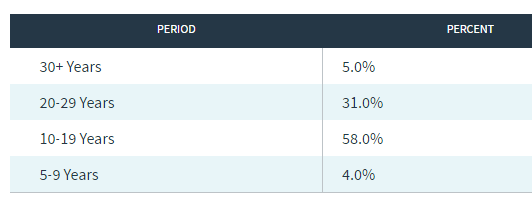
Unlike BlackRock, Nuveen provides a list of the top issuers; some of which have multiple bonds within the portfolio.
nuveen.com Issuers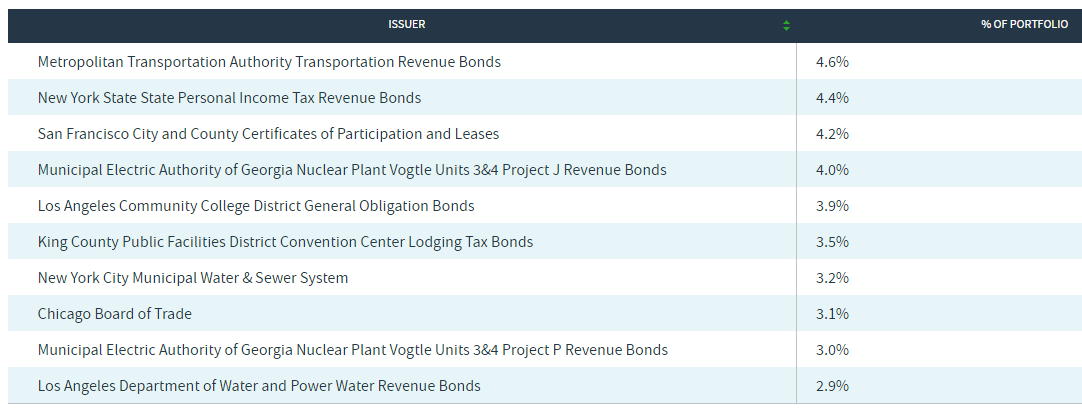
Top holdings
nuveen.com; compiled by Author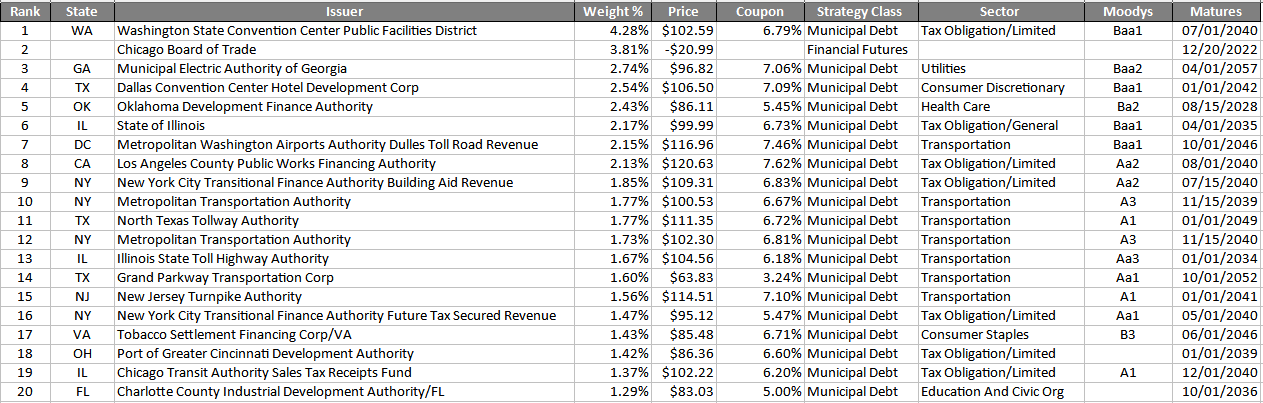
Notice this CEF is short financial futures; whether BBN does I cannot report since a complete holdings list was not available. Counting the futures, the Top 20 account for 41% of the portfolio.
NBB distribution review
nuveen.com payouts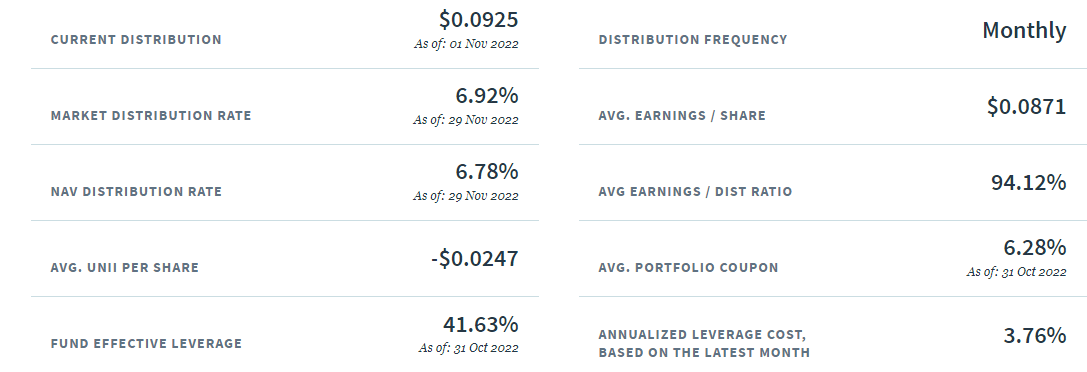
NBB is also not earning its payout, like BBN, but the ratio (94%) is much higher.
seekingalpha.com NBB DVDs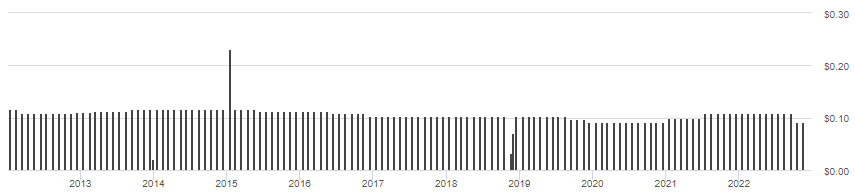
Starting with the November payout, the rate was cut from $.1085 to $.0925. The above earnings ratio doesn’t fully reflect this change as its a 3-month calculation.
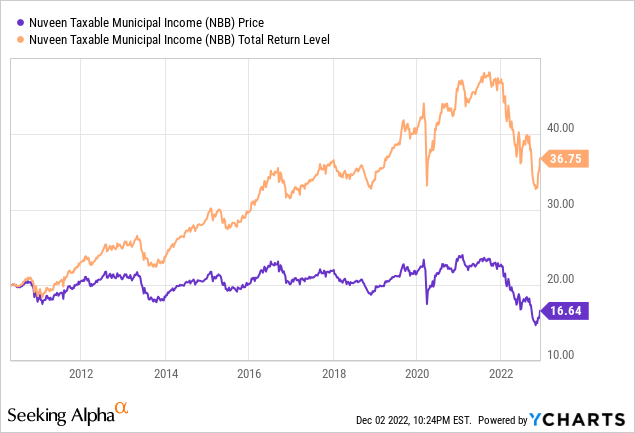
NBB price and NAV review
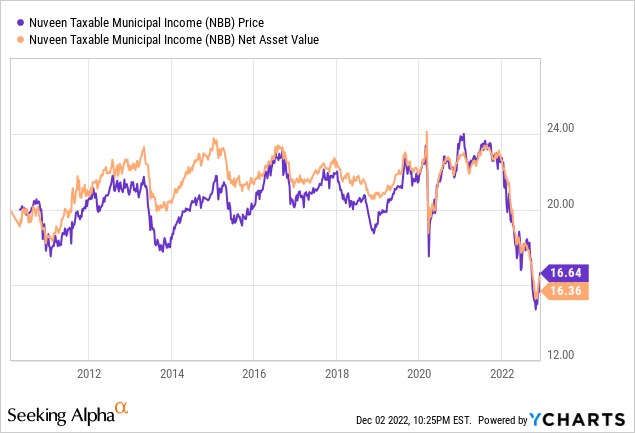
Like BBN, recent history shows little spread between NBB’s price and NAV.
CEFConnect.com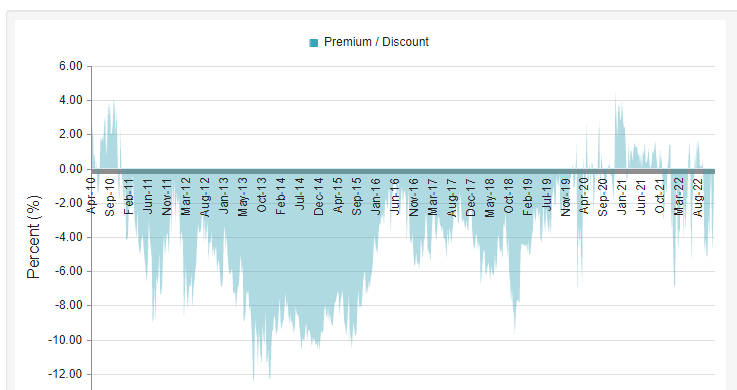
NBB has been both at premium and discount levels in 2022, though here NBB is currently at a .95% discount after its recent price/NAV gap rally. While that ratio favors NBB over BBN, BlackRock’s better performance would outweigh that fact for me.
Portfolio strategy
When you look at returns and risk data, the BlackRock appears to be the better fund, with its higher return more than offsetting its higher StdDev and Max drawdown. I only wish BlackRock would share more data about what their fund holds. I didn’t give it a Buy rating due to its recent 10% upward move in its price/NAV ratio in the past six weeks.
PortfolioVisualizer.com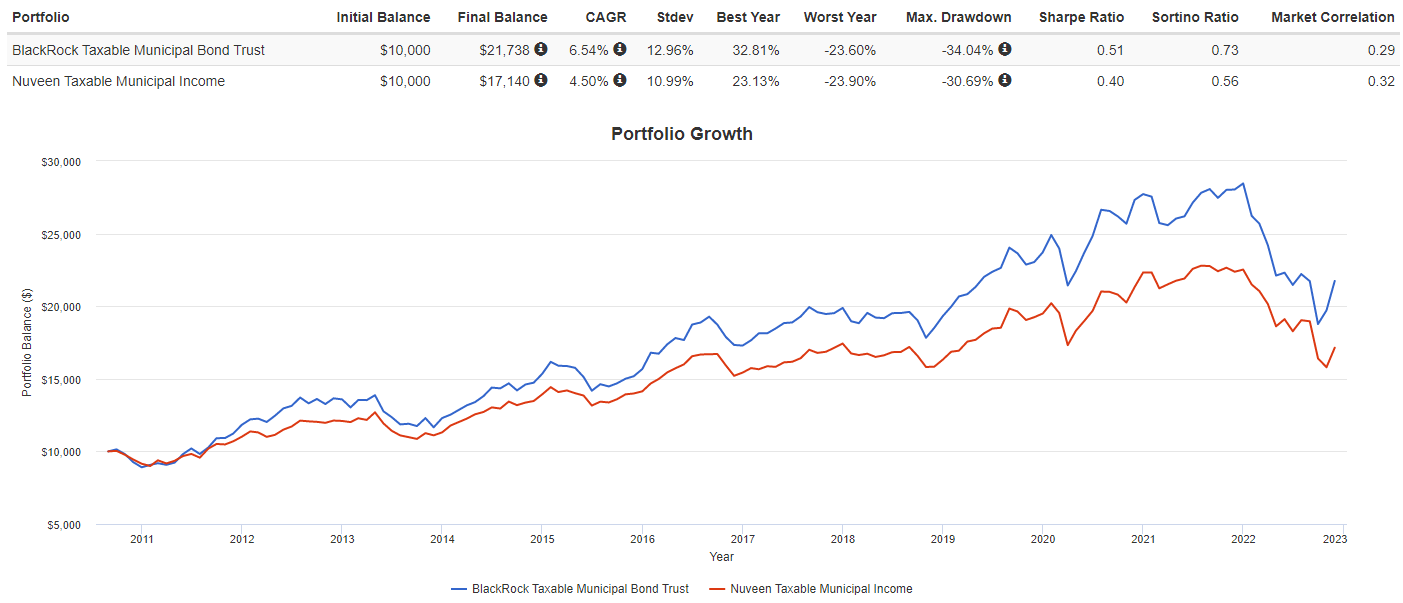
For those who like taxable munis but do not want the leverage, there are two ETFs to consider, though the first is 30% in corporates too:
- Guggenheim Taxable Municipal Bond & Investment Grade Debt (GBAB)
- Invesco Build America Bond Portfolio ETF (BAB)
I also included one of the better performing tax-free funds, the Nuveen AMT-Free Municipal Credit Income Fund (NVG), where I reviewed recently (article link), to see how the taxable and tax-free compare. The returns would need to be adjusted for the difference in how the payouts are taxed.
PortfolioVisualizer.com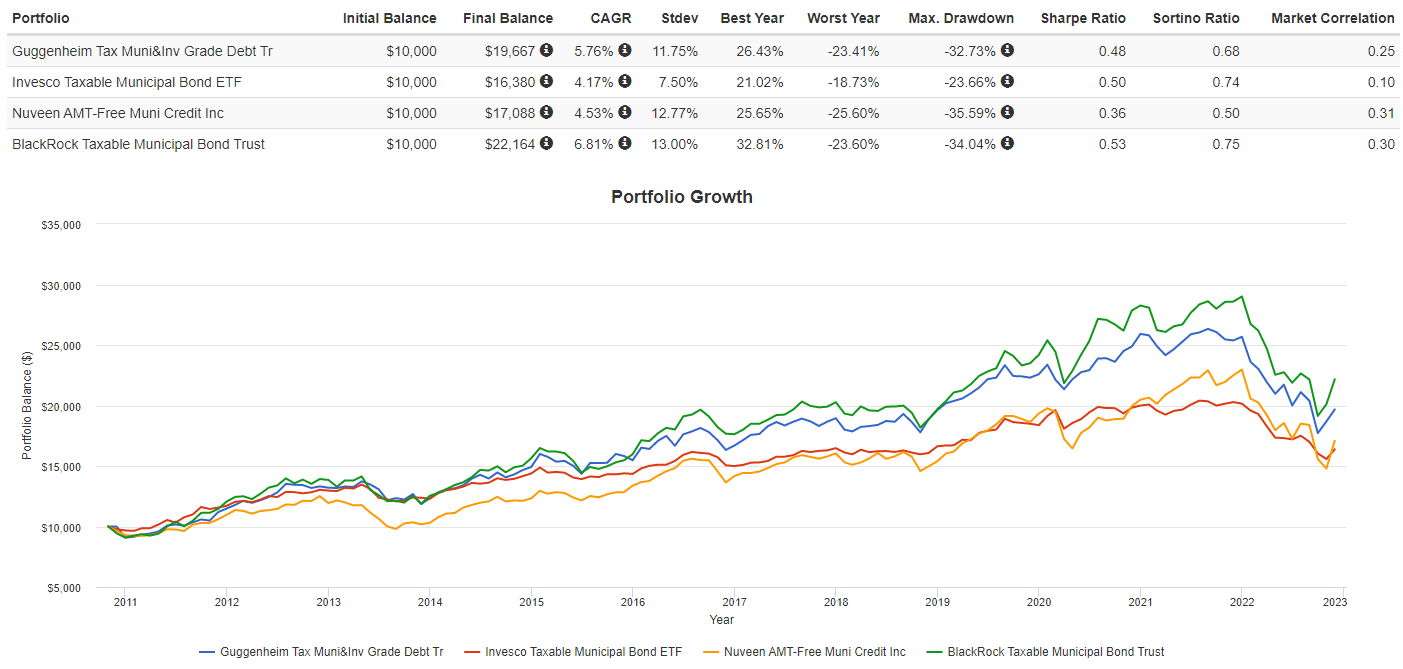
Measuring from late 2010, the BlackRock taxable CEF was the best performer in CAGR, Sharpe, and Sortino data. It appears the owning corporates aided GBAB as it places ahead of BAB, which now trails the NVG tax-free CEF.
Final thoughts
Remember the adage:” Do not let the tax tail wag your investment dog!”: meaning taxes should not be an investors top concern, what you earn after the taxman visits should be.
For those more interested in the tax-free versions available, here are a few links to some of my recent reviews:
For those in California, New Jersey or New York, single-state funds exist:
Be the first to comment