

Dan Kitwood/Getty Images News
Introduction
Barclays PLC (NYSE:BCS) reported 1Q22 results on 28 April 2022. This was the first results presentation for newly appointed CFO, Anna Cross, and only the second set of results delivered by CEO C.S. Venkatakrishnan (Venkat). With the increased uncertainty that accompanies management change, my April 2022 STRONG BUY call on BCS was published with a slight sense of nervousness, which was only partly eased by the fact that both the CEO and CFO were internal appointments. Based on evidence to date, it is comforting that the new leadership team does not seem to have a big agenda to shake up the business. In this note I discuss some of the more interesting aspects of the 1Q22 update and refresh my fundamental valuation of BCS.
Barclays UK – Net Interest Margin Recovery
In Chart 1 below, I plot the net interest margin, or NIM, for the Barclays UK division (referred to as BUK). BUK’s NIM took a painful hit in early 2020 as interest rates fell to near zero levels. The NIM squeeze came mainly from two factors. Firstly, income that was lost as lending rates plummeted was unable to be fully recouped via lower deposit and other funding costs. Secondly, BUK’s liquid assets balance shot up dramatically – the higher liquidity holdings were positive in terms of earnings, but created a drag on the reported NIM (as margins earned on the liquidity book are very skinny). Since the NIM bottomed in 2Q20, BUK has gradually been tweaking lending and deposit rates in order to try to restore the NIM, however progress has been hampered by stubbornly high liquidity holdings and a reduced loan book weighting to credit cards (the credit card NIM is relatively high).
Chart 1:
Source: Author’s calculations based on Barclays financial reports.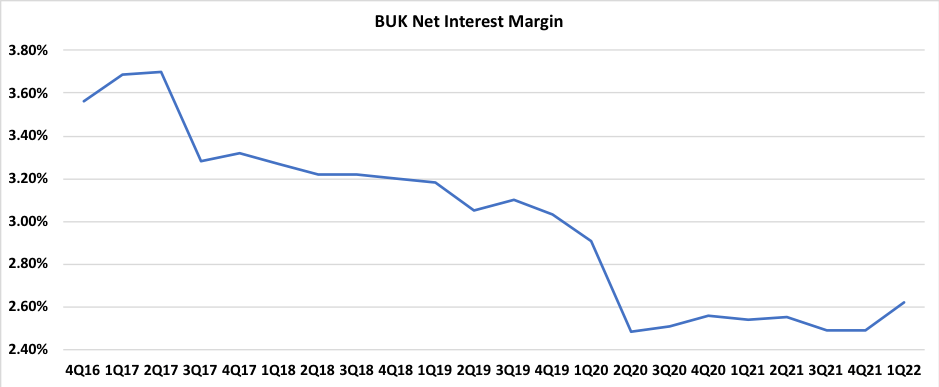
The leverage of BCS earnings to higher interest rates (the majority of which comes through BUK) is well understood and the company has regularly provided interest rate sensitivities to the market in quarterly presentations. The rapid upward movement in UK interest rates that commenced in mid-December 2021 helped to push BUK’s NIM up from 2.49% in 4Q21 to 2.62% in 1Q22. Further, at 1Q22 BCS guided to a BUK FY22E NIM of 2.70% to 2.80% (this guidance assumes that the Bank of England official interest rate reaches 1.75% by year end). Given that the FY22E NIM guidance reflects an average NIM rate over the year, this implies an exit rate for 4Q22E that is above 2.80%. If the Bank of England moves interest rates above 1.75% (which I consider to be a reasonably likely scenario), then we can probably expect to see BUK’s NIM move back above 3.00% at some point in FY23E. In 2021, few analysts would have predicted such a rapid improvement in BUK’s NIM. Note that for valuation purposes, I have set my BUK NIM assumption at 2.75%, which I consider to be on the conservative end of the likely range of NIM outcomes.
Investment Banking Income – Not Sustainable
My preferred approach to company valuation is to focus on sustainable earnings (other broadly equivalent terms would be ‘normalised earnings’ or ‘through-the-cycle earnings’). This type of approach requires analysts to pay careful attention to when particular components of a company’s operations are over-earning or under-earning relative to historical levels. In the case of BCS, it is pretty clear that the bank is currently over-earning in the investment banking area. BCS reports investment banking earnings through the Corporate & Investment Bank, CIB, which is a division of the Barclays International reporting segment. Chart 2 below plots quarterly CIB income, split between Markets and Banking. The step-up in Markets income from 1Q20 onwards is quite striking. Chart 3 looks through some of the quarterly volatility and shows CIB income on a last-twelve-months basis – the step-up in Markets income is also clear using this view.
Chart 2:
Source: Prepared by author based on Barclays financial reports.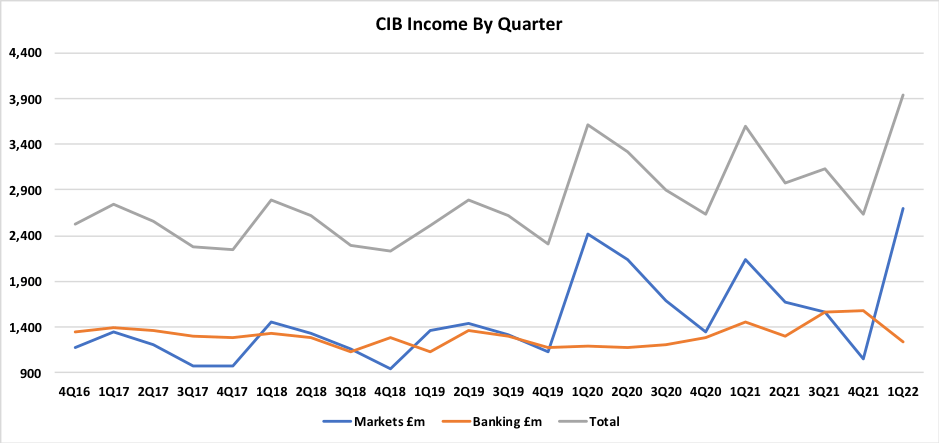
Chart 3:
Source: Prepared by author based on Barclays financial reports.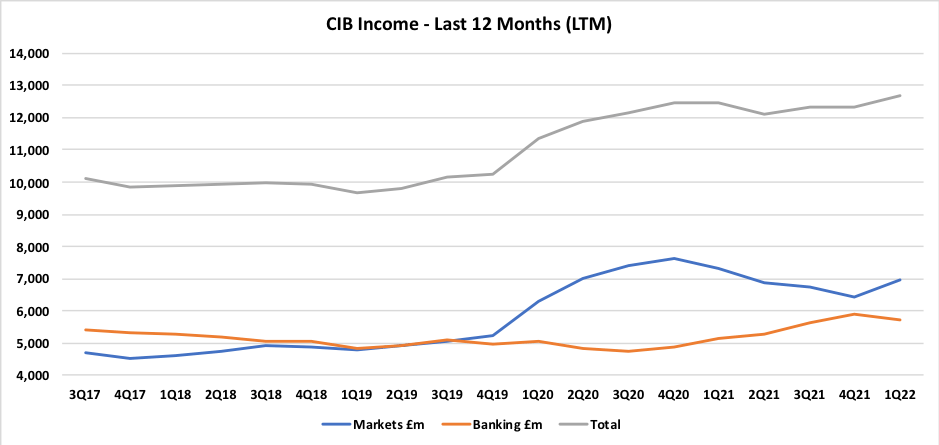
All too often I see companies going to considerable lengths to justify why components of earnings are below expectations, but rarely commenting when certain factors have contributed to unexpectedly strong earnings. It’s therefore somewhat refreshing to see that BCS isn’t shying away from the fact that Markets income is currently very elevated relative to history, with the chart below included in the CEO’s 1Q22 presentation.
Chart 4:
Source: Barclays 1Q22 Presentation, slide 6.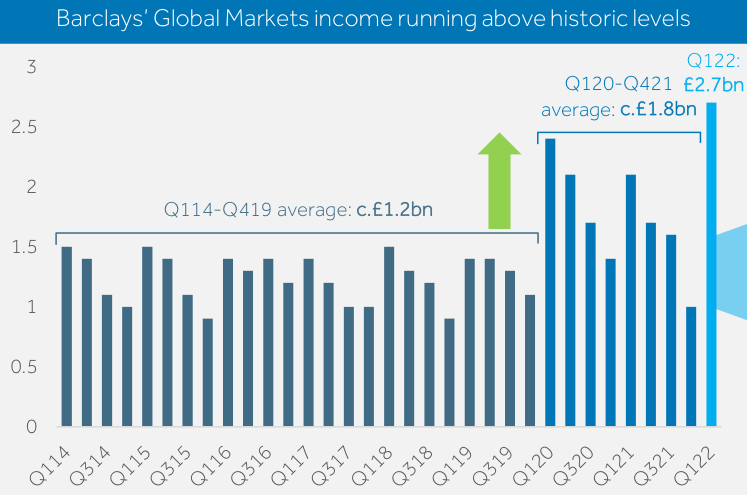
CEO Venkat argues that the improvement in Markets income is partly due to external factors and partly due to strategic changes implemented by BCS. He notes that competition in some product areas has reduced, as peers have exited certain activities; the implication being that BCS will have benefitted from improved market share and most likely also improved margins. What Venkat didn’t say, was that this easing of competitive tension could easily reverse. Analysts feeling bullish about the BCS Markets segment will point to the extremely strong 1Q22 result, but I would draw their attention to the comments made by the CEO shown below for a more realistic assessment. I also note that conditions in 1Q22 were particularly conducive to high levels of activity in Markets given the need for clients to urgently manage exposures relating to Russia, rising interest rates and volatile investment markets.
“However, as I said to you in the previous quarter, this growth will not always be in a straight line. Our relative performance will be stronger in some quarters than in others. For instance, in Q421 we underperformed our competitors, while in Q122 our performance has been particularly strong versus our competitors. This relative performance is determined by three things. The first is the businesses in which we engage. The second is the strength of our interaction with clients. And the third is particular idiosyncratic opportunities in which we have helped clients manage their exposures. In Q122, all three of these factors contributed to increased revenue.”
Source: Barclays 1Q22 Management Speech, page 4.
In the twelve months to 31 March 2022, BCS generated Markets income of £6,975m. My assessment is that this level of earnings is not sustainable over the longer term. For valuation purposes I therefore put through a large negative adjustment, and allow for Markets income of $6,000m pa. Some investors might consider this to be setting the bar too low and they could well be correct. However, I think that there is also a good chance that consensus estimates are overly optimistic when it comes to Markets income.
Whilst external factors have certainly provided a tailwind, I think that BCS has done a good job at improving performance in its investment banking division. Some investors will remember that in the not-too-distant past there were well-publicised calls for the company to exit investment banking entirely. BCS’s decision to invest in the franchise via technological improvements and a broader client offer has proven sound.
Bad Debts – The Calm Before The Storm
Despite the fact that, generally speaking, banking net interest margins look set to benefit substantially from the higher interest rate environment, share prices across the sector have recently been under significant pressure. There are two key issues causing concern amongst investors. Firstly, loan book growth looks set to slow due to the negative effect of higher lending rates on credit demand – this is likely to be the case even if recessionary conditions are avoided. Secondly, an increased risk of economic recession in the UK, USA and Europe is driving expectations for higher bad debt (or impairment) charges.
The gloomy optics around bad debt charges are exaggerated by the fact that forecast bad debt charges are being compared against recent periods during which bad debt charges were exceptionally (and unsustainably) low. As depicted in Chart 5, in two of the last five quarters BCS has actually reported positive earnings in relation to bad debts (due to the write-back of provisions), and in the three quarters where bad debt costs were incurred, the loan loss rates were extremely low. To provide some context, the 1Q22 loan loss rate of 15bp can be compared against my normalized loan loss rate assumption of ~62bp.
Chart 5:
Source: Barclays 1Q22 Presentation, slide 16.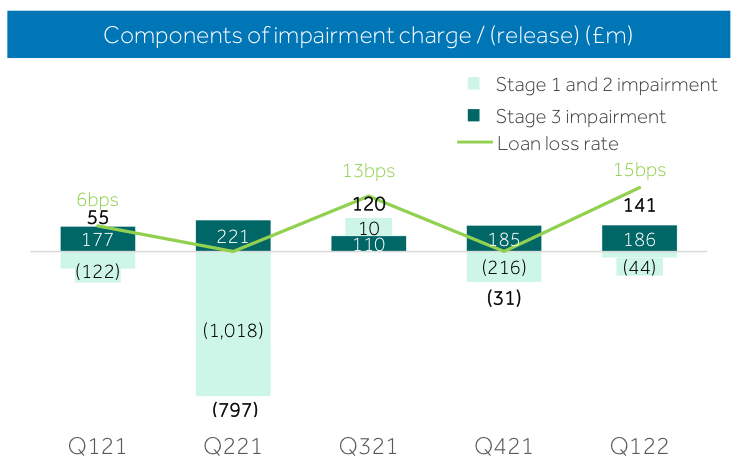
During bad debt cycles we typically see high loss rates from credit card books. Higher rates of card arrears are therefore worth paying attention to in terms of being early warning signs that bad debts are about to spike. As shown in Chart 6, BCS credit card arrears rates are not yet showing signs of borrower stress. However, my view is that the position will look considerably worse by 3Q22, as the combined impacts of inflationary pressures and higher interest rates feed through to borrowers.
BCS, consistent with many other banks, is currently holding high levels of bad debt provisions that were built up during the Covid-19 crisis. If we look back six months, I think it is fair to say that the market was viewing bad debt provisions as being excessive, and thus supportive of future earnings and capital distributions. Today, it now seems more likely that the ‘excess’ Covid-19 bad debt provisions will serve as a buffer against the bad debts that are likely to emerge as a result of inflationary pressures working through economies. The 1Q22 guidance from BCS that bad debt charges in coming quarters are likely to remain below pre Covid-19 levels is highly likely to be accurate, but investors should be mindful of what happens to bad debt charges once the Covid-19 provisions have been burnt through.
The BCS valuation framework set out in my previous BCS Seeking Alpha note included an allowance for the release of excess Covid-19 bad debt provisions. Given the huge amount of uncertainty regarding how the current inflationary and geopolitical problems play out, I no longer allow for this positive adjustment in my fundamental valuations of BCS.
Chart 6:
Source: Barclays 1Q22 Presentation, slide 16.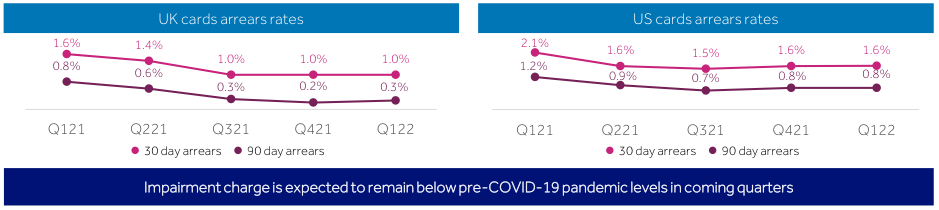
Buyback Underway – Structured Product Debacle Addressed
BCS announced a £1bn share buyback with its FY21 result, however following the 28 March 2022 announcement regarding over-issuance of structured products and exchange traded notes in the US (covered in my April 2022 BCS note), the commencement of the buyback was delayed to allow for internal and regulatory reviews to be conducted. After conclusion of discussions with the SEC, BCS fired up the buyback on 24 May 2022. Up until 07 July 2022, BCS had repurchased ~320m shares at an average price of £1.6045 per share.
The cost of the structured products error is substantial, with BCS holding a provision as at 1Q22 of £540m. As CEO Venkat has noted, the situation was disappointing and avoidable. An external review of the matter has been commissioned, with oversight from the board – it will investigate what happened, how it could have happened, and where accountability lies. For valuation purposes, I have made an allowance for an additional £750m (before tax) of costs associated with the structured products error and associated reviews. This valuation allowance may actually be slightly heavy given the comment below made by the CEO in the 1Q22 management speech, however I would rather be too cautious on this item than too optimistic.
“To date, we have not found any evidence of intentional misconduct. Having reviewed all our other issuance programmes, we note they are all within applicable limits.”
Source: Barclays 1Q22 Management Speech, page 2.
Updated Valuation Analysis
For valuation purposes, I generally rely upon an assessment of normalized earnings. Essentially, my goal is to arrive at a point-in-time estimate of how I expect a company to perform on a through-the-cycle or sustainable earnings basis.
Note that my valuation now no longer makes allowance for the release of excess bad debt provisions. In effect, I am assuming that these Covid-19 related provisions will be ‘recycled’ and used to cover bad debt issues relating to the current inflation/cost-of-living crisis. As mentioned above, I have allowed for a further loss associated with the structured product problems in the investment banking division of -£563m after tax. I then use this adjusted market capitalisation measure to arrive at a normalized P/E ratio.
Table 1:
Source: Author’s calculations based on Barclays financial reports.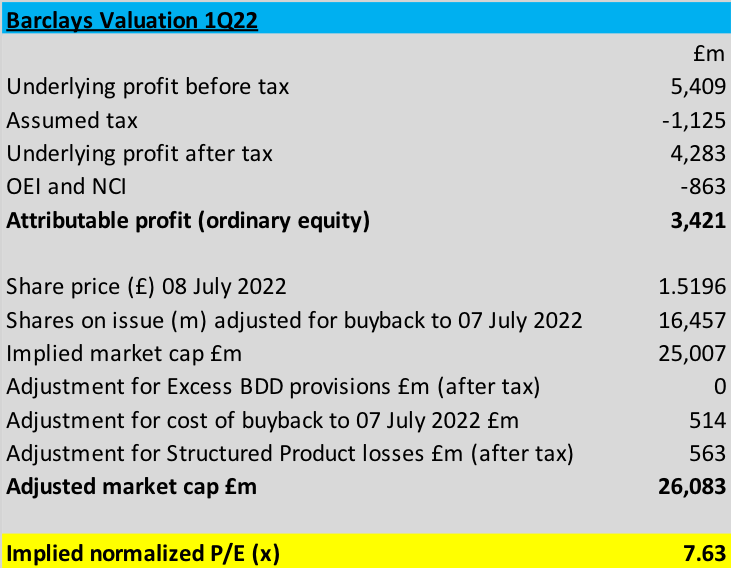
Summary & Conclusion
Based on the 08 July 2022 London Stock Exchange closing price of £1.5196, my conservatively set valuation framework points to a normalized P/E of around 7.6x. With further potential earnings upside from leverage to higher interest rates, and a healthy level of bad debt provisions already in place, I am happy to give Barclays a rating of STRONG BUY. The bank is currently trading at around 52% of 1Q22 reported NTA – this metric also points to Barclays offering strong valuation appeal.
Income-focussed investors will find BCS an attractive proposition. The company paid out a total dividend of 6p per share for FY21. BCS has a stated capital returns policy that incorporates a progressive ordinary dividend (supplemented with share buybacks), and so we can anticipate higher dividends in FY22E. The most recently published analyst consensus from BCS shows FY22E forecast dividends per share at 8.1p (increasing to 9.4p in FY23E and 10.1p in FY24E). Using an assumed forward dividend of 8.1p per share, the current BCS share price implies a dividend yield of ~5.3%, with genuine potential for further dividend upside in FY23E.
Be the first to comment