

Petr Vdovkin
Continued monetary tightening is causing significant volatility in markets. The dramatic increase in short end rates is presenting both a challenge and opportunity. On one hand, higher risk-free rates result in higher discount rates that negatively impact risk asset valuations and cause the price of shares and bonds to decline. On the other hand, higher risk-free rates offer an attractive place to put cash to work.
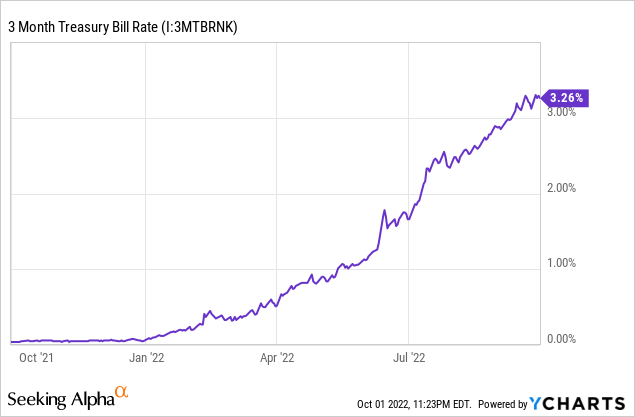
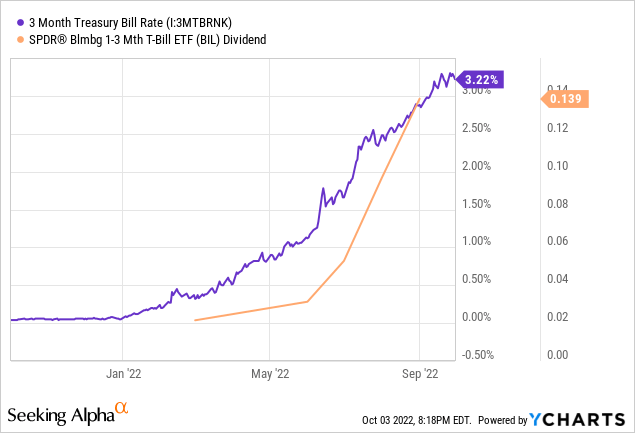
During the September FOMC meeting the Federal Reserve again raised the Fed Funds Rate by 75 basis points to 3-3.25%. Chairman Jerome Powell reiterated the Fed’s policy stance to reduce inflation. As a result, the yield on 3 month Treasury Bills has climbed to 3.26% and the Fed Funds Futures expects an EFFR of 4-4.5% by the end of the year. In addition, the median expectation of the FOMC is an EFFR greater than 4.5% by the end of the 2023.
Typically, T-bills are a minor component of my portfolio. This is because two conditions need to be satisfied to justify the risk-adjusted returns of Treasury Bills and usually one or both of these conditions are not satisfied:
- Real yields are positive
- Opportunity cost is low
In some circumstances the latter condition can outweigh the former. That was certainly the case for the first half of 2022. For the next quarter or two it appears that both conditions will be met. This is why I hold a sizeable position in the SPDR Bloomberg Barclays 1-3 Month T-Bill ETF (NYSEARCA:BIL).
Positive Real Yields Are Possible
We must begin with an important clarification: It is disingenuous to compare bond rates with the YoY CPI inflation rate and conclude that real yields are negative.
This is because the CPI inflation rate measures past inflation and bond rates are a reflection of future yield. It is improper to exclusively compare metrics of different timeframes. We should also compare rates with inflation expectations since we do not know what inflation will be in the future.
First, we can look more closely at the CPI data by comparing the MoM inflation to rates. MoM is still past inflation, however, it helps us understand the trend of inflation. The chart below shows that the CPI has recorded YoY inflation of 8.26% in August. However, YoY inflation has been over 8% since March. Month over month inflation in July was -0.02% and in August it was 0.12%. These two months are annualized at just 1.2% inflation.
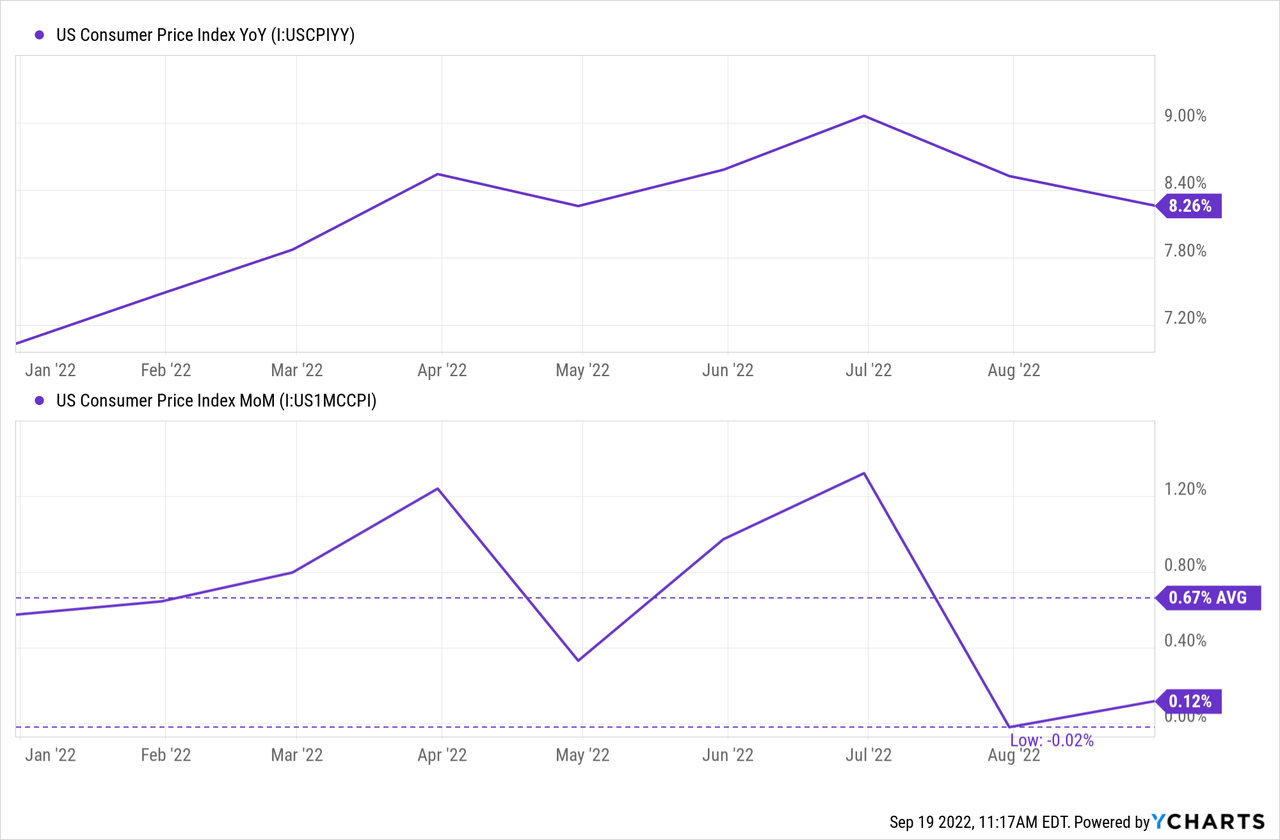
This tells us that the trend in inflation may be declining. It also tells us that the real yield on the 3-month Treasury has been positive because the bill has yielded more than 1.6% since July which is higher than the annualized inflation rate during that period.
To get a sense of real yields moving forward we need to determine where nominal yields are going and where inflation is going. It is easier to project the direction of nominal yields because the Fed is telling us where they plan to take them. Futures markets expect a much higher EFFR by the end of the year. The market now expects a 48% probability of 125 basis points increase by the December FOMC meeting.
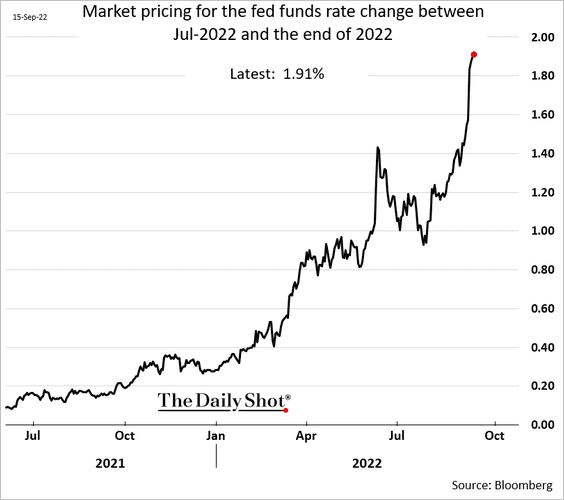
The Daily Shot (used with permission)
The Implied Fed Funds Target Rate “dot plot” is leading these expectations higher. The median expectation of the FOMC is that the EFFR will exceed 4.5% by the end of 2023. A higher Fed Funds rate will pull the 3-month Treasury higher with it.
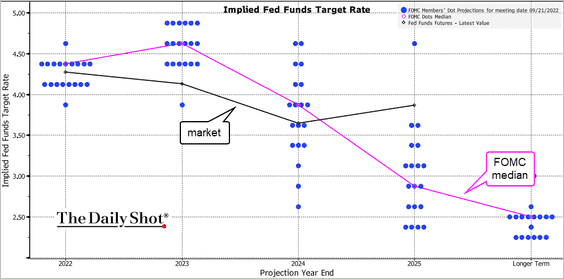
The Daily Shot (used with permission)
Two Reasons Inflation Will Stall
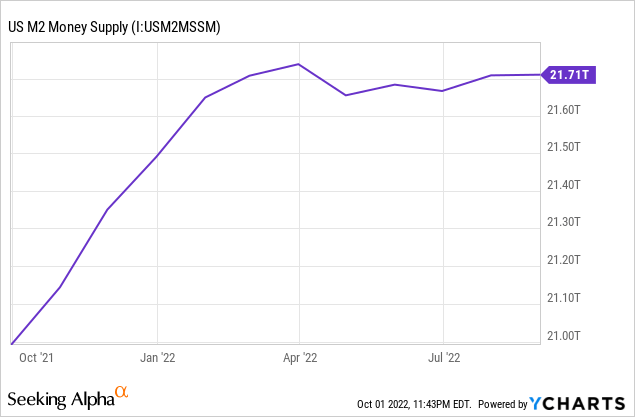
The recent slowdown in inflation was forecasted by the change in M2 money supply, with an 18-month lead. The chart below shows how changes in M2 relate to changes in the Producer Price Index. M2 money supply growth is suggesting that inflation is due to slow significantly over the coming 12 months.
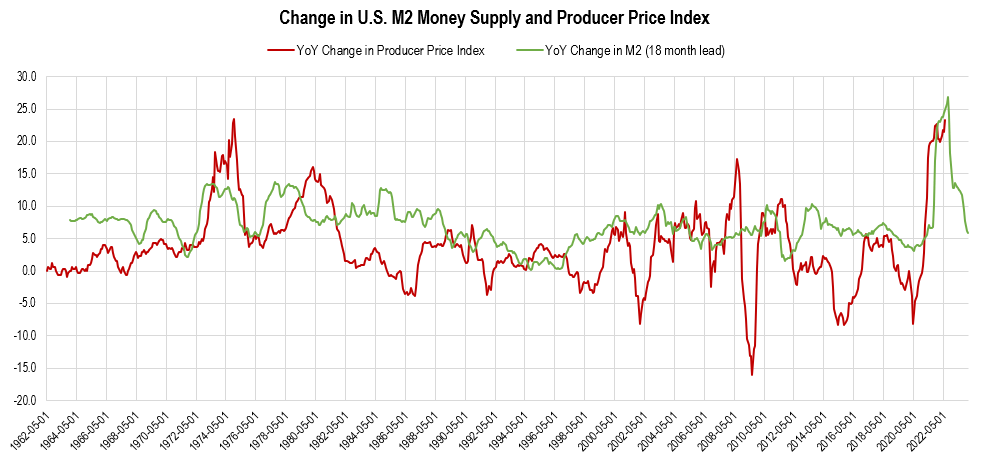
Chart by author (data from Federal Reserve Economic Data | FRED | St. Louis Fed)
M2 money supply has essentially been flat since April. This is a primary reason why I expect disinflation over the next few quarters.
This deceleration in money supply is going to have a compounded effect on inflation as the influence from base effects weakens. Inflation rates, as measured by the Core CPI in the chart below, were relatively muted in 2021 until later in the year. January, February, and March of 2021 were all below 1.5%. This low base effect was conducive for high YoY inflation rates in 2022. Looking forward to 2023, in order to maintain YoY inflation rates in the 7-9% range prices would need to continue rising at the same rate they were in 2021. But the rate is slowing and by March of 2023 we will be comparing YoY inflation against high levels of inflation from 2022.
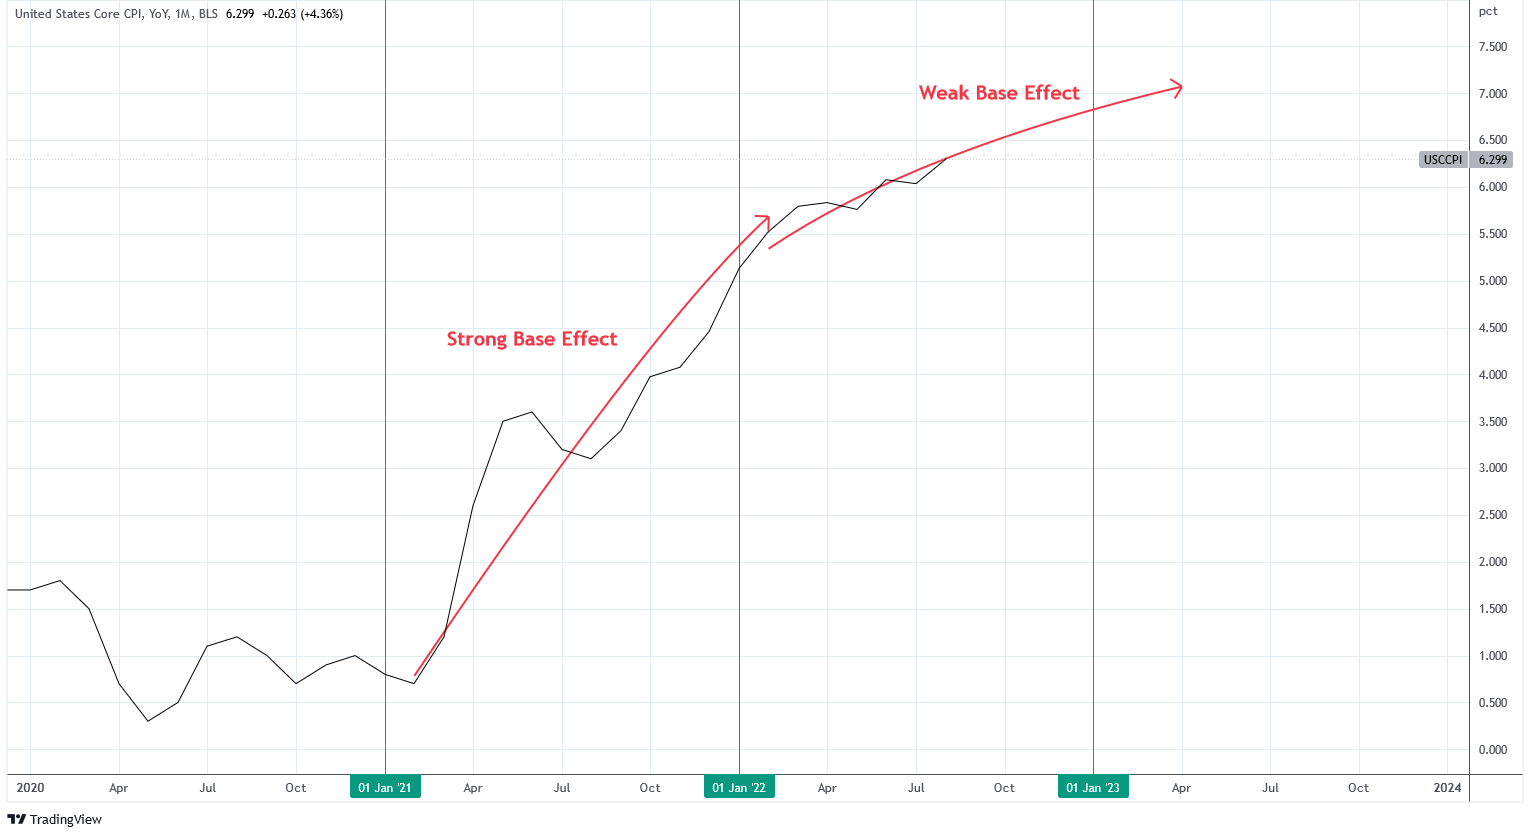
Charts by TradingView (adapted by author)
Two Reasons Inflation Will Persist
The Fed is strongly trying to avoid inflation from increasing wages which is “sticky” because it is difficult to reverse. Generally, increases to wages lead to further inflation in consumer prices which further pressures wages higher. The Fed must reduce prices of consumer goods and services to prevent wages from rising.
The first reason why it will be difficult for the Fed to accomplish this objective is that housing is slow to change and changes in housing inflation is lagging. The method for calculating rent in the CPI lags 6-9 months behind changes in market rent. Market rent lags behind changes in home prices by 12-18 months. The chart below shows how the recent increase in the Case Shiller Home Price Index has led CPI and CPI rent by 12 months. Home prices have only recently begun to peak and fall. Since June, home prices have declined 2% which is the fastest pace since 2009.
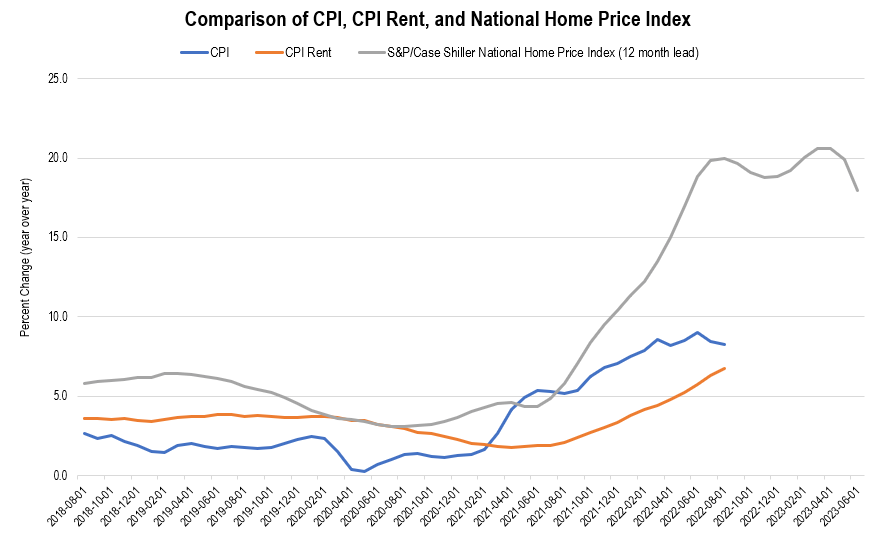
Chart by author (data from Federal Reserve Economic Data | FRED | St. Louis Fed)
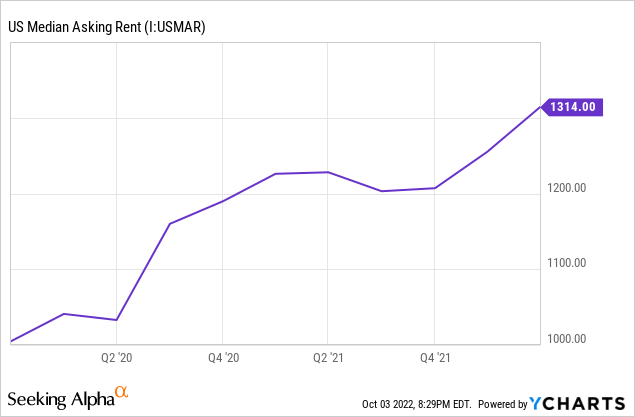
Research from the Dallas Fed demonstrates that it can take up to a year and a half after market rents begin to decline for the change to be reflected in the CPI. This is not good news for the Fed because rents have only begun to slow down with asking rents falling by 0.1% in July.
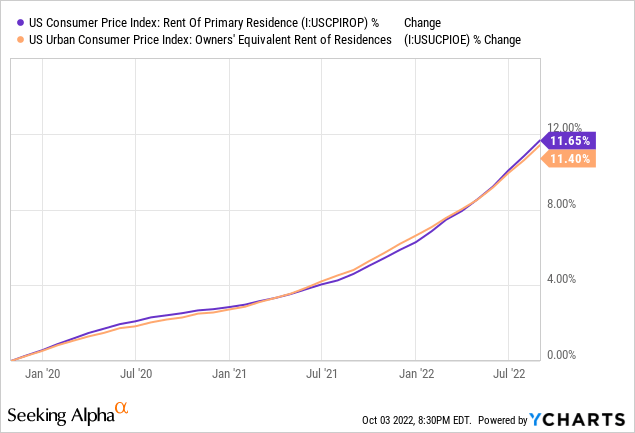
This implies that the CPI components of rent of primary residence and owner’s equivalent rent are not due to decline until Q2 or Q3 of 2023. Both components are reading above 11% YoY inflation now. These two metrics account for approximately 40% of the Core CPI.
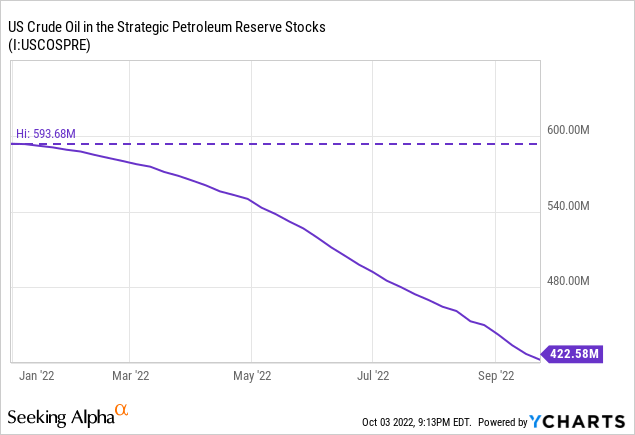
Energy prices have been a tailwind for disinflation over the last quarter. U.S. WTI Crude has fallen from $123 a barrel in June to $83 today. This decline has been aided by the reduction in the U.S. Strategic Petroleum Reserve. Since the beginning of the year the SPR has declined from 593.68 million barrels to 434.06 million barrels today. This release is equivalent to approximately 7.8 days of U.S. oil consumption according to 2022 estimates. This contribution is relatively minor but SPR stocks have already declined by 25% in 2022 and additional releases are becoming more difficult.
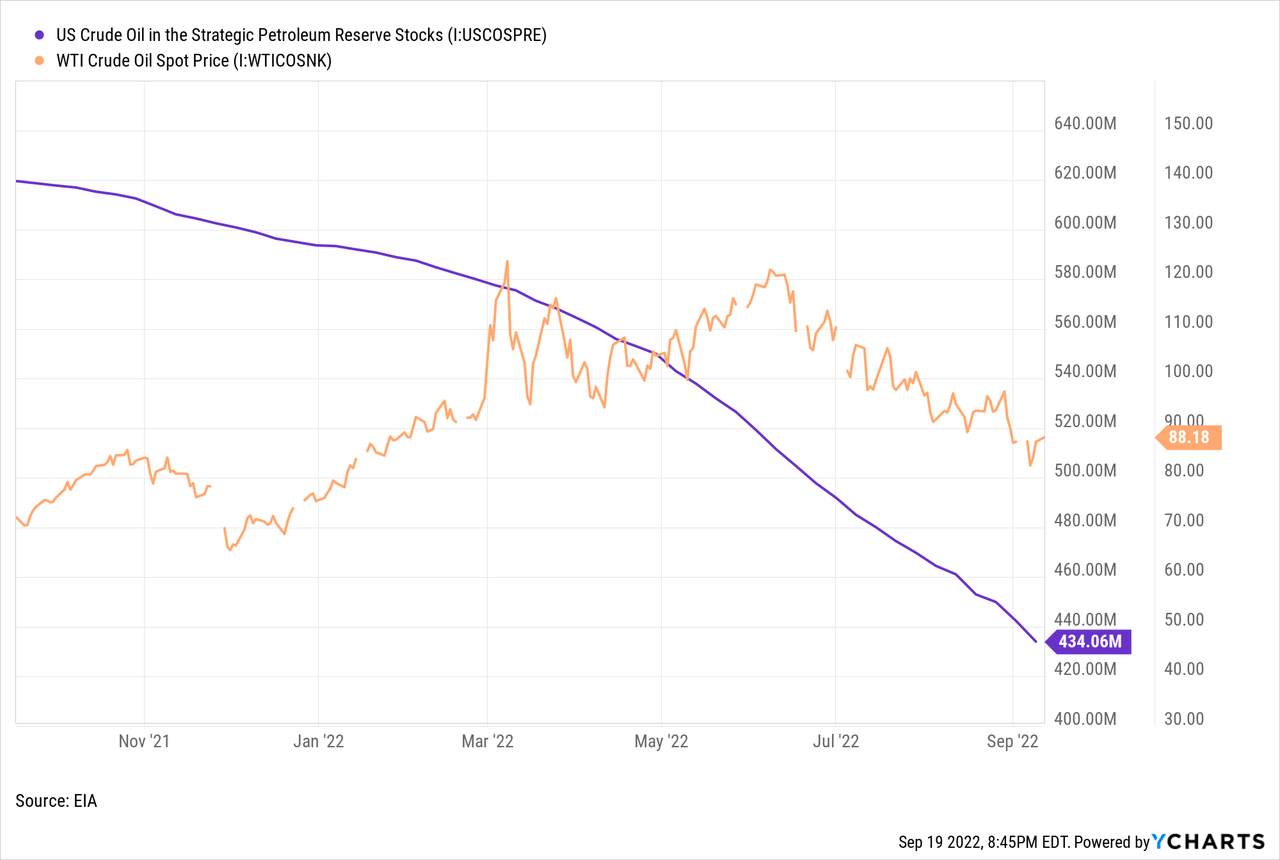
Crude oil weakness is better explained by the degrading economic conditions as represented by the Chicago PMI. But the delay in oil weakness in response to these conditions illustrates the tight supply and demand fundamentals in the energy space. This suggests that the oil price may remain relatively buoyant this winter if SPR releases diminish and major economies of Europe have to switch production of electricity from natural gas to oil.
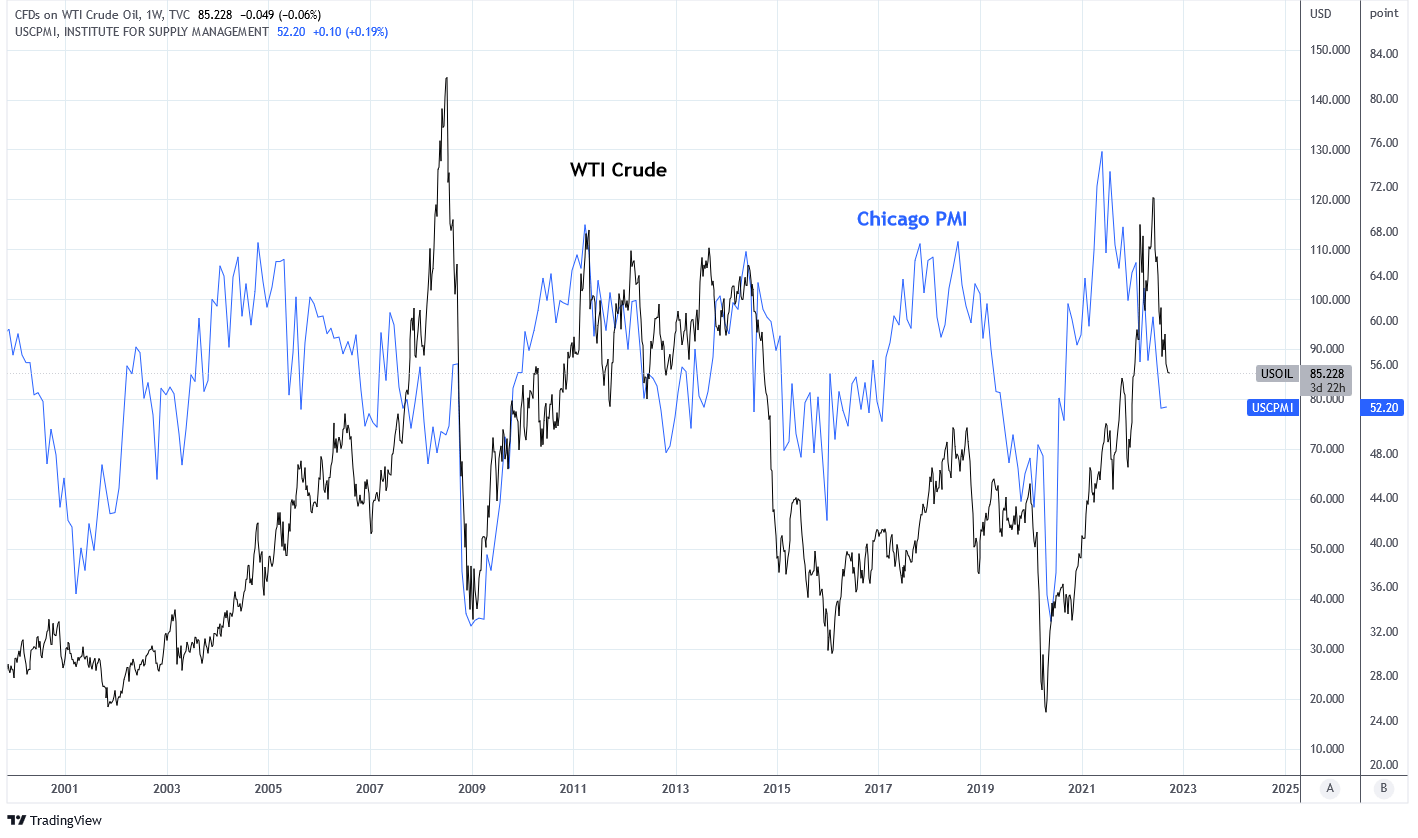
Charts by TradingView (adapted by author)
Two Reasons The Fed Won’t Pivot
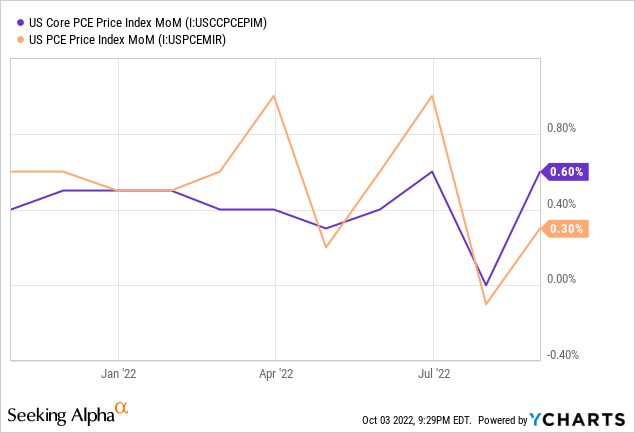
It feels like the market is on pins and needles waiting for the Fed to pivot its tighter monetary stance. I’m not holding my breath. For one, the Fed tends to prefer the PCE over CPI as an indicator of inflation. Recent PCE data is not suggesting lower inflation, yet. Last Friday the August PCE data showed that PCE increased 0.3% MoM while Core PCE increased 0.6% MoM.
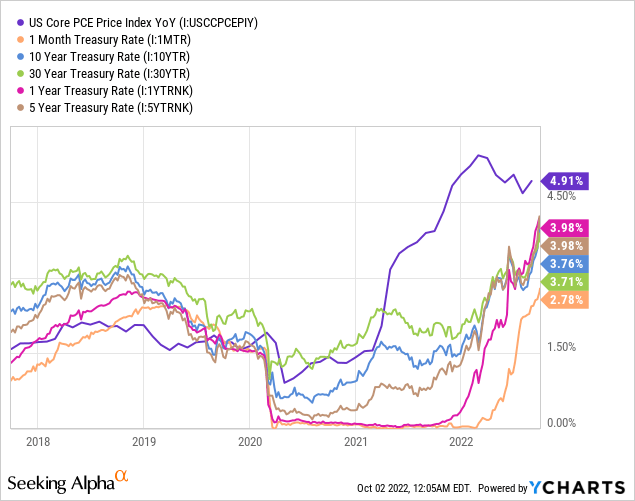
History suggests that Treasury rates generally track around Core PCE. Rates have been playing catch up to Core PCE since the middle of 2021. It is probable that rates will need to continue higher until they reach, and likely surpass, Core PCE before a policy change.
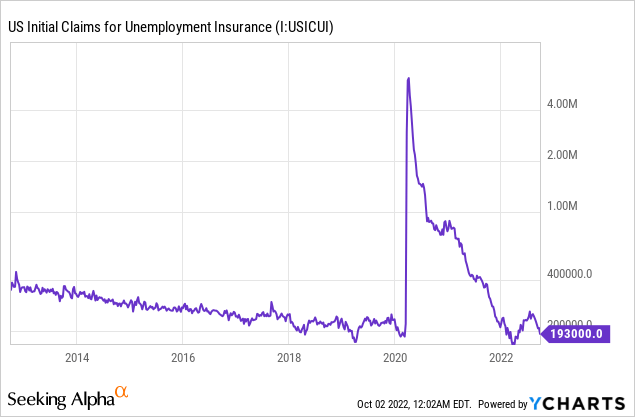
Another reason the Fed is unlikely to pivot so soon is that employment data remains strong on the surface. Initial jobless claims have been trending lower over the past few weeks and remain subdued. The Fed will be looking for weaker employment data to feel confident that sticky wage inflation can be avoided.
Marginal Opportunity Cost
At the September FOMC meeting, Chair Jerome Powell had choice words to say about the direction of monetary policy. The following are some of the remarks that Powell made during the September 21 Press Conference, I have added the bold for emphasis:
My colleagues and I are strongly committed to bringing inflation back down to our 2 percent goal…
…we have got to get inflation behind us. I wish there were a painless way to do that, there isn’t. So, what we need to do is get rates up to the point where we’re putting meaningful downward pressure on inflation, and that’s what we’re doing.
We have to get supply and demand back into alignment and the way we do that is by slowing the economy. Hopefully we do that by slowing the economy and we see some softening of labor market conditions…
…the path that we actually execute will be enough. It will be enough to restore price stability.
…my main message has not changed at all since Jackson Hole.
…I don’t know what the odds are [of recession in the U.S.].
I cannot remember the last time that a Fed official stated they were unsure if a recession was going to unfold. That’s about as close to “Yes, there’s a recession” as you can get from an FOMC member. Powell continued to talk about economic pain.
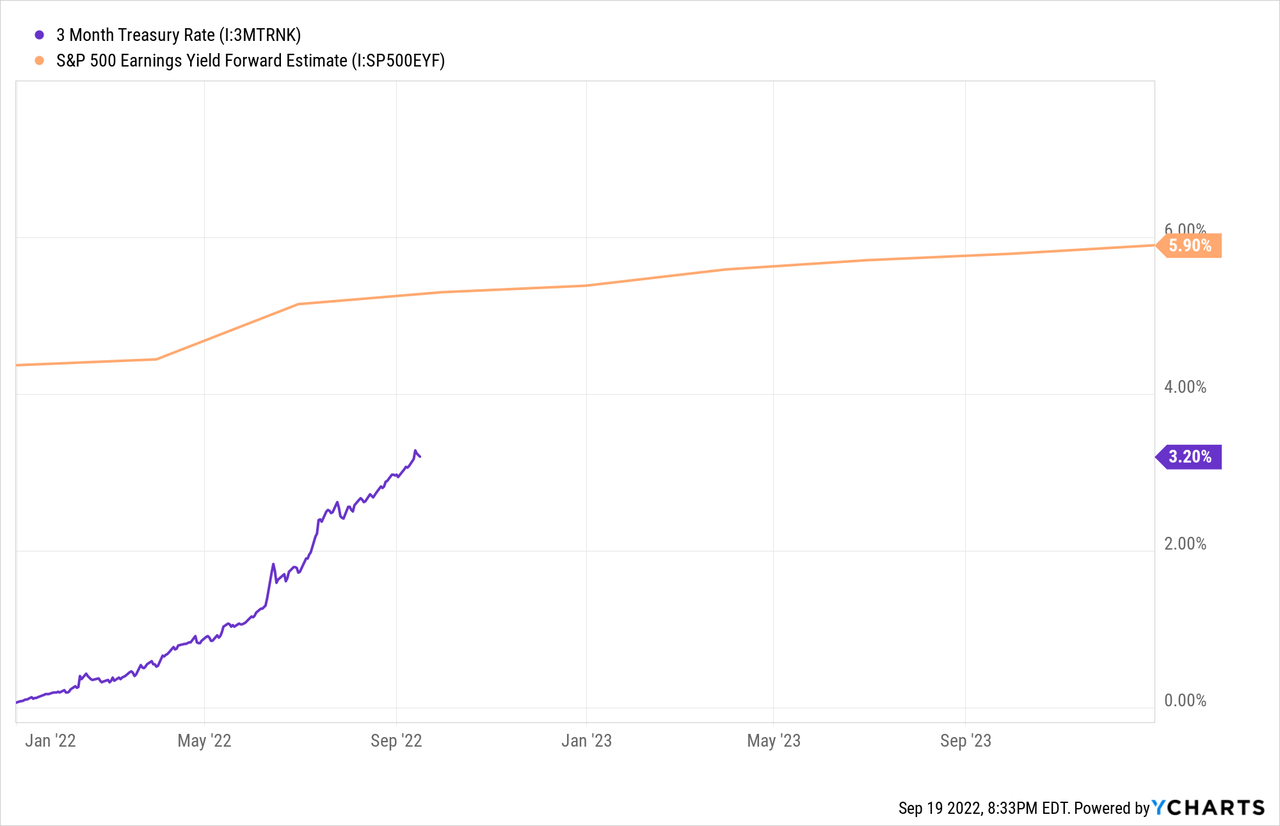
These conditions are not favorable for risk assets including equities and real estate. Setting aside the fact I think earnings estimates are too generous and that earnings growth is likely to be negative heading into 2023, Treasury rates are quickly closing the gap on earnings estimates. Notice in the chart below how the 3-month Treasury Bill rate at 3.2% is quickly approaching next year’s S&P 500 earnings yield estimate of 5.9%. Higher risk-free rates are a primary cause of declines to equity valuations this year and that trend is set to continue.
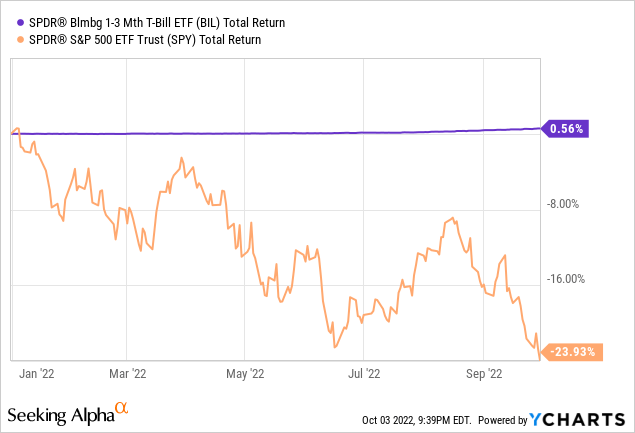
The YTD total return on BIL is a meager 0.56% but that looks tremendously more attractive than the -23.93% experienced by the S&P 500. If this trend continues, I’ll take the former.
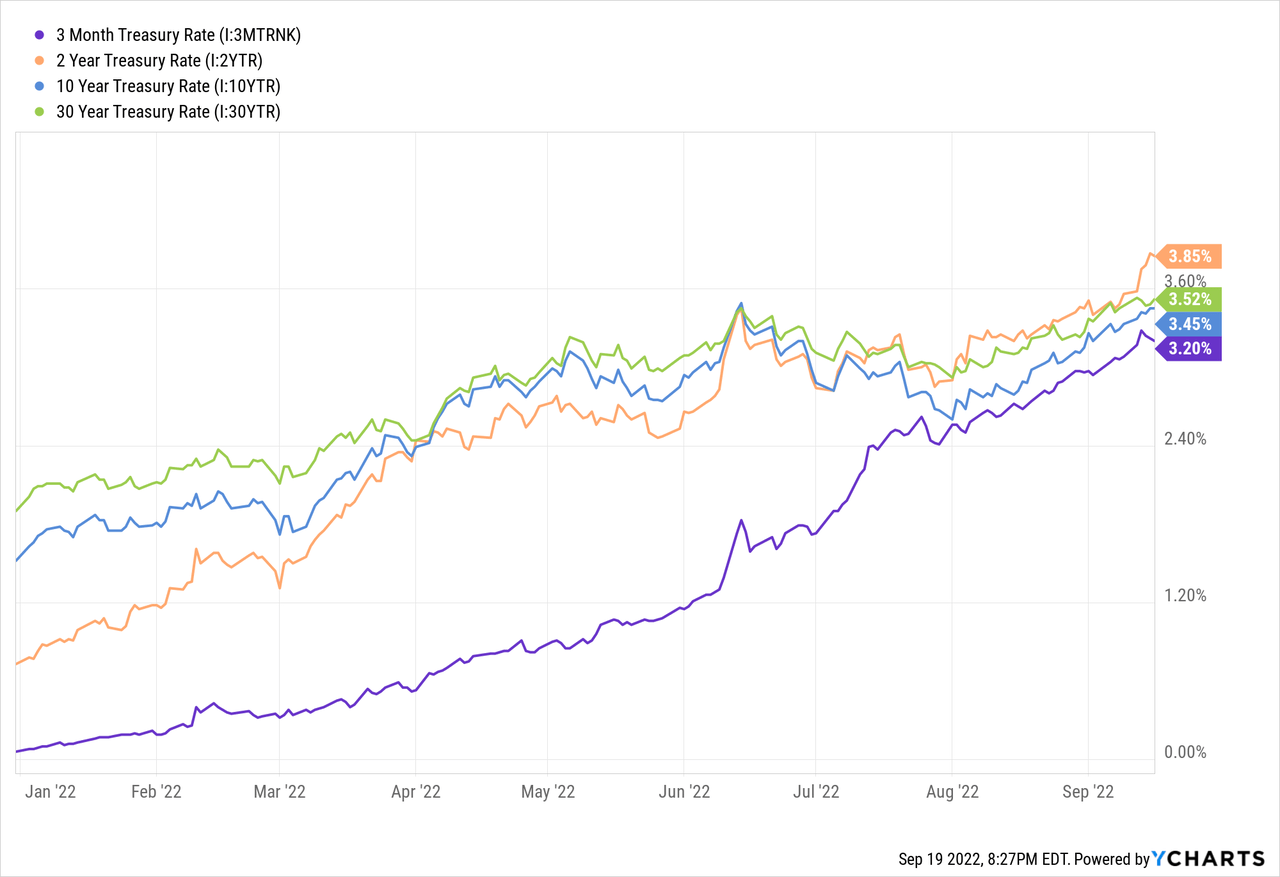
Compared to other Treasury Bonds, Treasury Bills are offering nearly the same yield for far less risk. If rates continue to move higher it will cause long duration bonds to take losses to principle. Under these monetary policy conditions the risk-reward favors bills. That is why BIL had the second highest ETF inflow of funds last week.
Comparing BIL and SGOV
Both the SPDR Bloomberg Barclays 1-3 Month T-Bill ETF (BIL) and iShares 0-3 Month Treasury Bond ETF (SGOV) invest in Treasury Bills. Both funds are suitable for T-bill exposure and the differences between them are slight.
This is the description of the BIL fund from SPDR’s website:
The Bloomberg 1-3 Month U.S. Treasury Bill Index (the “Index”) is designed to measure the performance of public obligations of the U.S. Treasury that have a remaining maturity of greater than or equal to 1 month and less than 3 months. The Index includes all publicly issued zero coupon U.S. Treasury Bills that have a remaining maturity of less than 3 months and at least 1 month, are rated investment-grade, and have $300 million or more of outstanding face value.
Below is a chart that compares metrics from both funds, according to the funds’ websites when the data was retrieved on 10/3/2022. The important difference is that BIL has a superior average yield to maturity and shorter average maturity. I think this is important because if rates continue to rise the fund with the shorter average term will be able to rollover assets into higher yielding bills sooner. For these reasons I prefer BIL over SGOV but I own both.
| SGOV | BIL | |
| Average Yield to Maturity | 2.35% | 2.7% |
| Weighted Average Maturity | 0.12 | 0.08 |
| 12-month Trailing Yield | 0.46% | 0.35% |
| 30-day SEC Yield | 2.35% | 2.37% |
| Expense Ratio | 0.05%* | 0.136% |
| AUM | $3.24B | $24.2B |
| SA Quant Rating | 4.82 | 4.73 |
*Management fees waived until June 2023, 0.12% expense ratio thereafter
Each fund distributes a monthly dividend derived from the yield earned on portfolio assets. By its nature, the yield of these funds lag behind the market rate of T-bills as older assets take time to mature. It also means that the yield can increase or decrease from month to month depending on the schedule of maturities.
The result is that the dividend yield is usually 1-2 months behind market rates. BIL just issued the September dividend which was $0.155 per share equal to 2.03% annualized. Because market rates have continued to rise, I expect the dividend yield on BIL to reach 3% by the end of the year.
Summary
Volatility in bond and equity markets is set to continue if interest rates continue to rise. That is entirely dependent on what inflation does. While signs of disinflation are growing, there are still issues with sticky inflation in wages and rent.
Higher rates benefit Treasury Bills and funds like BIL and SGOV. The asset class performs best when real rates are positive and the opportunity cost of alternative investments is low. I believe that the current macro environment is challenging from an investment and monetary policy standpoint. Those challenges are driving opportunity costs lower while real rates have a chance to be positive while the Fed deals with stubborn inflation.
There will be great opportunities to invest in risk assets when rates have finished climbing. Rates may have already peaked, but I doubt it. That is why I’m keeping my powder dry in BIL and SGOV which provide the liquidity needed to take advantage of those opportunities.
Be the first to comment