

RiverNorthPhotography
Introduction
Seeking Alpha’s recent headline about Bank of New York Mellon (NYSE:BK) reads: “Bank of New York Mellon Non-GAAP EPS of $1.21 beats by $0.13, revenue of $4.28B beats by $80M“, but sometimes quarterly earnings beats are not really “beats”. In this article, I will share my valuation process for Bank of New York Mellon, which shows that BK stock looks like a good value for investors. Then I will explain why, in my view, it’s not. I will also share the bank stock I swapped Bank of New York Mellon for in the fall of 2020, and why I think it’s a better long-term value for shareholders right now.
By most accounts an earnings beat in excess of 10%, as BK just reported, is considered a positive by the financial media. But what one should consider is that “beat” was compared to what analysts thought the business might earn a week or two before earnings, when what really matters is what analysts thought earnings would be 12-24 months ago. You see, fundamental analysis, like those based on earnings, doesn’t work well when it comes to predicting short-term movements in the stock price. But fundamental analysis does have a strong correlation with the stock price the farther out into the future one can accurately project earnings. For this reason, in order for earnings projections to be useful for a medium or long-term investor, they really need to stretch, at a minimum, about 24 months into the future. So, what really matters is not whether a company beat earnings expectations made a few weeks or months ago, but whether they beat expectations made a year or two ago.
Fortunately, since I wrote an article about selling BK two years ago, I can go back and examine what analysts were expecting for 2022’s earnings back then. Below is a FAST Graph from my article published on 9/23/20. Pay special attention to what analysts’ expected 2022 EPS was at the time.
FAST Graphs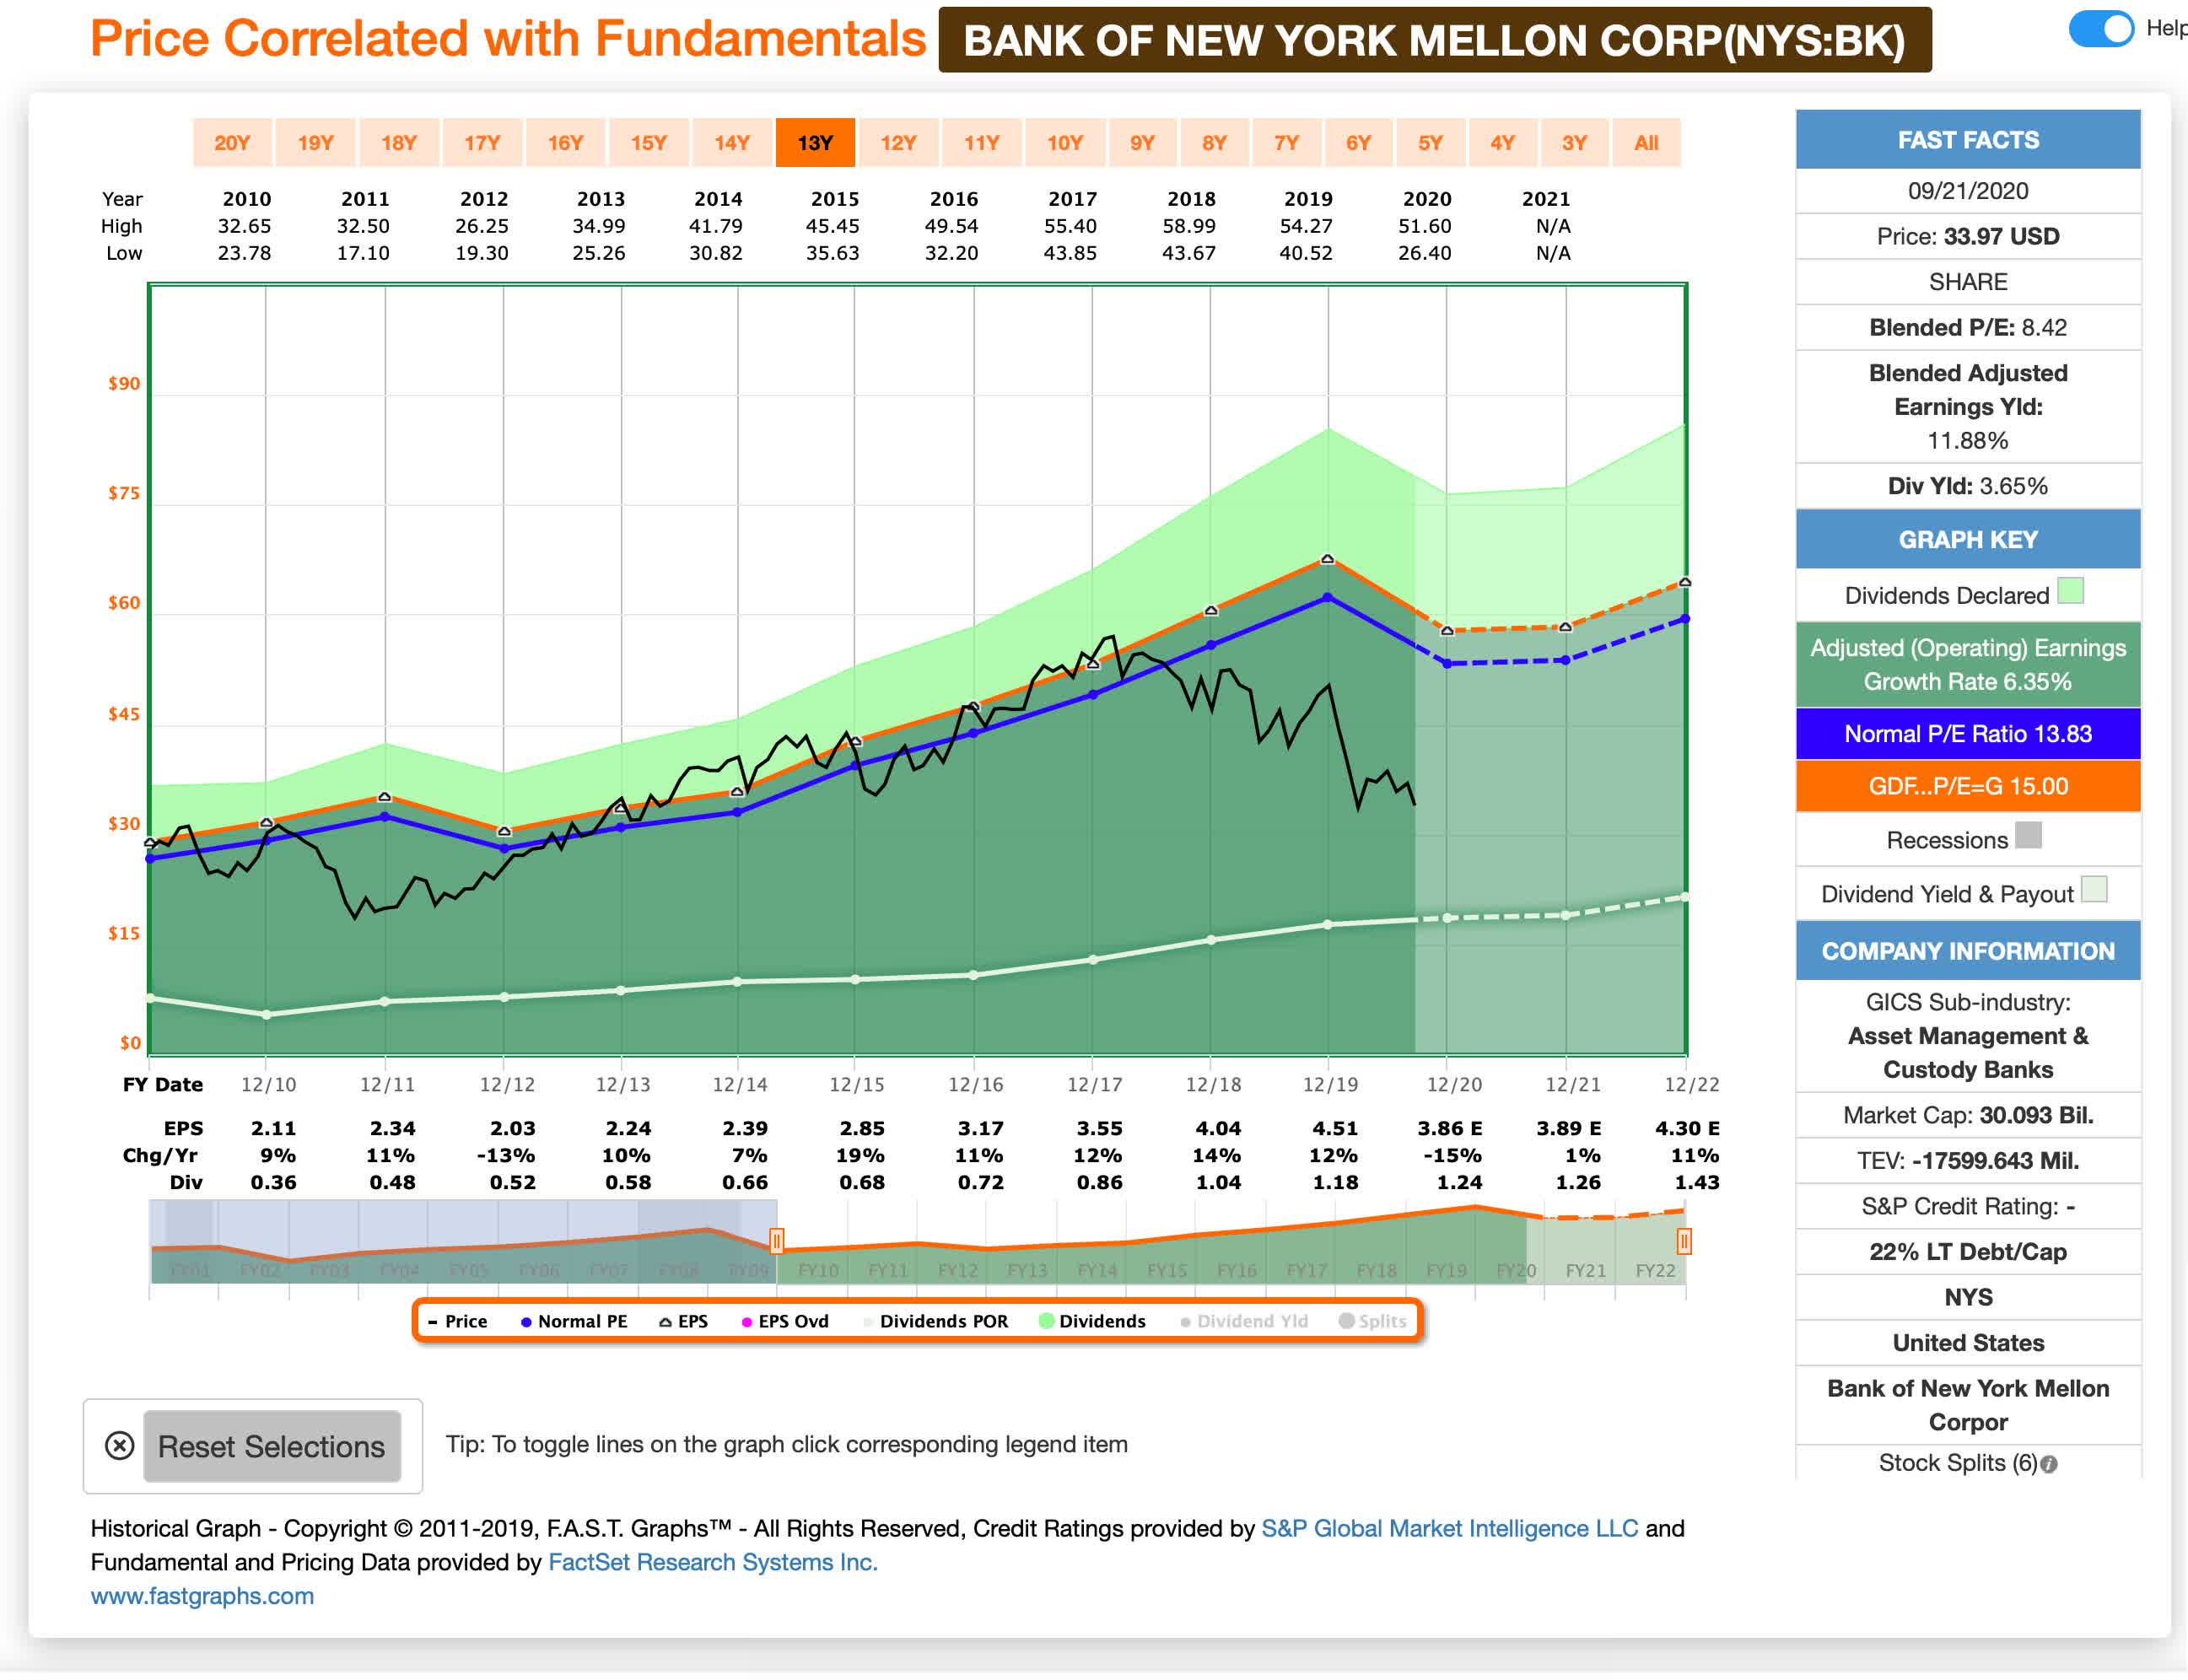
Two years ago, analysts expected BK to earn $4.30 per share in 2022. Now that we are 3 quarters into 2022 let’s look at a more recent expectation.
FAST Graphs
This year BK is expected to earn $3.43 per share compared to the $4.30 per share analysts expected them to earn in 2022 two years ago. So, was this current quarter really an earnings “beat”? I don’t think so. Earnings are -20% lower than expected so far this year. So earnings this year have been a huge miss in my view.
But, just because earnings are lower than expected doesn’t necessarily mean Bank of New York Mellon stock isn’t a good value. The stock price has potentially fallen enough to make up for lackluster earnings this year. So, next, I will take BK through my valuation process to see what the numbers look like at today’s price.
My Basic Valuation Method For Bank of New York Mellon
The valuation method I use for BK first checks to see how cyclical earnings have been historically. Once it is determined that earnings aren’t too cyclical, then I use a combination of earnings, earnings growth, and P/E mean reversion to estimate future returns based on previous earnings growth and sentiment patterns. I take those expectations and apply them 10 years into the future, and then convert the results into an expected CAGR percentage. If the expected return is really good, I will buy the stock, and if it’s really low, I will often sell the stock. In this article, I will take readers through each step of this process.
Importantly, once it is established that a business has a long history of relatively stable and predictable earnings growth, it doesn’t really matter to me what the business does. If it consistently makes more money over the course of each economic cycle, that’s what I care about – numbers over stories.
FAST Graphs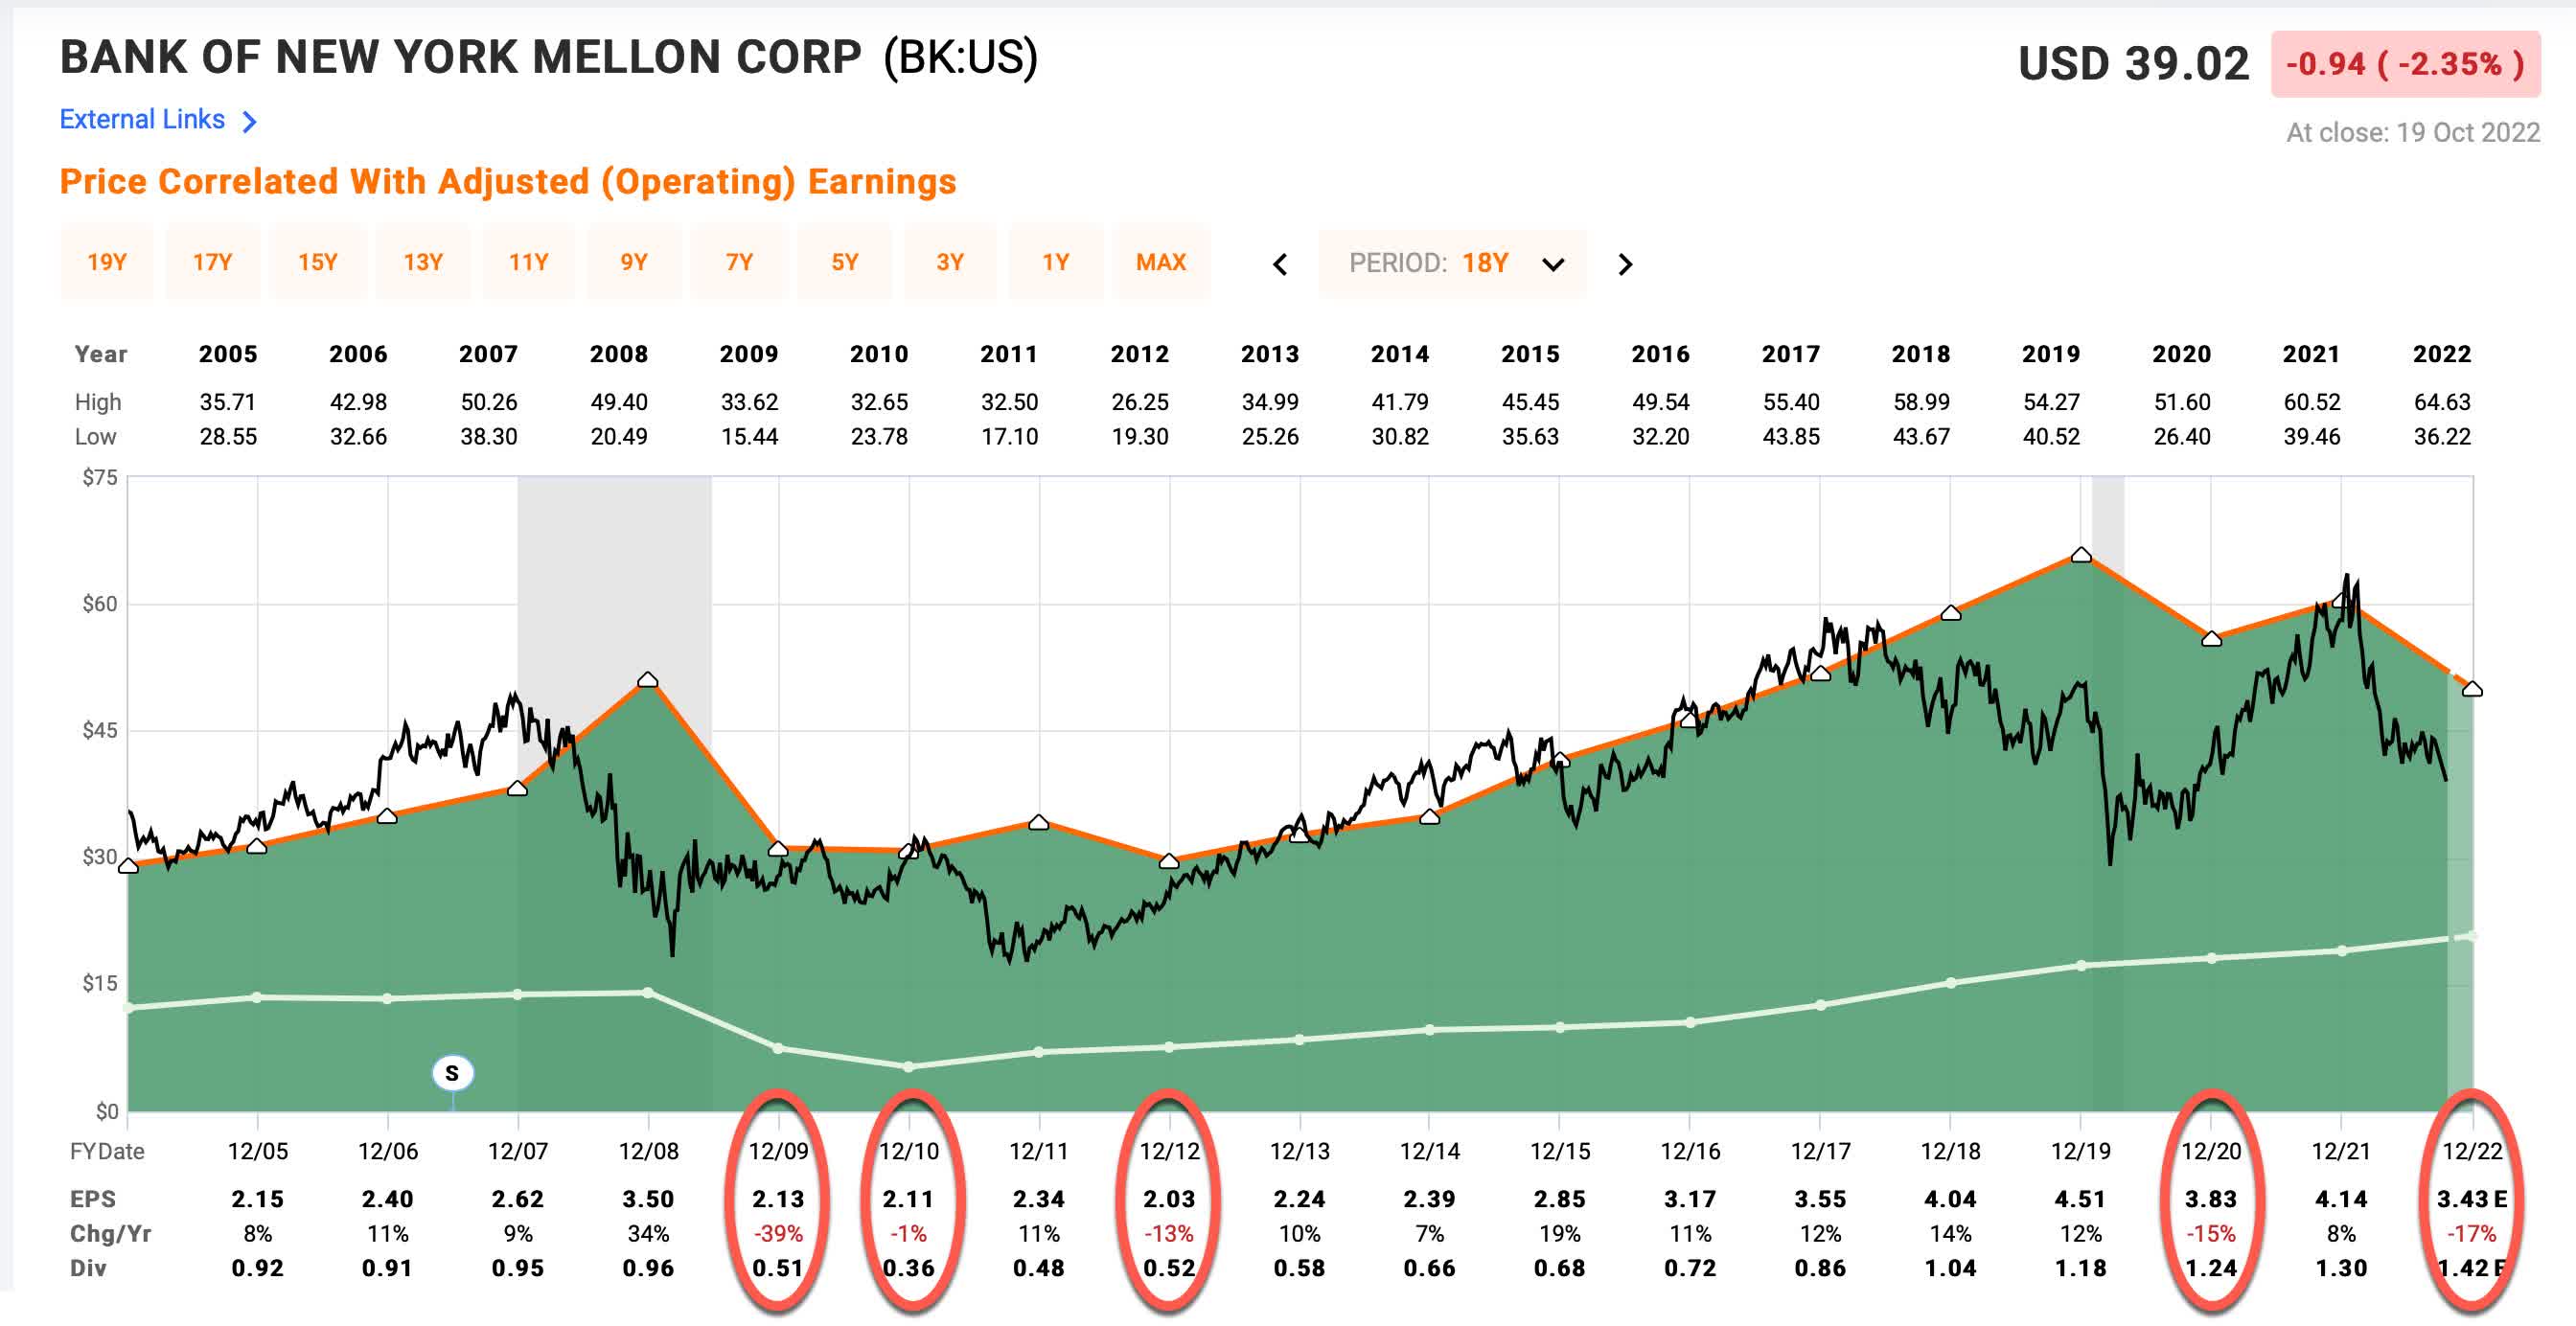
Since 2005, BK has experienced 5 years in which EPS was lower than the previous year. The worst two years were 2008 and 2009 in which EPS declined about -40% from 2007 levels. Before I go on here, I want to take a moment to point out that I understand that are differences between different types of banks and what they do. There are asset management and custody banks like BK, regional banks like U.S. Bancorp (USB), and banks involved in investment banking like JPMorgan (JPM). Except for in rare circumstances, I don’t really care what these banks do and the differences between them. What I care about is how cyclical their earnings are, and how fast or slow they are growing earnings relative to their current price. If I examine their historical earnings patterns and I see that in the past their EPS has experienced declines in excess of -50% as USB and JPM have, then I use a different type of analysis than if I see an earnings history that is less cyclical, like BK’s is. Because BK’s earnings history is only moderately cyclical, it is appropriate to use a business fundamentals-based analysis for the stock. Which is what I will do in this article.
Market Sentiment Return Expectations
In order to estimate what sort of returns we might expect over the next 10 years, let’s begin by examining what return we could expect 10 years from now if the P/E multiple were to revert to its mean from the previous economic cycle. For this, I’m using a period that runs from 2013-2022.
FAST Graphs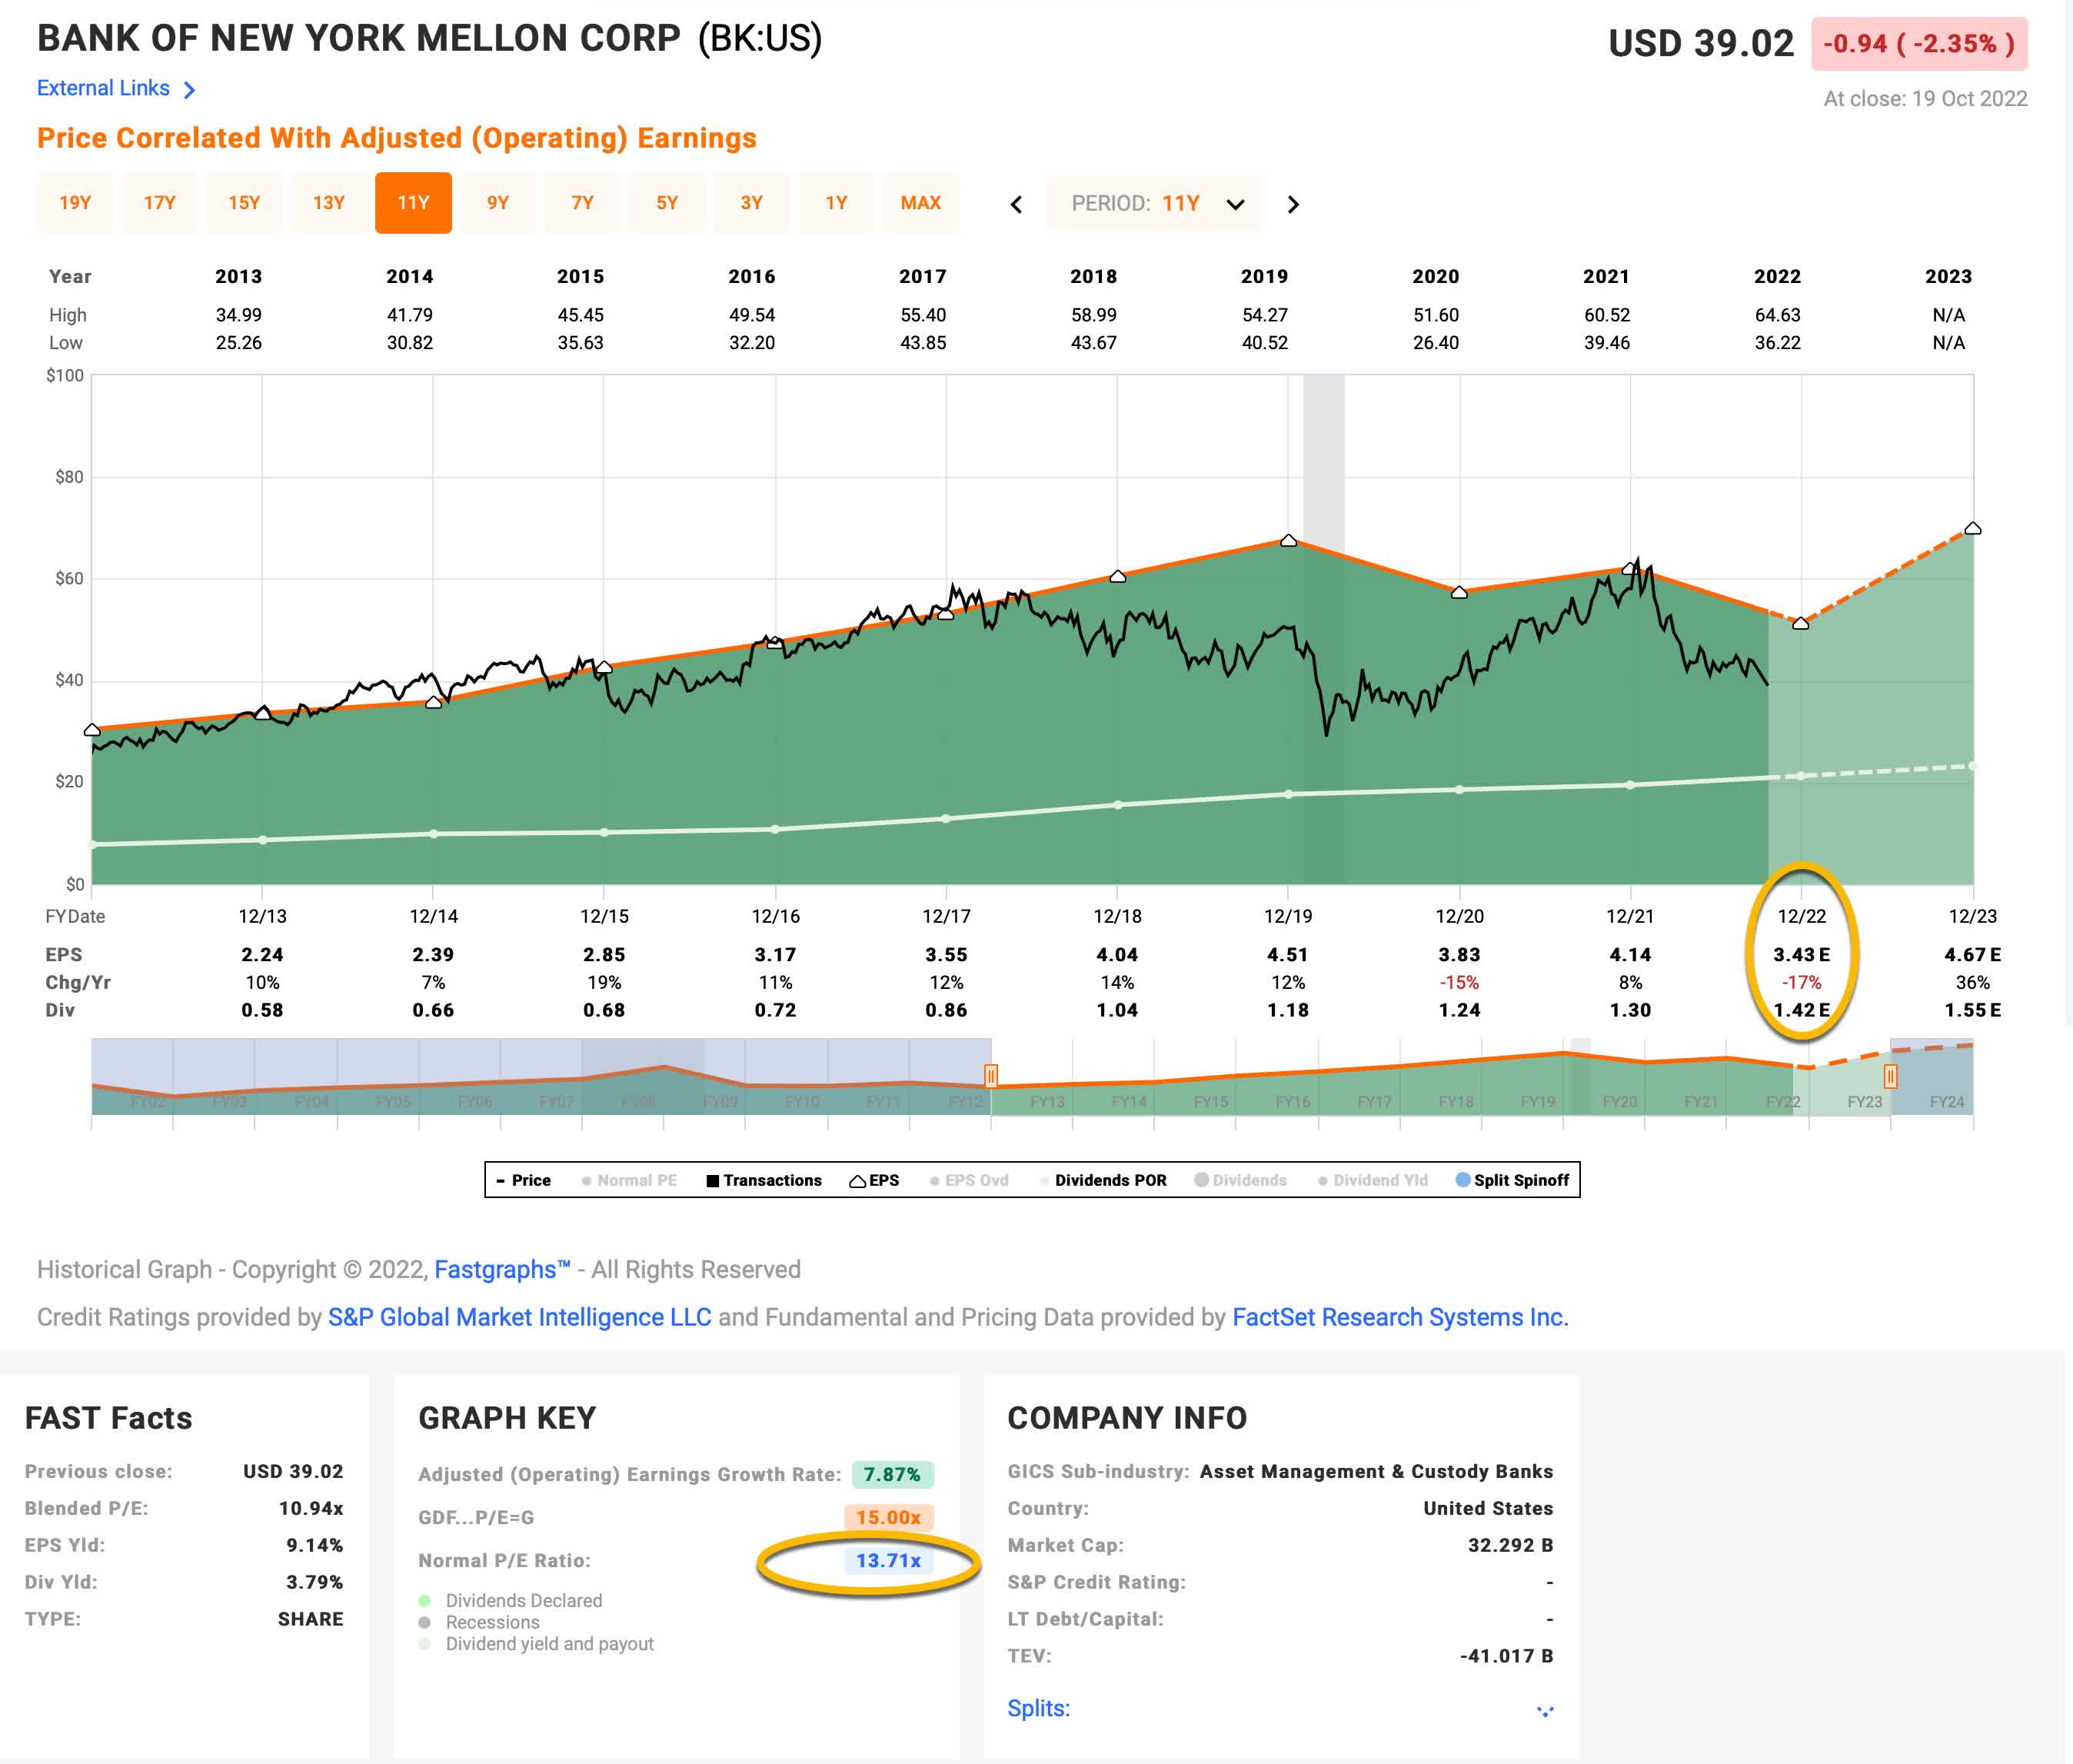
BK’s average P/E from 2013 to the present has been about 13.71 (the blue number circled in gold near the bottom of the FAST Graph). Using 2022’s forward earnings estimates of $3.43, BK has a current P/E of 9.33. If that 9.33 P/E were to revert to the average P/E of 13.71 over the course of the next 10 years and everything else was held the same, BK’s price would rise and it would produce a 10-Year CAGR of +3.93%. That’s the annual return we can expect from sentiment mean reversion if it takes 10 years to revert. If it takes less time to revert, the annual return would be higher.
Business Earnings Expectations
We previously examined what would happen if market sentiment reverted to the mean. This is entirely determined by the mood of the market and is quite often disconnected, or only loosely connected, to the performance of the actual business. In this section, we will examine the actual earnings of the business. The goal here is simple: We want to know how much money we would earn (expressed in the form of a CAGR %) over the course of 10 years if we bought the business at today’s prices and kept all of the earnings for ourselves.
There are two main components of this: the first is the earnings yield and the second is the rate at which the earnings can be expected to grow. Let’s start with the earnings yield (which is an inverted P/E ratio, so the Earnings/Price ratio). The current earnings yield is about +10.78%. The way I like to think about this is, if I bought the company’s whole business right now for $100, I would earn $10.78 per year on my investment if earnings remained the same for the next 10 years.
The next step is to estimate the company’s earnings growth during this time period. I do that by figuring out at what rate earnings grew during the last cycle and applying that rate to the next 10 years. This involves calculating the historical EPS growth rate, taking into account each year’s EPS growth or decline, and then backing out any share buybacks that occurred over that time period (because reducing shares will increase the EPS due to fewer shares).
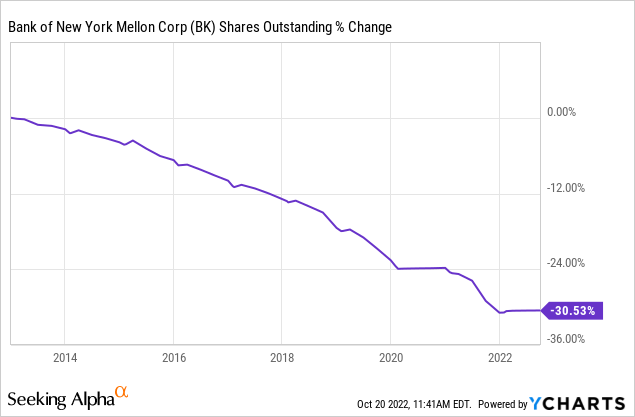
Bank of New York Mellon has bought back a lot of stock since 2013, with nearly 30%, or 1/3rd, of the company’s stock repurchased. I make adjustments to control for the effects these repurchases have on EPS in order to get an estimate of what rate earnings are organically growing. Then I also control for both the share buybacks and for the two negative EPS growth years of 2020 and 2022, I get an estimated earnings growth rate for BK during this period of +4.43%. (Note that this is quite a bit more conservative than the FAST Graphs calculation of +7.87% EPS growth during this time.)
Next, I’ll apply that growth rate to current earnings, looking forward 10 years in order to get a final 10-year CAGR estimate. The way I think about this is, if I bought BK’s whole business for $100, it would pay me back $10.78 plus +4.43% growth the first year, and that amount would grow at +4.43% per year for 10 years after that. I want to know how much money I would have in total at the end of 10 years on my $100 investment, which I calculate to be about $237.90 including the original $100. When I plug that growth into a CAGR calculator, that translates to a +9.05% 10-year CAGR estimate for the expected business earnings returns.
10-Year, Full-Cycle CAGR Estimate
Potential future returns can come from two main places: market sentiment returns or business earnings returns. If we assume that market sentiment reverts to the mean from the last cycle over the next 10 years for BK, it will produce a +3.93% CAGR. If the earnings yield and growth are similar to the last cycle, the company should produce somewhere around a +9.05% 10-year CAGR. If we put the two together, we get an expected 10-year, full-cycle CAGR of +12.98% at today’s price.
My Buy/Sell/Hold range for this category of stocks is: above a 12% CAGR is a Buy, below a 4% expected CAGR is a Sell, and in between 4% and 12% is a Hold. A +12.98% CAGR expectation makes Bank of NY Mellon’s basic valuation look like a “Buy”, however, I am not a buyer here, and I’ll explain why I’m not during the rest of the article.
Revenue Growth Trend Factor
With any valuation method a person employs, it’s always useful to “zoom out” and look at the big picture of what the valuation method is really doing and to understand the potential weaknesses of the approach. In the case of the “Full-Cycle Earnings” approach I shared in this article, one of the places it can go wrong is if the past earnings trend doesn’t hold into the future. Sometimes this can mean I avoid the stock of a business that goes on to experience a successful turnaround, but most of the time it means that I have purchased a stock that looks like a good value, only to discover it is a value trap. And we can see the potential for that just by glancing at BK’s earnings trends. From 2013 through 2019, BK grew EPS every single year, and in 6 out of 7 years they grew EPS double digits. However, during the past three years, two years had negative double-digit EPS growth, and the one year EPS did grow, it only grew 8%. So, on the surface, we can see the potential of breaking with the earlier growth trend.
Personally, I don’t buy turnaround stocks (at least not on purpose), so I require that a business grow its earnings at least a little bit. My rough approximation for this is based on the fact that very long-term inflation rates in the US have been about 3% per year, give or take. So I want businesses to at least have a history of growing earnings at that rate before I buy them. BK is currently just above that rate.
In the same spirit as the earnings growth threshold, I use the 3-year revenue trend to help me identify potential value traps. That metric takes revenues from 3 years ago and measures how much they have grown through today. If today’s revenues are lower than they were three years ago and we aren’t in the middle of a recession, then, even if I own the stock, I sell it based on that metric alone.
I first purchased BK stock during the beginning of the March 2020 sell-off on 2/28/20, and I wrote about that purchase in this article: “Stocks I Bought On The Dip: Bank of New York Mellon“. But in late September 2020, I decided to sell BK for a modest loss. I explained my reasoning in the article “Why I Sold Bank of New York Mellon“. I think this stock was the only stock I bought during the 2020 crash that I took a loss on. The other 29 stocks I bought during this period I either still hold, or were sold for a substantial profit. The reason I decided to sell BK when I did was the cumulative 3-year revenue number was negative.
Here is what BK’s revenue trend looks like right now:
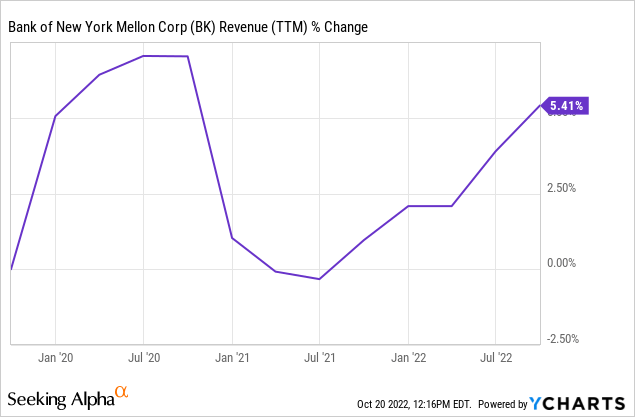
It is just barely positive at the moment. While I wouldn’t necessarily sell a stock I already owned if the revenue trend is weak, but still positive, if the 3-year revenue trend is 9% or less (corresponding to revenue growth of only 3% per year, about in line with the average inflation long-term inflation rate) I will typically hold off and not buy the stock. This is why I would suggest not buying Bank of New York Mellon stock at the current time. There just isn’t enough growth potential.
I Like Signature Bank (SBNY) Better
In my marketplace service, The Cyclical Investor’s Club, a few weeks after I sold Bank of New York Mellon, on 11/27/20, I bought Signature Bank. At the time, it looked undervalued and also had good growth prospects. I mentioned it in my January article “6 Financial Stocks I Recently Sold, And 2 I Will Hold For The Long Term” as one of two financial stocks I owned, that likely had a lot of downside risk, but that I had decided to go ahead and hold through the downturn (the other one I held onto was BlackRock (BLK)). Here is how Signature has performed since I bought it compared to BK and the S&P 500 (SPY):
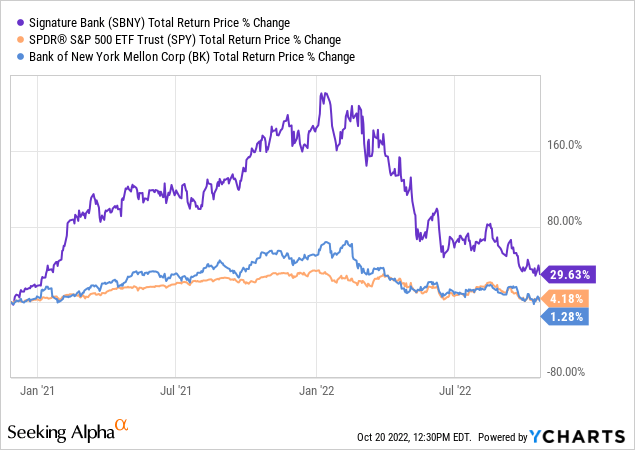
Even though I was correct to point out SBNY’s downside risk in January and I would have been better off if I took profits along with most of my other financial stocks, it has still performed better than the market and BK over this time period.
FAST Graphs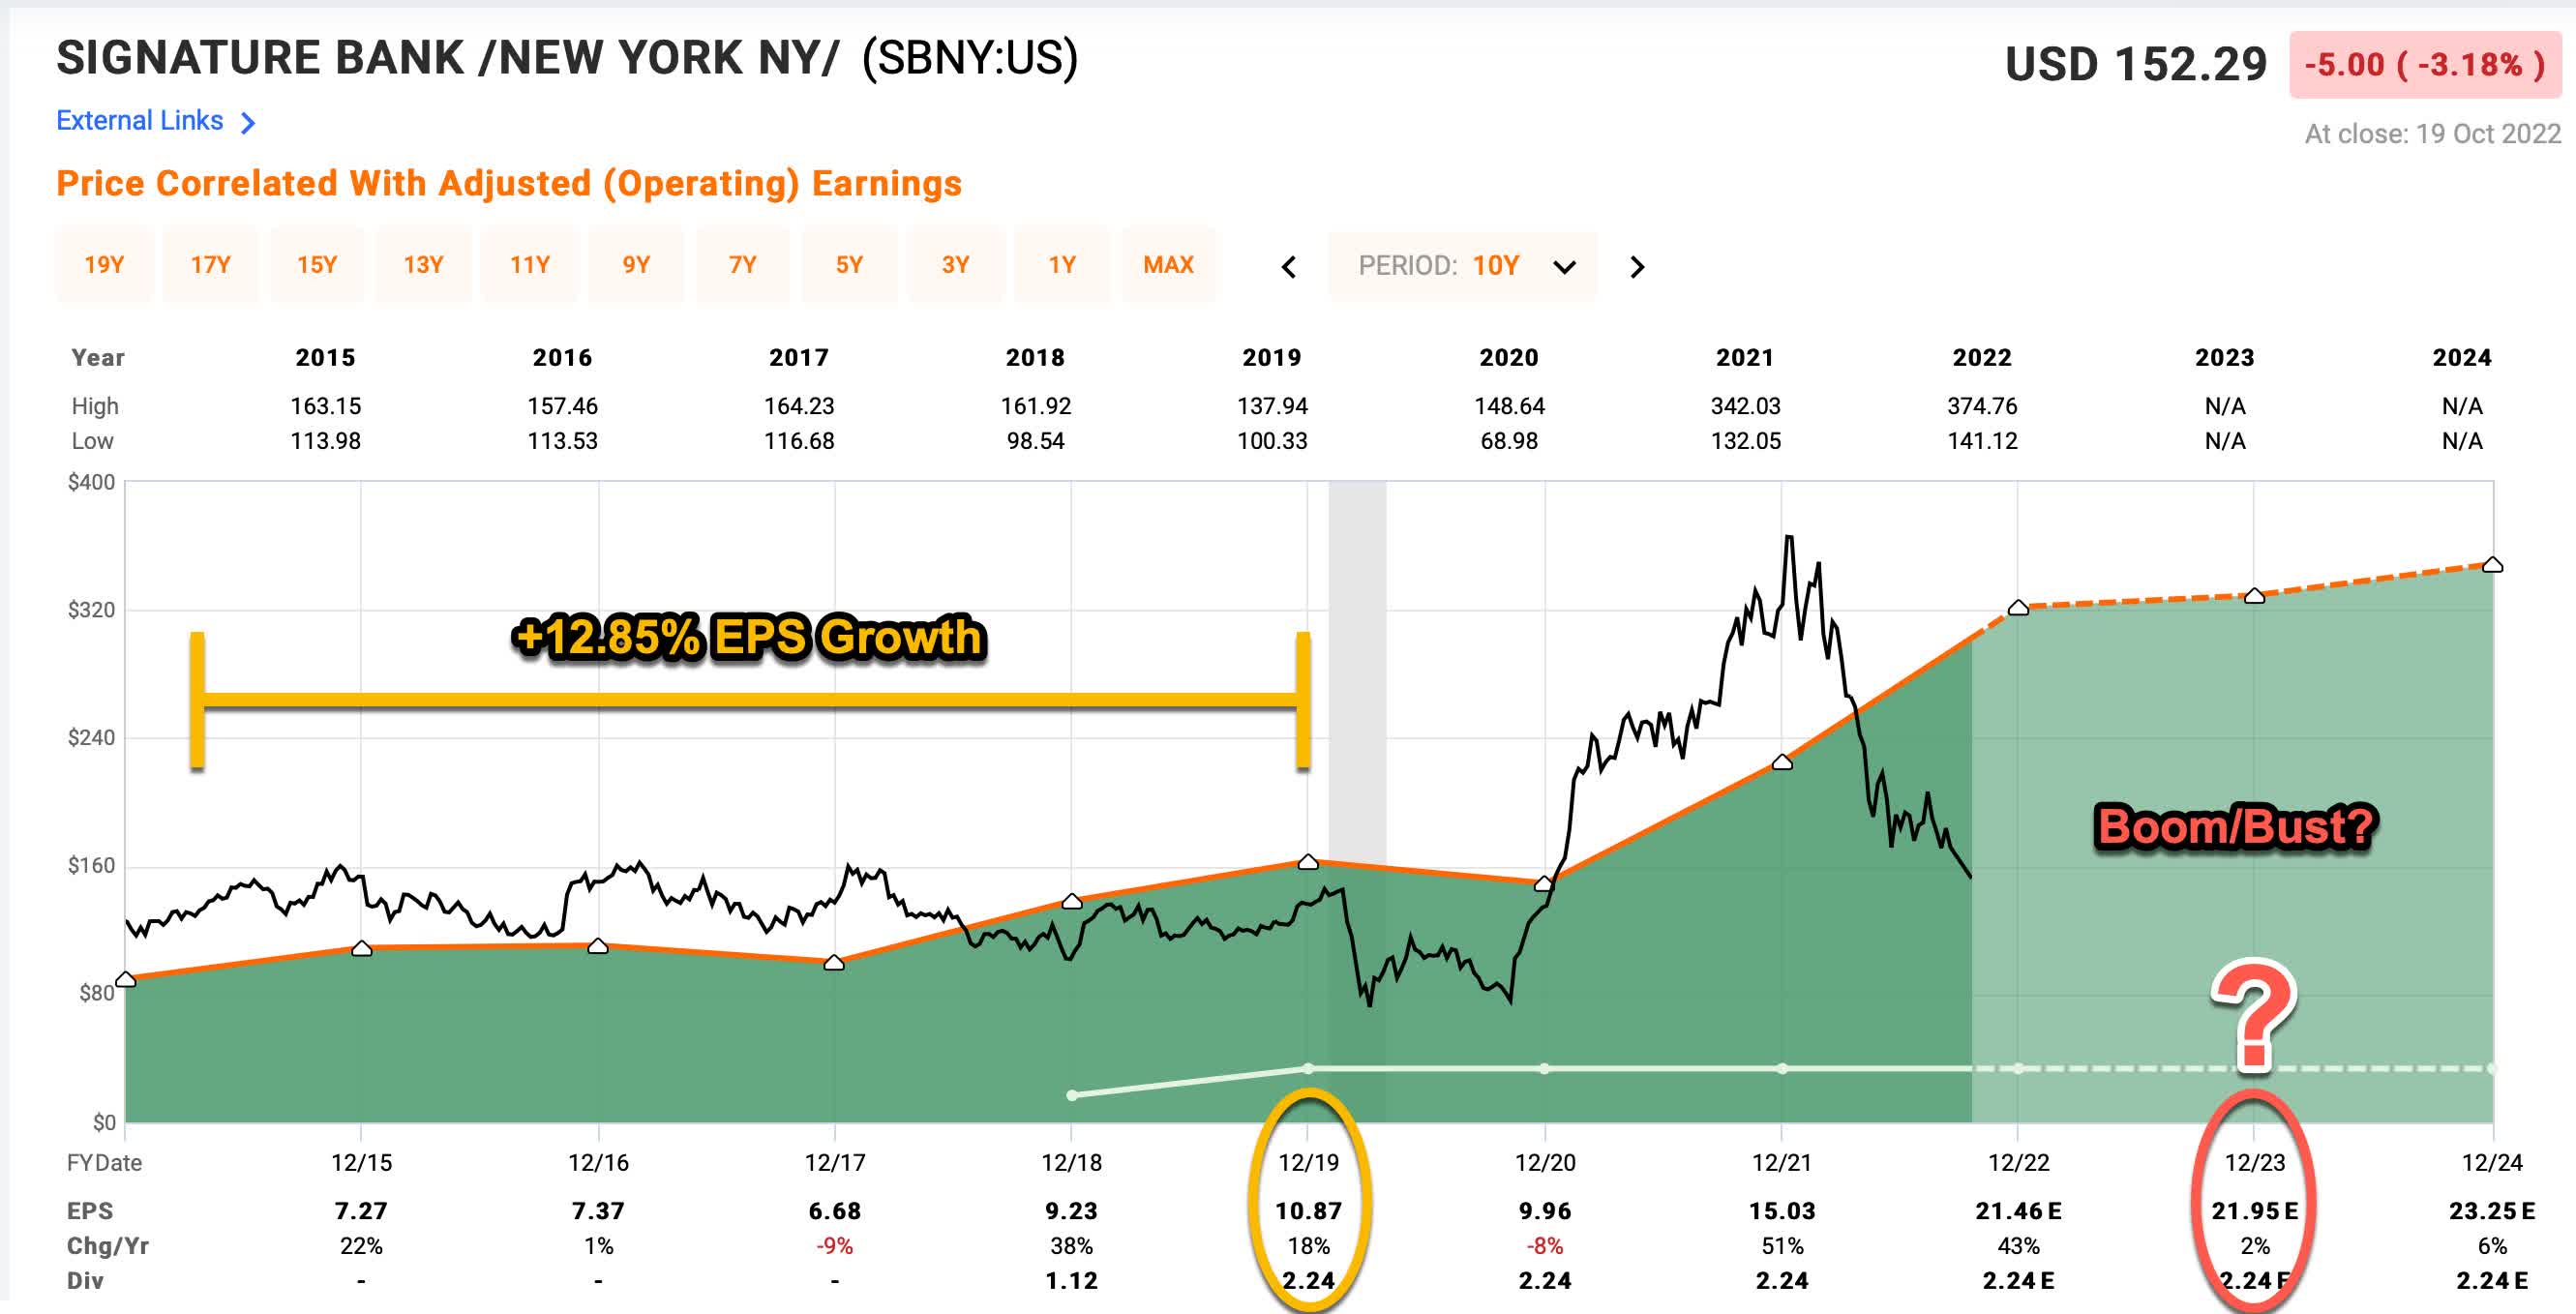
Above is a FAST graph for Signature Bank, and what I want to do here is assume the worst about what is going on with the business and the stock. We can see that over the past two years Signature has grown earnings at about 50% per year. I think it’s possible that at least some of that growth is due to pandemic stimulus, and that it’s conceivable those earnings could disappear in 2023. I call this set-up a “boom/bust” and I’ve shared the thinking behind it for stocks like Apple (AAPL) and Alphabet (GOOG) (GOOGL) this year, which show a similar pattern. So, what I want to do is go back to 2019 before the pandemic, and assume 2023 EPS reverts to that level, and then grows at the rate it had been growing leading up to the pandemic. So, the assumptions here are an EPS of $10.87, growing at +12.85%. When I run Signature through the same valuation process I just used for BK, I get a 10-year CAGR expectation of +12.87%, which is about the same as BK’s. Only with SBNY, I have baked in roughly a 50% margin of safety with my earnings assumptions.
Unfortunately for me, since I own SBNY, the market isn’t likely to stop selling off the stock as long as EPS is declining next year (again, assuming the worst). However, for investors waiting to buy, or investors who own BK who are interested in a bank stock with better growth prospects, who might want to rotate out and into SBNY, here is what I would do.
We already know that the fundamentals for SBNY look pretty good and have a margin of safety, but I always try to buy at the lowest price possible and it’s unlikely if EPS declines next year, SBNY bottoms before then. So what I would do is keep an eye on the Momentum Factor in Seeking Alpha’s Quant grades (just the momentum part and not the aggregate grade).
Seeking Alpha
Right now SBNY has a momentum grade of “F”. The standard I use is if the grade rises to a “B-” or better, that’s when I would buy SBNY stock if I didn’t already own it. While the method isn’t perfect, assuming the stock keeps selling off, it should get potential investors a price that’s closer to the ultimate bottom.
Conclusion
Sometimes, even with relatively simple valuation methods like mine, complications arise. It helps to zoom out and look at the big picture and identify the weaknesses of the basic approach. I’ve actually shared two weaknesses of my approach in this article. For Bank of New York Mellon, it’s the danger of a slow decline or stagnant revenues that are lower than where they have been historically. For Signature Bank, it’s the danger of a temporary “boom/bust” cycle potentially caused by temporary stimulus money injected into the economy, and then removed. About 80% of the time, my basic methods don’t need any adjustments, but being able to first recognize certain dangers, and then make adjustments for them goes a long way to boost returns.
Over the long term I expect Signature Bank stock will outperform Bank of New York Mellon’s, but investors may have to accept higher volatility. The good news for investors waiting to buy, is that higher volatility can offer some excellent prices at which to buy, and I expect over the next 12 months you will get those prices with Signature Bank.
Be the first to comment