


robwilson39/iStock Editorial via Getty Images
Introduction: Why Is BAC Stock Going Up?
Bank of America Corporation (NYSE:BAC) released Q1 2022 results on Monday (April 18). BAC stock has risen 5.3% in the following two days.
Bank of America has been a core holding in our portfolio for more than a decade, and we initiated our coverage of BAC on Seeking Alpha with a Buy rating in October 2019. Since our initiation, shares have returned 46% (with dividends), though they are currently down 11% year-to-date:
|
Librarian Capital Rating History on BAC vs. Share Price (Last 1 Year) 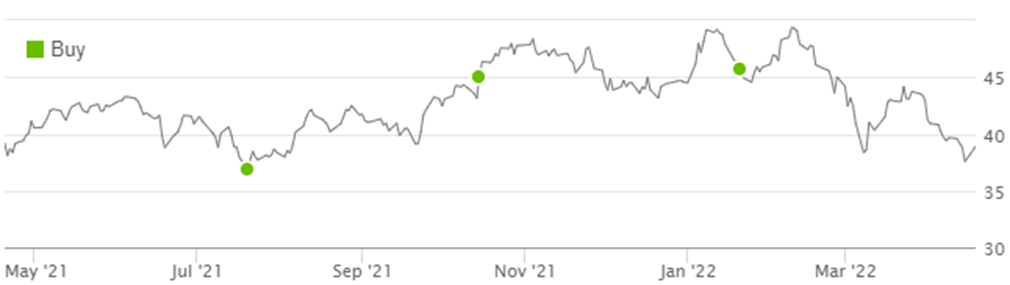 Source: Seeking Alpha (19-Apr-22). |
Q1 2022 results support our investment case, and show how BAC is well-positioned to benefit from both higher interest rates and the broader economic recovery. Our forecasts show a total return of 66% (15.3% annualized) by 2025 year-end, and shares currently have a Dividend Yield of 2.2%. Buy.
BAC Buy Case Recap
We believe large U.S. banks can grow their earnings at “GDP +”, thanks to their scale, diversified franchise and leading market positions:
- Large banks achieve Net Interest Income (“NII”) on favourable Net Interest Yields, thanks to their cheap deposit funding; yields had shrunk in recent years due to Quantitative Easing (“QE”), but this is now reversing
- They have large Non-Interest Revenues such as investment banking fees, which tend to become elevated during periods of QE as cheap money stimulates corporate and market activity, offsetting NII weakness
- Their cost ratios tend to be stable or improving, as economies of scale and use of technology help them become more efficient
- They are now far less impacted by economic downturns than in the past, thanks to QE policies and much larger capital buffers after the 2008 crisis
Compared to its peer JPMorgan Chase (JPM) (which we recently upgraded to Buy), BAC is more weighted towards U.S. retail banking, its low-cost deposit franchise means it will benefit more from rising interest rates, and it has more room to grow before it will face higher capital requirements.
The core of our investment case is that BAC will maintain a long-term Return on Tangible Common Equity (“ROTCE”) of 16% on a growing capital base:
|
BAC Group ROTCE (2013-21 vs. Long-Term Forecast) 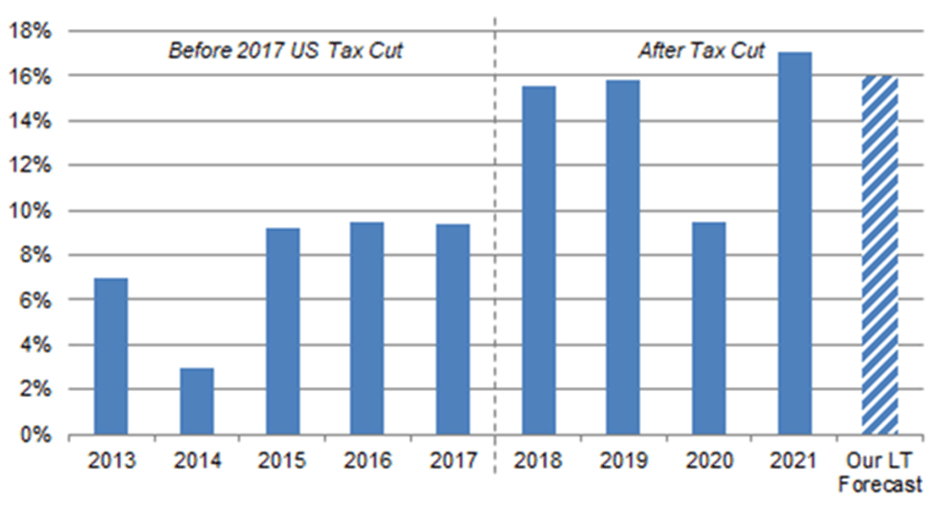 Source: BAC results supplements. NB. Excludes $2.07bn First Data JV impairment in 2019. |
Q1 2022 results are in line with our views.
Q1 2022 Results Headlines
BAC’s Earnings Per Share was 6.8% lower year-on-year and 1.3% lower sequentially, primarily due to large reserve releases in previous periods:
|
BAC Results Headlines (Reported Basis) (Q1 2022 vs. Prior Periods) 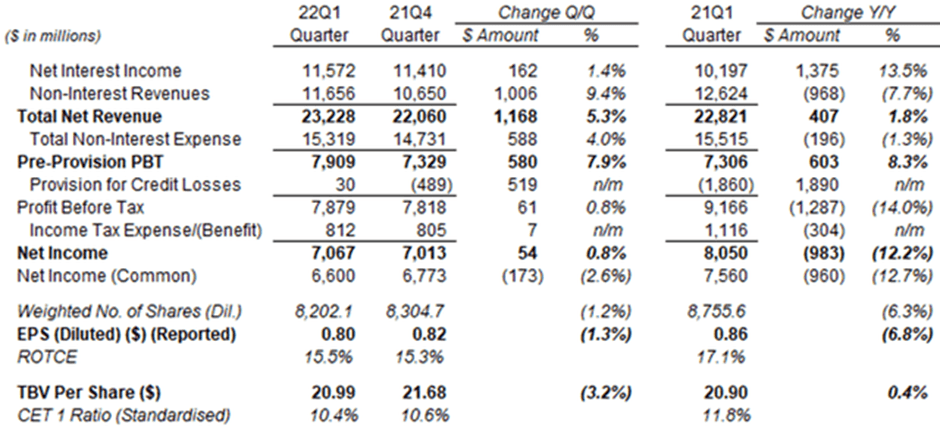 Source: BAC results supplement (Q1 2022). |
Provision for Credit Losses was a small positive $30m in Q1, compared to a negative $1.86bn in the prior-year quarter and a negative $489m in Q4 2021 (both due to large reserve releases). The quarter included a reserve release of “only” $362m and Net Charge-Offs of $392m, the latter still near historical lows. Lending and counterparty exposure to Russia is only $700m.
Pre-Prevision Pre-Tax Profit (“PBT”), which excludes the impact of one-off reserve releases and builds, grew 7.9% sequentially and 8.3% year-on-year in Q1 2022. It has continued to trend up since Q3 2020:
|
BAC Earnings, Provisions & Pre-Tax Profit by Quarter (Since Q4 2019) 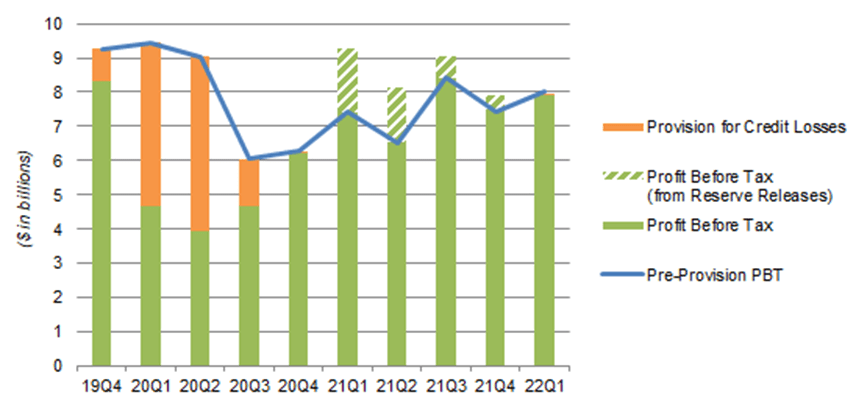 Source: BAC results supplements. NB. Figures on managed basis. |
This is in contrast to JPM, where Pre-Provision PBT has been trending down since Q1 2021 as its wholesale revenues normalize down from record levels.
BAC earnings are benefiting from rising Net Interest Income (“NII”), limited Non-Interest Revenues declines and good Expenses control. We discuss each of these in more detail in separate sections below.
The number of shares was 1.2% lower sequentially and 6.3% lower year-on-year, thanks to share buybacks, helping accelerate EPS growth.
The Return on Tangible Common Equity (“ROTCE”) was 15.5% in Q1 2022, lower than last year’s exceptional 17.3%, but slightly up sequentially and roughly in line with our long-term assumption of 16%.
The Common Equity Tier-1 (“CET1”) ratio was 10.4%, above the 9.5% minimum requirement. It fell 20 bps sequentially, after a 21 bps hit from the re-valuation of Assets-For-Sale debt securities as a result of higher rates.
Management stated BAC will move gradually to a CET1 target range of 10.75-11% by the start of 2024, as BAC’s growing size means its GSIB (Global Systemically Important Banks) capital buffer will move upwards by 50 bps. We expect this to have only a limited impact on BAC’s ROTCE.
Net Interest Income Set for Strong Growth
NII grew 1.4% (or $160m) sequentially (despite two few days) and 13.5% year-on-year in Q1, and is set for even stronger growth in the rest of 2022.
|
BAC Net Interest Income (Since Q4 2019) 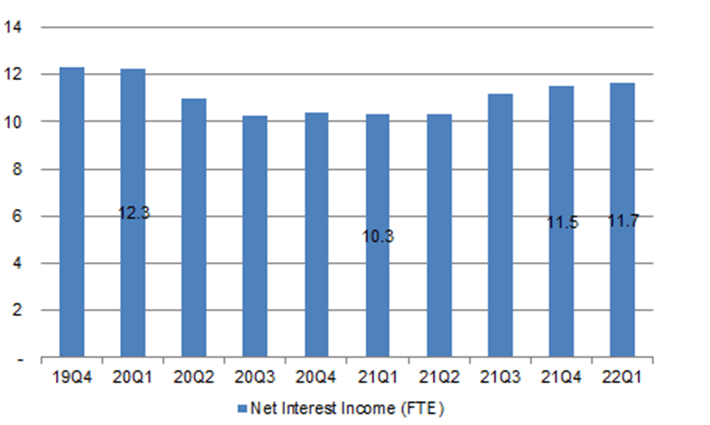 Source: BAC results supplements. |
NII growth was driven by both loan growth and higher Net Interest Yields.
Total Loans & Leases were up 8% year-on-year, or 10% excluding COVID-related Paycheck Protection Program (“PPP”) loans in the prior year, and was also up sequentially, overcoming the usual seasonal post-Q4 dip:
|
BAC Average Total Loans & Leases (Last 5 Quarters)  Source: BAC results presentation (Q1 2022). |
Loan growth was broad-based, though higher among commercial clients. Three of BAC’s four segments saw year-on-year loan growth of between 9% (Global Banking) and 40% (Global Markets). Consumer Banking saw a 2% decline, due to Small Business / Other and Home Equity loans still being lower.
Net Interest Yield, excluding Global Markets, was 1.99%, 7 bps higher sequentially and 9 bps higher year-on-year:
|
BAC Net Interest Yields (FTE Basis) 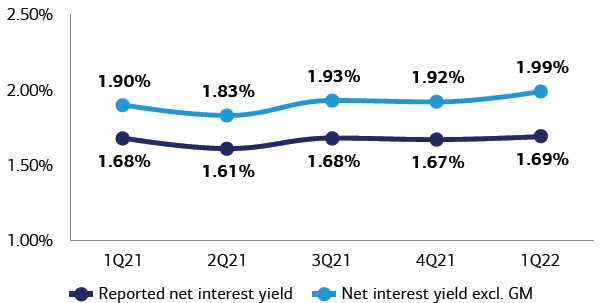 Source: BAC results presentation (Q1 2022). |
Higher rates materialized relatively late in Q1, so the quarter’s figures did not reflect their full benefit. BAC expects even stronger NII growth to come:
The yield curve is projecting 125 bps of rate hikes over the next three (Federal Reserve) meetings … if loans grow and rates in the forward curve materialize, we would expect to see NII in Q2 increase by more than $650m over the Q1 level and then grow again significantly on a sequential basis in each of the following two quarters”
Andrew Borthwick, BAC CFO (Q1 2022 earnings call)
Management did not give full-year guidance, as rates remain volatile.
Non-Interest Revenues Only Fell Modestly
Non-Interest Revenues in Q1 2022 were 9.4% higher sequentially but 7.7% (or $968m) lower year-on-year, the latter only a modest decline, reflecting BAC’s limited benefit from elevated investment banking (“IB”) revenues during 2021. ($80m of the decline was due to a decision to cut overdraft fees.)
In Global Banking, IB Fees were 25% (or $282m) lower year-on-year, mainly due to lower equity issuance, but offset by higher NII and other revenues:
|
BAC Global Banking Revenues by Type (Last 5 Quarters) 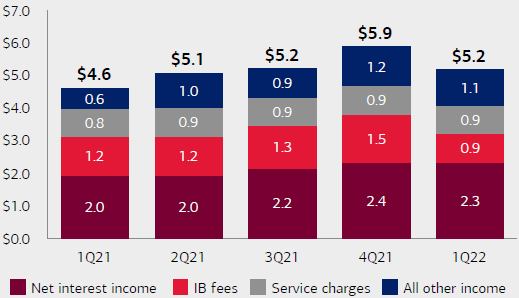 Source: BAC results presentation (Q1 2022). |
In Global Markets, Sales & Trading Revenues were only 7% (or $359m) lower year-on-year, as stronger Equities trading offset weaker Fixed Income, Currency & Commodities (“FICC”) trading; both remain above pre-COVID levels, after more capital was allocated in 2021:
|
BAC Global Markets Sales & Trading Revenues (Last 5 Quarters) 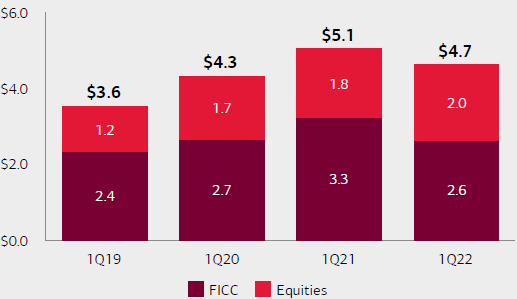 Source: BAC results presentation (Q1 2022). |
While Non-Interest Revenues may normalize down further after the exceptional past two years, we believe future declines will be modest.
Good Expense Control & Operational Leverage
Non-Interest Expense fell year-on-year (due to some prior-year one-offs) and grew less than revenues sequentially (despite seasonally higher Q1 payroll costs), which meant BAC’s Efficiency Ratio improved during Q1 2022:
|
BAC Efficiency Ratio (Last 5 Quarters) 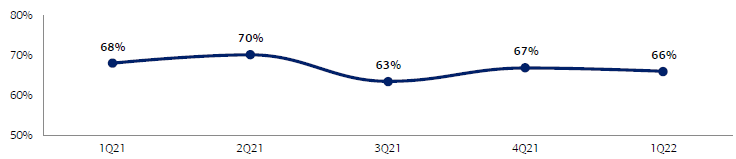 Source: BAC results presentation (Q1 2022). |
Management continues to expect its Efficiency Ratio to “work back towards 60%” (compared to a pre-COVID trough of 57% in Q3 2019). This will be helped by both natural operational leverage and continuing good expense control, with Non-Interest Expenses still expected to be “relatively flat for 2022 versus 2021” and then grow only at a “modest” rate thereafter (CEO Brian Moynihan referred to an 1% growth rate, excluding revenue-related expenses, on the Q4 2020 earnings call).
An improving Efficiency Ratio means that BAC’s earnings will grow even faster than revenues. Q1 2022 was an example of this, with Pre-Provision PBT growing 7.9% sequentially, ahead of revenue growth of 5.3%.
Valuation: Is BAC Stock Overvalued?
At $39.57, BAC stock is trading at 1.9x Price / Tangible Book Value (“P/TBV”).
Relative to our assumed ROTCE of 16%, this implies a P/E of 11.9x. Relative to pre-COVID 2019 earnings (adjusted for buybacks and excluding the First Data JV impairment), the P/E is a similar 11.1x. (2020 and 2021 earnings are distorted by one-off COVID-related reserve builds and releases respectively.)
BAC stock pays a dividend of $0.21 per quarter, or $0.84 annualized, representing a Dividend Yield of 2.1%. Management targets a Payout Ratio of around 30%, and the dividend was raised 17% (from $0.18) in 2021.
Share repurchases totalled $25.1bn in 2021 (compared to Net Income of $32.0bn), equivalent to 6.5% of the current market capitalization. Buybacks are expected to continue in 2022, but at a temporarily slower rate, due to the impact of higher rates on the BAC’s debt securities portfolio and the need to build capital towards the pending higher CET1 ratio target.
Bank of America Stock Forecast 2025
We keep our forecasts unchanged, except lowering the price assumption for buybacks slightly due to the lower share price. We assume:
- ROTCE to be 16.0% for all years (unchanged)
- Net Income each year to be 15% retained for growth, 30% paid out as dividends and 55% on buybacks (unchanged)
- Buybacks to be carried out at a P/TBV of 2.0x (was 2.1x)
- 2025 year-end P/E of 14x (unchanged)
Our new 2025 EPS forecast of $4.37 is 1% higher than before ($4.33):
|
Illustrative BAC Return Forecasts 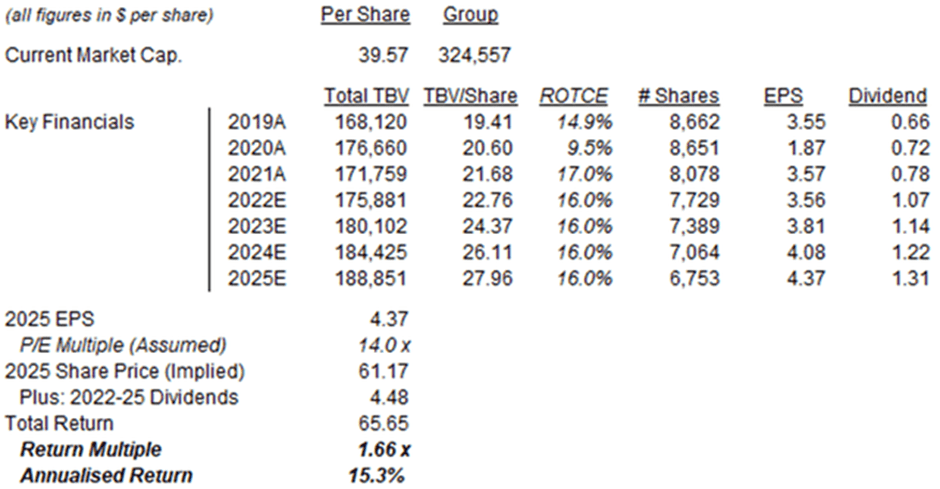 Source: Librarian Capital estimates. |
With shares at $39.57, we expect an exit price of $61 and a total return of 66% (15.3% annualized) by the end of 2025.
Is BAC Stock A Good Buy? Conclusion
BAC stock has risen 5.3% in the two days after good Q1 results, though still down 11% year-to-date; we believe this represents a bargain.
Excluding one-off reserve releases, profits have been on an upward trend, as BAC is benefiting from both higher rates and economic recovery
Net Interest Income grew 13% year-on-year thanks to both loan growth and higher net yields; sequential growth is expected to accelerate.
Non-Interest Revenues have only fallen modestly from their COVID-boosted levels, and operational leverage is adding to profit growth.
With shares at $39.57, we expect a total return of 66% (15.3% annualized) by the end of 2025. The Dividend Yield is 2.1%. Buy.
We reiterate our Buy rating on Bank of America stock.
Be the first to comment