

skodonnell/iStock Unreleased via Getty Images
Price Action Thesis
We present our detailed price action analysis on Bank of America (NYSE:BAC) stock. Financial plays have been hammered since the start of the year as the market parsed a significant slowdown with potential recessionary prospects.
Our price action analysis also highlighted a double top bull trap (significant rejection of buying momentum) formed in January, which portended its steep sell-off. However, given its above-average normalized P/E in January, the market’s digestion of its remarkable gains from its COVID bottom is justified.
Still, we believe that the market has already priced in a significant level of risk in BAC as its valuation has moderated markedly.
Notwithstanding, we have not observed a bear trap price action (significant rejection of selling momentum) that is emblematic of a sustained trend reversal. Therefore, BofA stock remains mired in a dominant bearish flow until proven otherwise.
Consequently, we urge investors to watch for a potential re-test of its near-term support (8.5% downside at writing) of $29.5 before considering adding exposure. We will also reassess our rating if we observe significant changes in its price action.
BAC – Eviscerated By The Double Top Bull Trap
BAC price chart (monthly) (TradingView)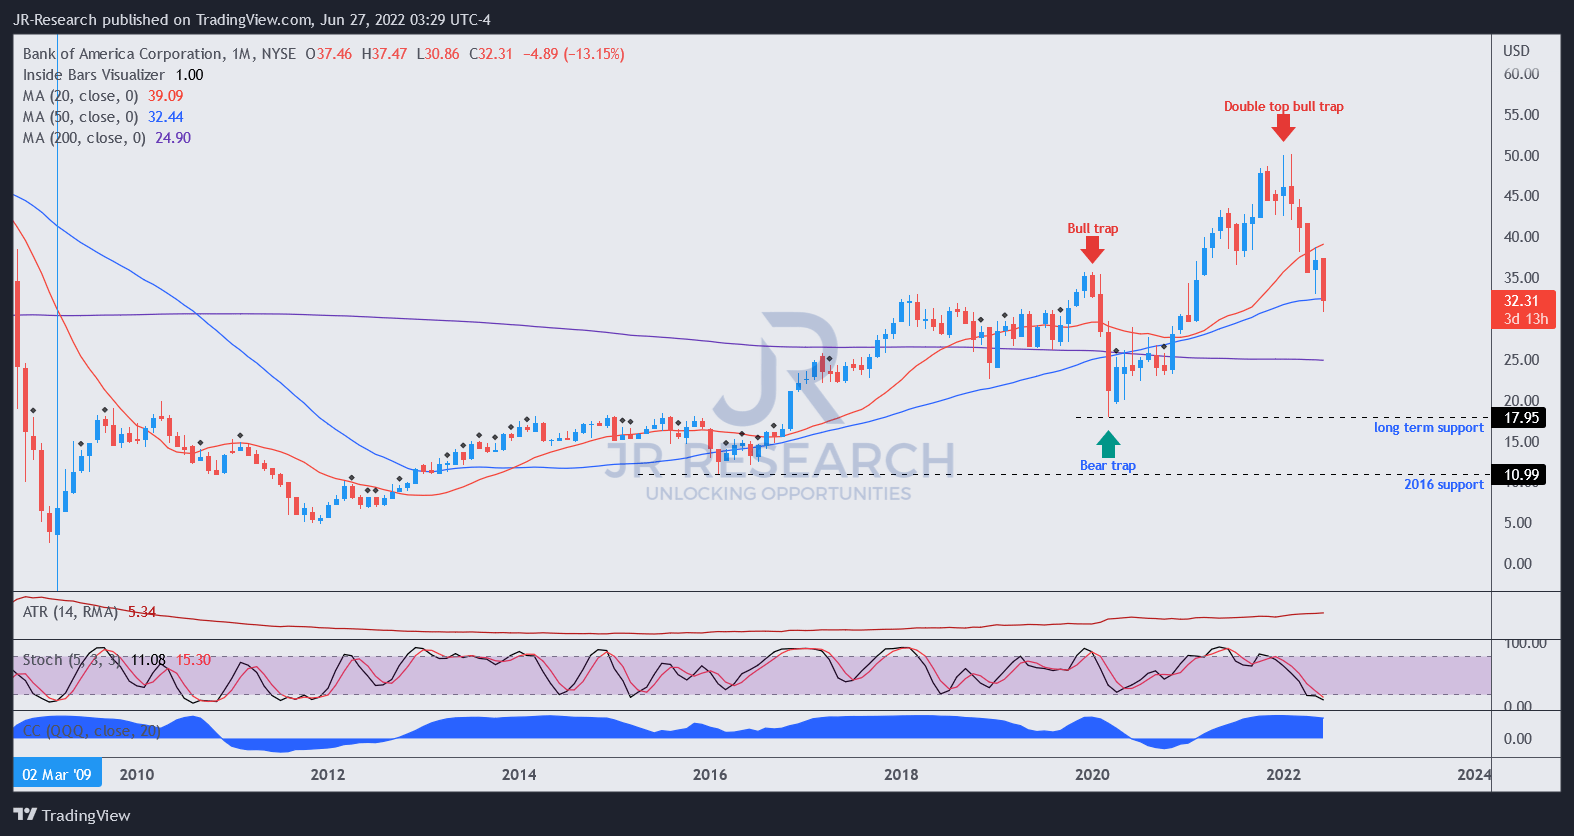
BofA stock has a remarkable long-term uptrend, as seen above. Therefore, it gives assured confidence to investors to “buy on significant dips” over the years. Notably, it formed a validated bear trap at its COVID bottom, which kickstarted a tremendous recovery to January 2022.
However, the market formed a formidable double top bull trap in January after showing suspicious signals a couple of months before. The double top should have provided investors a signal to cut exposure, as it could lead to a significant trend reversal.
Notably, BAC has also reverted to its long-term trend and could be attractive to some investors.
BAC price chart (weekly) (TradingView)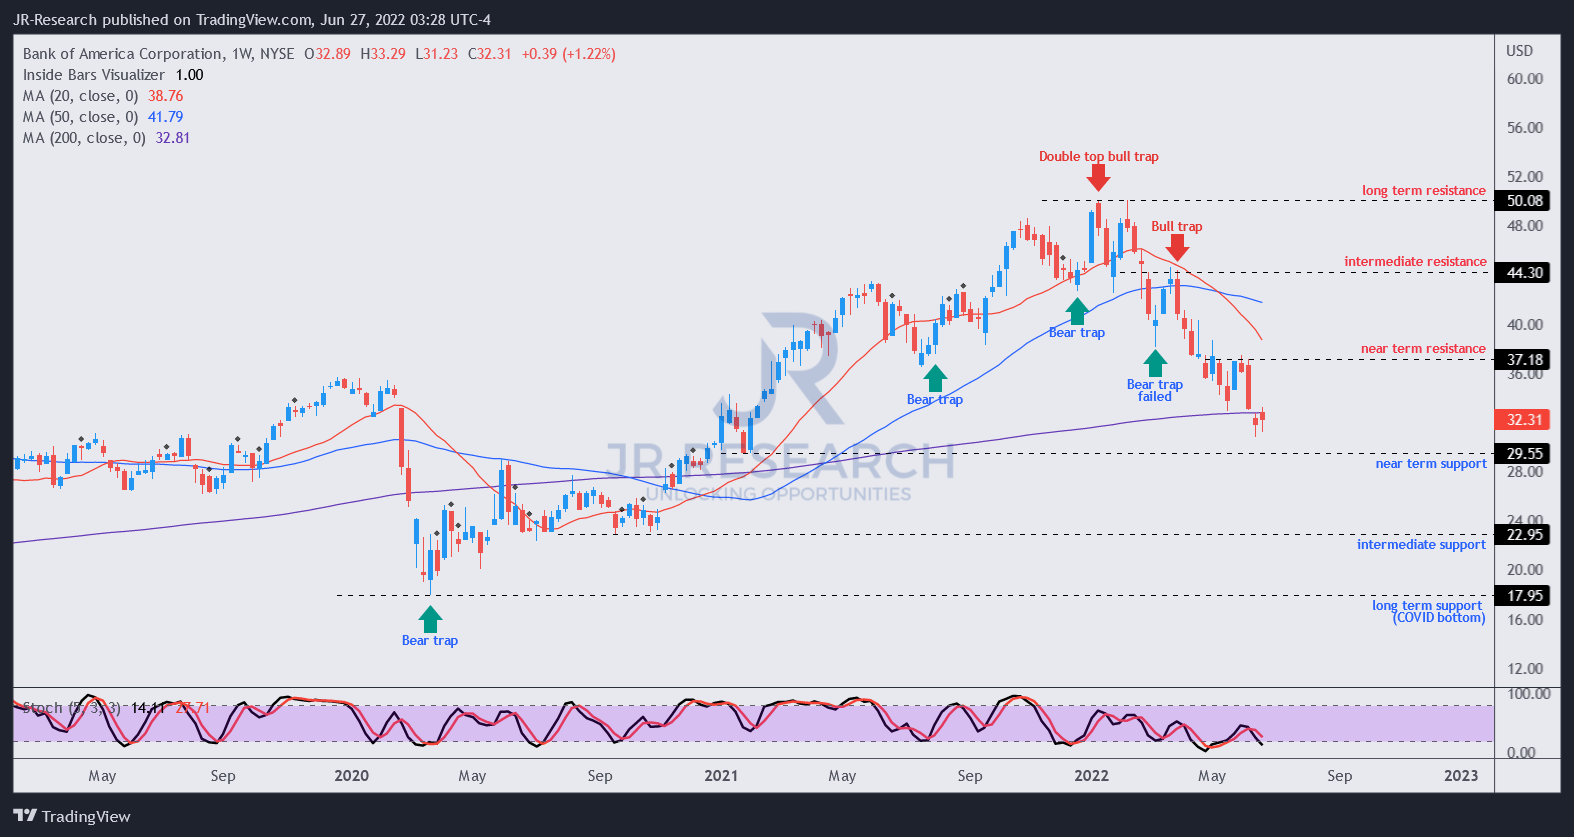
Poring into its weekly chart, we can observe the solid bullish bias seen in BAC trend from March 2020-January 2022. Moreover, a series of bear traps helped sustain its upward momentum.
However, the party ended with double top seen above. Furthermore, a lower-high bull trap in March was highly significant. It prevented the retaking of its bullish momentum and relegated BAC to its bearish bias.
Notably, BAC remains mired in its dominant negative flow, with no signs of a bear trap yet. Therefore, any bottom remains tentative until proven otherwise.
BAC – Valuation Is More Reasonable, If No Recession
BofA adjusted net margins % and adjusted EPS change % consensus estimates (S&P Cap IQ)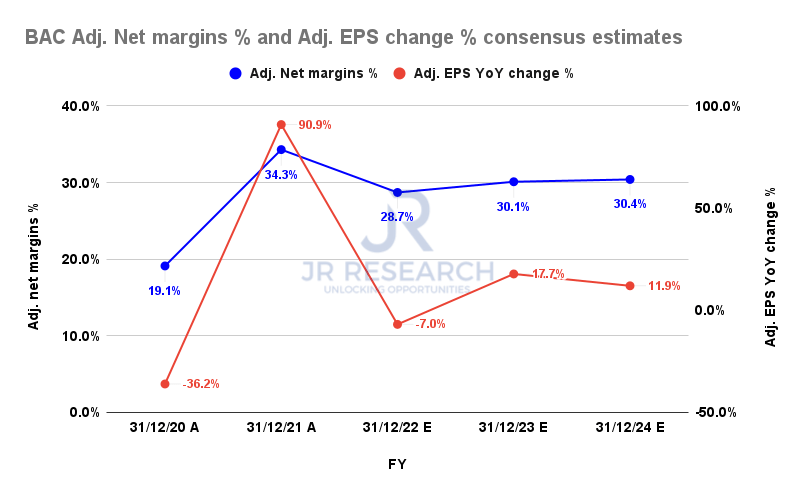
We believe the consensus estimates do not suggest a recessionary scenario but are modeled for a marked slowdown. As seen above, BofA’s adjusted net margins are expected to moderate to 28.7% in FY22 before recovering through FY24. Moreover, its adjusted EPS is expected to climb out of its FY22 nadir in FY23.
Furthermore, BofA also enunciated that it does not expect a significant recessionary scenario in its key segments. CFO Alastair Borthwick articulated (edited):
There’s this question of what will happen in the future, what we are seeing right now. And what we’re seeing right now, is credit is in great shape. And look, I’d expect it to bump around because we’re at such low levels. And one would think over time, it would trend back towards history, but we don’t see that right now. (Morgan Stanley U.S. Financials, Payments & CRE Conference)
Furthermore, recent data demonstrated that credit card delinquency trends and net charge-offs remain healthy, corroborating a strong consumer outlook. As a result, we think the Street’s modeling is reasonable. As a result, the price action has reflected the current dynamics appropriately.
BofA adjusted EPS consensus estimates (S&P Cap IQ)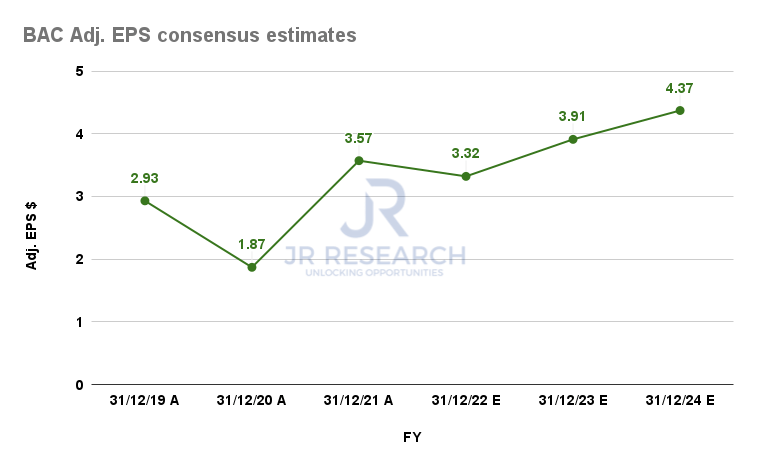
Notwithstanding, investors should expect BofA’s adjusted EPS growth to slow dramatically through FY24 after its remarkable recovery in FY21. Its EPS CAGR of 6.97% from FY21-24 is markedly below its EPS 5Y CAGR of 19.1% and well below its pre-COVID EPS CAGR of 25% from FY16-19.
Therefore, we believe slower profitability growth behooves moderation in its earnings multiples to justify its valuation.
BAC NTM normalized P/E trend (TIKR)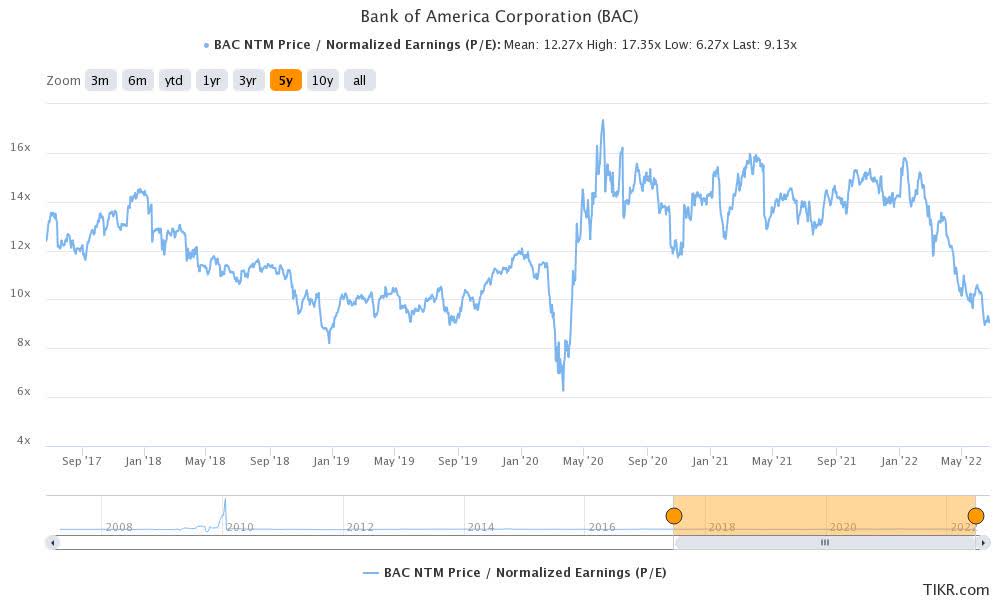
BAC traded at an NTM P/E of 15.4x (Vs. 5Y mean of 12.27x) at its peak in January, clearly unsustainable given slowing profitability growth. March’s bull trap also significantly rejected buying momentum at the 13.2x P/E level.
It last traded at a P/E of 9.13x, markedly below its 5Y mean of 12.27x. But, investors should note that BAC traded at a P/E of 6.27x at its COVID bottom. Therefore, we believe its current valuation may not have reflected the risks of an extended economic slowdown or recession.
Furthermore, with markedly slowing adjusted EPS moving forward (compared to its historical averages), we believe the current discount is appropriate. Therefore, even though its valuation is more reasonable, we don’t consider it undervalued.
Is BAC Stock A Buy, Sell, Or Hold?
We rate BAC stock as a Hold for now.
We have not observed a bear trap price action to stanch its bearish bias sustainably. We urge investors to watch for a re-test of its near-term support ($29.5) before considering adding exposure.
We noted that BAC had moderated significantly from its January highs. However, it was a justified selldown. Notwithstanding, we do not think that BAC is undervalued due to markedly slower profitability growth through FY24.
Be the first to comment