Andrzej Rostek/iStock via Getty Images
Technical Analysis
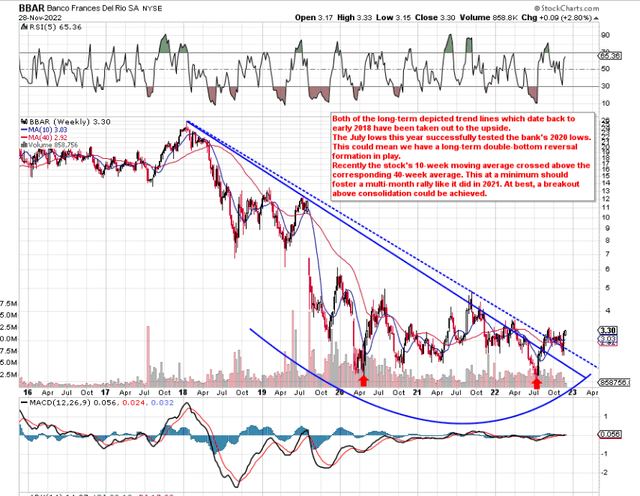
If we pull up a long-term chart of Banco BBVA Argentina S.A. (NYSE:BBAR), we see that shares have been stuck in a consolidation zone for well over two years now. However, this consolidation zone, which is roughly $2 on average in height, began to take place after a significant move to the downside; a collapse that also took over 2 years to run its course. The great thing about long-term charts is that they give us a perspective on BBAR’s trends which is simply impossible to attain from the daily charts alone. That huge down move for example which took place from early 2018 to early 2020 immediately lets us know that this stock is cheap; maybe the cheapest it has been in over two decades.
Furthermore, there are three trends that we like (from a bullish standpoint) on Banco BBAR’s long-term chart.
- Both of the long-term depicted trend lines which date back to early 2018 have been taken out to the upside.
- The July lows this year successfully tested the bank’s 2020 lows. This could mean we have a long-term double-bottom reversal formation in play.
- Recently the stock’s 10-week moving average crossed above the corresponding 40-week average. This at a minimum should foster a multi-month rally like it did in 2021. At best, a breakout above consolidation could be achieved.
BBAR Long-Term Chart (Stockcharts.com)
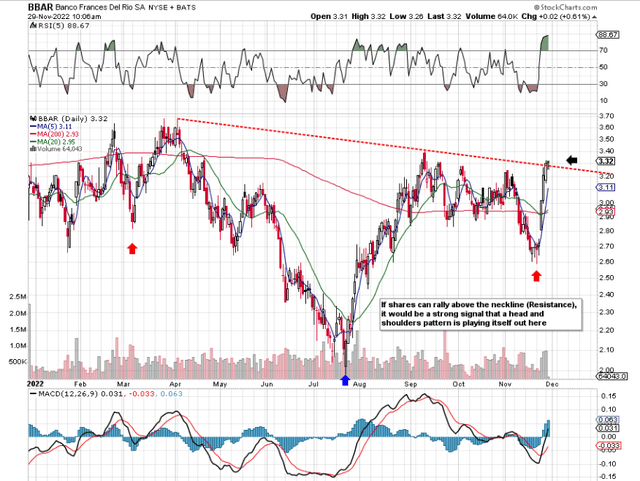
Moving on to the daily chart, we see that we definitely have the potential for an inverse head and shoulders pattern (bullish) to take place over the near term. We state this because of how close the bank’s share price is to the depicted neckline below. As shown below, there are three distinct bottoms in this pattern which comprise the two shoulders as well as the head which is always lower. The time to enter will be once we get a convincing move through that neckline (which could be imminent) preferably on strong buying volume. The principal reason why we favor an inverse head and shoulders pattern here is the volume profile of BBAR since that July (low). As we can see below, buying volume expanded meaningfully once shares bottomed with shares rallying well over 50% of their value in a two-month period.
BBAR Head & Shoulders Inverse (Stockcharts.com)
Growing ROE
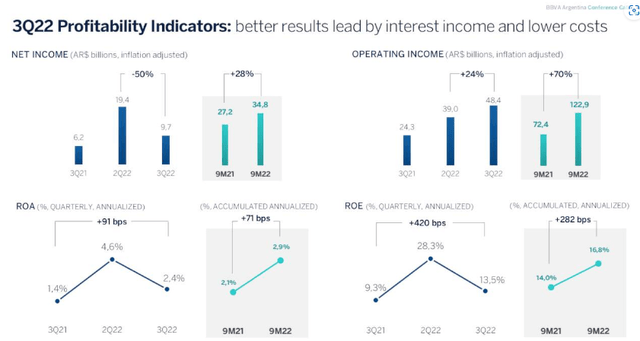
As always, in terms of sustained growth in the bank’s shares, this boils down to the relationship between BBAR’s valuation and profitability. On the profitability side, we like to look at the return on equity as this metric gives us a solid read on the trend of the bank’s fundamental value. Although we saw a sequential decline in the bank’s ROE in Q3 this year, investors would be better off focusing on the year-to-date trends which look strong across all of the bank’s principal profitability metrics. For example, core net income came in 28% higher over the first three quarters this year on an inflation-adjusted basis. This result stemmed from operating income growth of 70% for the first 3 quarters of this year. As noted earlier, an ROE of 13.5% for the quarter means this key metric now comes in at almost 17% when averaged out over the past three quarters. This number is higher than BBAR’s 5-year average (13.23%) and most certainly driving shares forward.
BBAR Profitability Indicators (Seeking Alpha)
Book Value Growth
The above trend has been driving the company’s book value which incidentally rose by almost 10% in Q3 of this year. BBAR’s book multiple now comes in at 0.64 which is a compelling multiple when compared to the sector in general (1.3). Suffice it to say, BBAR’s assets are cheap and are expected to continue to grow as we head into next year. We state this because digital sales continue to thrive and the bank continues to increase its number of customers (assets) at scale. The number of digital active clients grew by 12% in Q3 over a rolling quarter basis while the number of mobile active customers grew by an impressive 16%. Sustained penetration in these channels (which is what we are seeing) will lead to increased book value as well as growing margins in due time.
Conclusion
Therefore to sum up, given the internal trends which are taking place within Banco BBVA Argentina S.A. with respect to the bank’s growing value and profitability, there is every possibility that a breakout on the technical chart will take place over the near term. We look forward to continued coverage.


Be the first to comment