JHVEPhoto/iStock Editorial via Getty Images
Introduction
Baker Hughes Company (NASDAQ:BKR) released its second quarter 2022 results on July 20, 2022.
Note: This article is an update of my article published on May 4, 2022. I have followed BKR on Seeking Alpha since December 2020.
1 – Second quarter 2022 results snapshot
The company reported second-quarter 2022 adjusted earnings of $0.11 per share, missing analysts’ expectations this quarter again. Total quarterly revenues of $5,047 million were also below expectations.
The lower-than-expected earnings suffered from a decline in cost productivity and inflation pressures in Digital Solutions. However, higher contributions from the Oilfield Services business unit offset the decline.
2Q22 earnings were disappointing because the company is not showing improvement despite higher commodity prices. Furthermore, inflationary pressure is starting to be an issue. CEO, Lorenzo Simonelli, said in the press release:
Our second quarter results were mixed as each product company navigated a different set of challenges ranging from component shortages and supply chain inflation to the suspension of our Russian operations…
… The demand outlook for the next 12 to 18 months is deteriorating as inflation erodes consumer purchasing power and central banks aggressively raise interest rates to combat inflation.
BKR Quarterly revenues per segment from 3Q21 to 2Q22 (Fun Trading)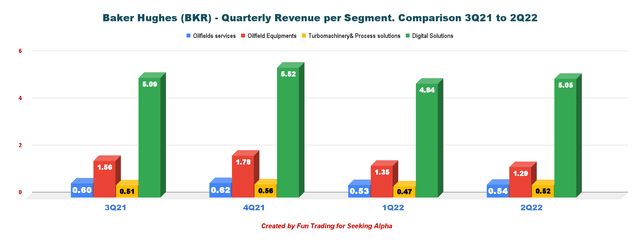
I regularly cover three companies in oilfield services. Baker Hughes is my third choice after Schlumberger (SLB) and Halliburton (HAL).
2 – Stock performance
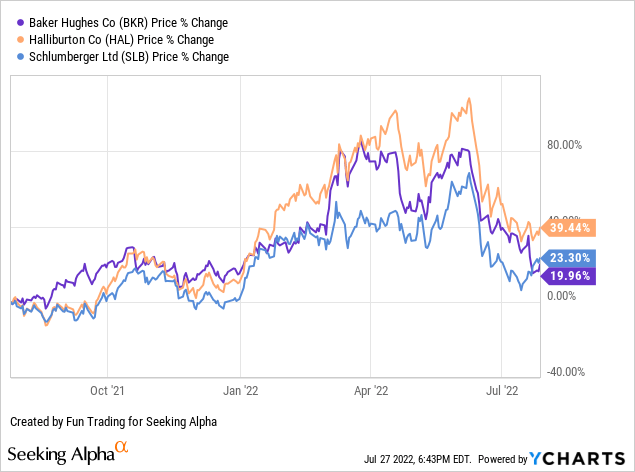
Baker Hughes and its peers have been doing quite well since the start of 2022. However, the sector quickly corrected in June. BKR is up 20% on a one-year basis underperforming its two main competitors slightly.
3 – Investment Thesis
BKR is a reliable oilfield services business that I recommend for a small long-term investment. However, the oilfield service provider is a highly cyclical sector that suffers from high volatility, which is always undesirable when you want to invest long-term. Recent history can illustrate this characteristic.
Thus, the investment thesis is similar to what I laid out for Schlumberger or Halliburton and involves a dual strategy.
As I regularly recommend to my subscribers in my marketplace, “The Gold and Oil Corner,” I firmly suggest trading short-term LIFO about 30%-40% of your long-term position to take advantage of the volatility and unforeseen events.
BKR is not my first choice in this segment but displays the same financial pattern as its peers. The balance sheet is solid, and potential positive growth in H2 2022 could lift the stock to higher levels. On the other hand, the market expects a recession in 4Q22, which could hurt oil demand, particularly among oilfield service providers. Invest with caution.
CEO, Lorenzo Simonelli, said in the conference call:
Our second quarter results were mixed as each product company navigated a different set of challenges ranging from component shortages and supply chain inflation to the suspension of our Russian operations. While OFS and TPS are managing through the current situation fairly well, OFE and DS have both experienced more difficulty.
Baker Hughes – Financials History: The Raw Numbers – Second Quarter of 2022
| Baker Hughes | 2Q21 | 3Q21 | 4Q21 | 1Q22 | 2Q22 |
| Total Orders in $ Billion | 5.09 | 5.38 | 6.66 | 6.84 | 5.86 |
| Total Revenues in $ Billion | 5.14 | 5.09 | 5.52 | 4.84 | 5.05 |
| Net Income available to common shareholders in $ Million | -68 | 8 | 293 | 72 | -839 |
| EBITDA $ Million | 409 | 538 | 1,055 | 528 | -321 |
| EPS diluted in $/share | -0.08 | 0.01 | 0.32 | 0.08 | -0.84 |
| Operating cash flow in $ Million | 506 | 416 | 774 | 72 | 321 |
| CapEx in $ Million | 121 | 198 | 266 | 268 | 226 |
| Free Cash Flow in $ Million | 385 | 216 | 508 | -196 | 95 |
| Total Cash $ Billion | 3.91 | 3.93 | 3.85 | 3.19 | 2.93 |
| Debt Consolidated in $ Billion | 6.77 | 6.76 | 6.73 | 6.69 | 6.66 |
| Dividend per share in $ | 0.18 | 0.18 | 0.18 | 0.18 | 0.18 |
| Shares Outstanding (Diluted) in Million | 806 | 857 | 899 | 948 | 1,001 |
Source: Company release
Historical data from 2015 is only available to subscribers.
Analysis: Earnings Details
1 – Revenues and other income were $5.05 billion in 2Q22
BKR Quarterly Revenues history (Fun Trading)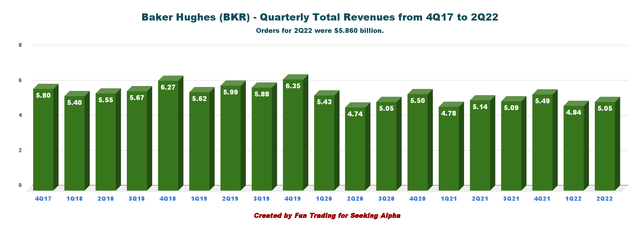
Revenues were $5,047 million this quarter, down 1.8% from the same quarter a year ago and up 4.4% quarter over quarter.
Adjusted operating income was $376 million for the quarter, up 8% sequentially and up 13% year-over-year.
Adjusted EBITDA was $651 million for the quarter, up 4% sequentially and up 6% year-over-year.
The company posted total costs and expenses of $5,072 million for the second quarter, up from the same quarter a year ago of $4,948 million.
Note: Orders this quarter were $5,860 million compared to $5,093 million in the same quarter a year ago.
BKR Quarterly revenues per segment history (Fun Trading)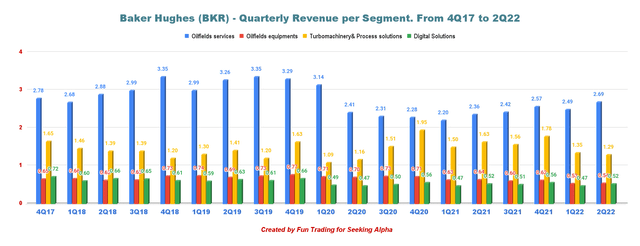
1.1 – Oilfield Services
Revenues were $2,689 million, up 14% from last year of $2,358 million. Operating income from the segment was $61 million, up from $171 million in the second quarter of 2021, due to higher volumes and prices.
1.2 – Oilfield Equipment
Revenues totaled $541 million, down 15% from the last year or $637 million. Lower volumes again hit the company’s Subsea Drilling Systems business. The segment reported a loss of $12 million from a profit of $28 million in 2Q21. The drop in volumes in the company’s subsea production systems and surface pressure control projects were to blame again, despite better results in flexibles and services.
1.3 – Turbomachinery & Process Solutions TPS
Higher equipment and service volumes decreased revenues to $1,293 million from $1,628 million a year ago. The segment income fell to $218 million from $220 million in the second quarter of 2021 due to lower services revenues.
1.4 – Digital Solutions
Process & Pipeline Services, Waygate Technologies registered higher volumes. Revenues were $524 million, up from $520 million last year. The segment operating profit was $18 million, down 28% from last year’s $25 million. Again, a decline in cost productivity and inflation pressure was to blame for this quarter.
1.5 – 2022 Outlook
Baker Hughes expects commodity prices to stay elevated due to a lack of investment in general and the sanctions imposed on Russia, a leading oil and gas producer. Based on this outlook, Baker Hughes believes that the company will have strong activity levels in H2 2022, especially in 3Q22.
Lorenzo Simonelli, Baker Hughes’ Chairman, and Chief Executive Officer, said in the conference call:
As we look to the second half of 2022 and into 2023, the oil markets face an unusual set of circumstances and challenges. On one hand, the demand outlook for the next 12 to 18 months is deteriorating, as inflation erodes consumer purchasing power and central banks aggressively raise interest rates to combat inflation.
On the other hand, due to years of underinvestment globally and the potential need to replace Russian barrels, broader supply constraints can realistically keep commodity prices at elevated levels, even in a scenario of moderate demand destruction.
2 – Free cash flow was $95 million in 2Q22
BKR Quarterly Free cash flow history (Fun Trading)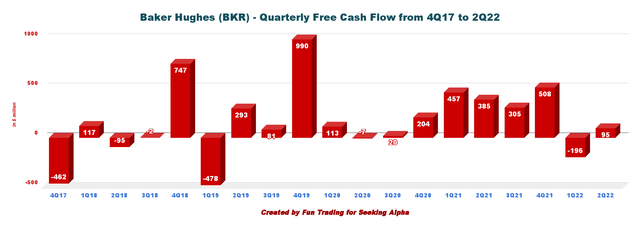
Note: Generic free cash flow is cash flow from operations minus CapEx. The company’s free cash flow differs (gain of $147 million). The difference comes from the CapEx determination. The company adds proceeds from the disposal of assets. In 2Q22, it was $174 million.
Trailing 12-month free cash flow came in at $625 million, and the company had a free cash flow of $95 million for 2Q22.
This quarter, the quarterly dividend is unchanged at $0.18 per share or an annual cash payment of $721 million. The dividend yield is now 2.87%.
3 – The net debt was $3.73 billion in 2Q22
BKR Quarterly Cash versus Debt history (Fun Trading)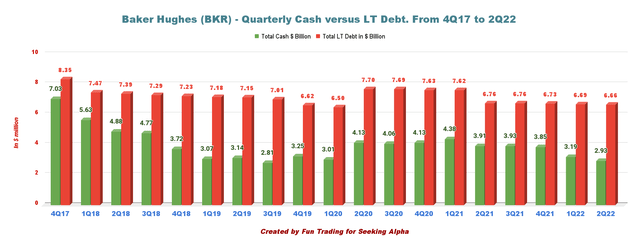
As of June 30, 2022, the company had cash and cash equivalents of $2,928 million, down significantly from $3,913 million in the second quarter of 2021.
At the end of the second quarter, Baker Hughes had long-term debt of $6,659 million (including $34 million in current debt), down sequentially from $6,685 million, with a debt to capitalization of 30.6% from 28.9% the preceding quarter (see chart above).
Technical Analysis (short-term) and Commentary
BKR TA Chart short-term (Fun Trading)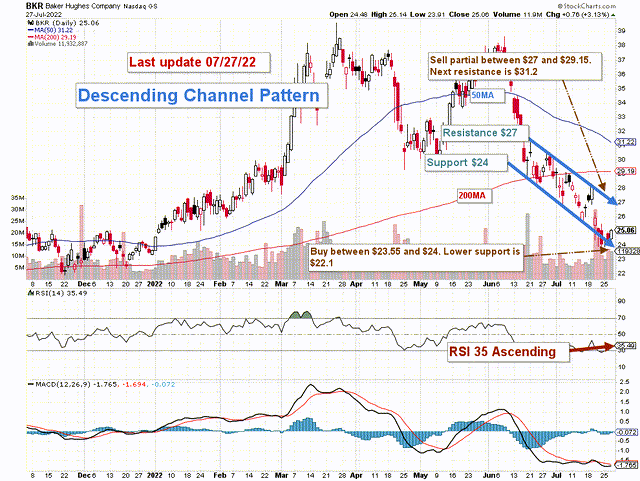
Note: The chart includes the effect of the dividend.
BKR forms a descending channel pattern with resistance at $27 and support at $24. The channel formation can be of two types: bullish and bearish. It is better to trade the channel as a continuation pattern in this case.
The general strategy that I usually promote in my marketplace, “The Gold and Oil Corner,” is to keep a core long-term position and use about 30%-40% to trade LIFO while waiting patiently for a higher final price target to sell your core position above $31.
I recommend selling partially between $27 and $29.15 (200MA) and potentially waiting for a test at $31 in case of solid momentum. Conversely, it is reasonable to buy back on any weakness below $24 with potential lower support at $22.1.
As I always recommend, trading LIFO is an excellent way of trading your long core position, and it is the strategy I encourage because it is the best adapted to gold and oil stocks.
You may potentially experience a higher tax rate burden, but it will net you a much higher gain overall while lowering the risk. Above all, avoid selling at a loss! Trading LIFO will prevent you from making this costly mistake.
Note: The LIFO method is prohibited under International Financial Reporting Standards (IFRS), though it is permitted in the United States by Generally Accepted Accounting Principles (GAAP). Therefore, only US traders can apply this method. Those who cannot trade LIFO can use an alternative by setting two different accounts for the same stocks, one for the long term and one for short-term trading.
Warning: The TA chart must be updated frequently to be relevant. It is what I am doing in my stock tracker. The chart above has a possible validity of about a week. Remember, the TA chart is a tool only to help you adopt the right strategy. It is not a way to foresee the future. No one and nothing can.
Author’s note: If you find value in this article and would like to encourage such continued efforts, please click the “Like” button below as a vote of support. Thanks.


Be the first to comment