

damircudic
The Avantis U.S. Small Cap Value ETF (NYSEARCA:AVUV) has shown strong recent performance, with a 16.0% p.a. 3-Yr return vs. 8.1% for the Russell 2000 Value Index. This outperformance is driven by its large overweight in energy companies. However, it is unclear whether AVUV’s outperformance is sustainable over the long-run, as it appears to have not followed its own rules in 2020 when it maintained a sizeable weight in energy companies despite their poor profitability at the time.
Fund Overview
The Avantis U.S. Small Cap Value Fund gives investors exposure to U.S. small-cap companies that are trading at low valuations and high profitability. The fund has $4.5 billion in AUM and charges a 0.25% expense ratio.
Strategy
The AVUV ETF is an actively managed ETF that invests primarily in U.S. small-cap companies the portfolio manager deems to have high ‘profitability’ and exhibit ‘value characteristics’. To determine ‘value’, the portfolio manager mainly looks at price to adj. book value while ‘Profitability’ is mainly adjusted cash flow from operations to book value. However, the portfolio manager may also use other metrics to determine eligibility into the portfolio.
The weighting of securities in the portfolio is determined by the securities’ market capitalization relative to that of other eligible securities. Securities are disposed of when they no longer meet the profitability, value characteristics or market capitalization requirements of the portfolio manager.
The fund may invest in common stock, preferred stock, or other equity-equivalent securities such as convertible securities or derivatives.
Portfolio Manager Deserves Mention
Although American Century is the fund sponsor and administrator, the actual portfolio management is conducted by Avantis Investors. Avantis Investors is led by CIO Dr. Eduardo Repetto, a literal rocket scientist with a Ph.D. in Aeronautics. Avantis aims to combine the best of passive and active investing with portfolios that are broadly diversified like passive funds but benefiting from active security selection.
Portfolio Holdings
The AVUV portfolio has almost 700 positions and the top 10 holdings account for 8% of the fund. Relative to the Small-Cap Value category, the AVUV fund is overweight consumer cyclicals, financial services, and energy companies. It is underweight real estate, technology, healthcare and utilities (Figure 1).
Figure 1 – AVUV portfolio characteristics (morningstar.com)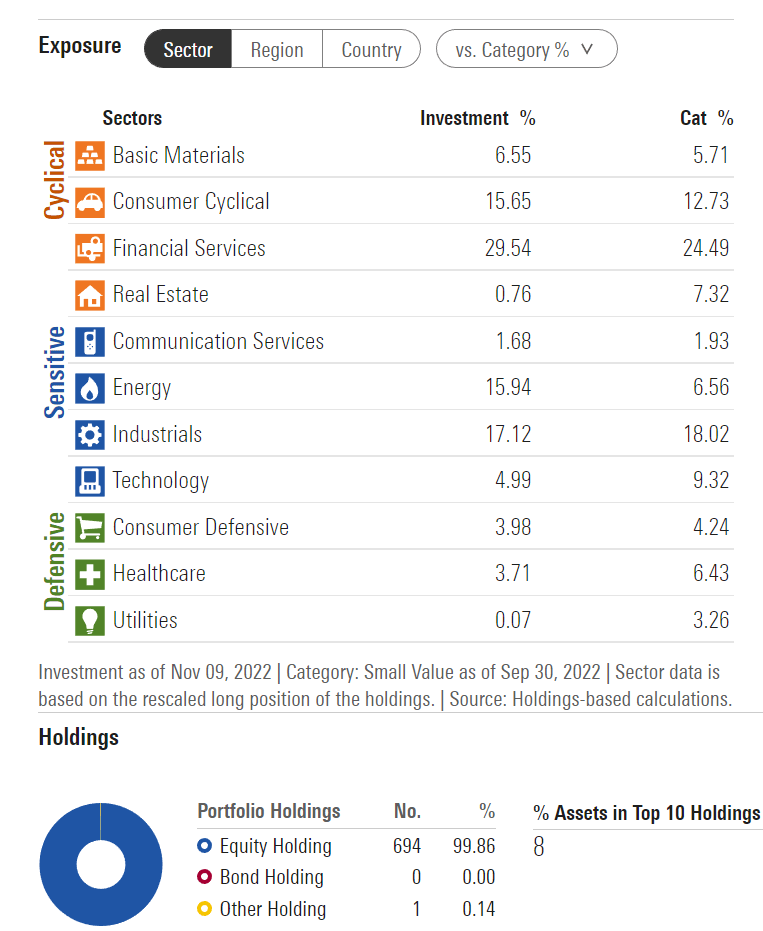
Returns
The AVUV ETF’s performance has been very strong, with a YTD return of -3.1% to October 31, 2022, significantly outperforming its benchmark, the Russell 2000 Value Index which has declined 11.2% YTD. On a 3Yr timeframe, the AVUV ETF has returned 16.0% p.a. vs. 8.1% for the index (Figure 2).
Figure 2 – AVUV performance (avantisinvestors.com)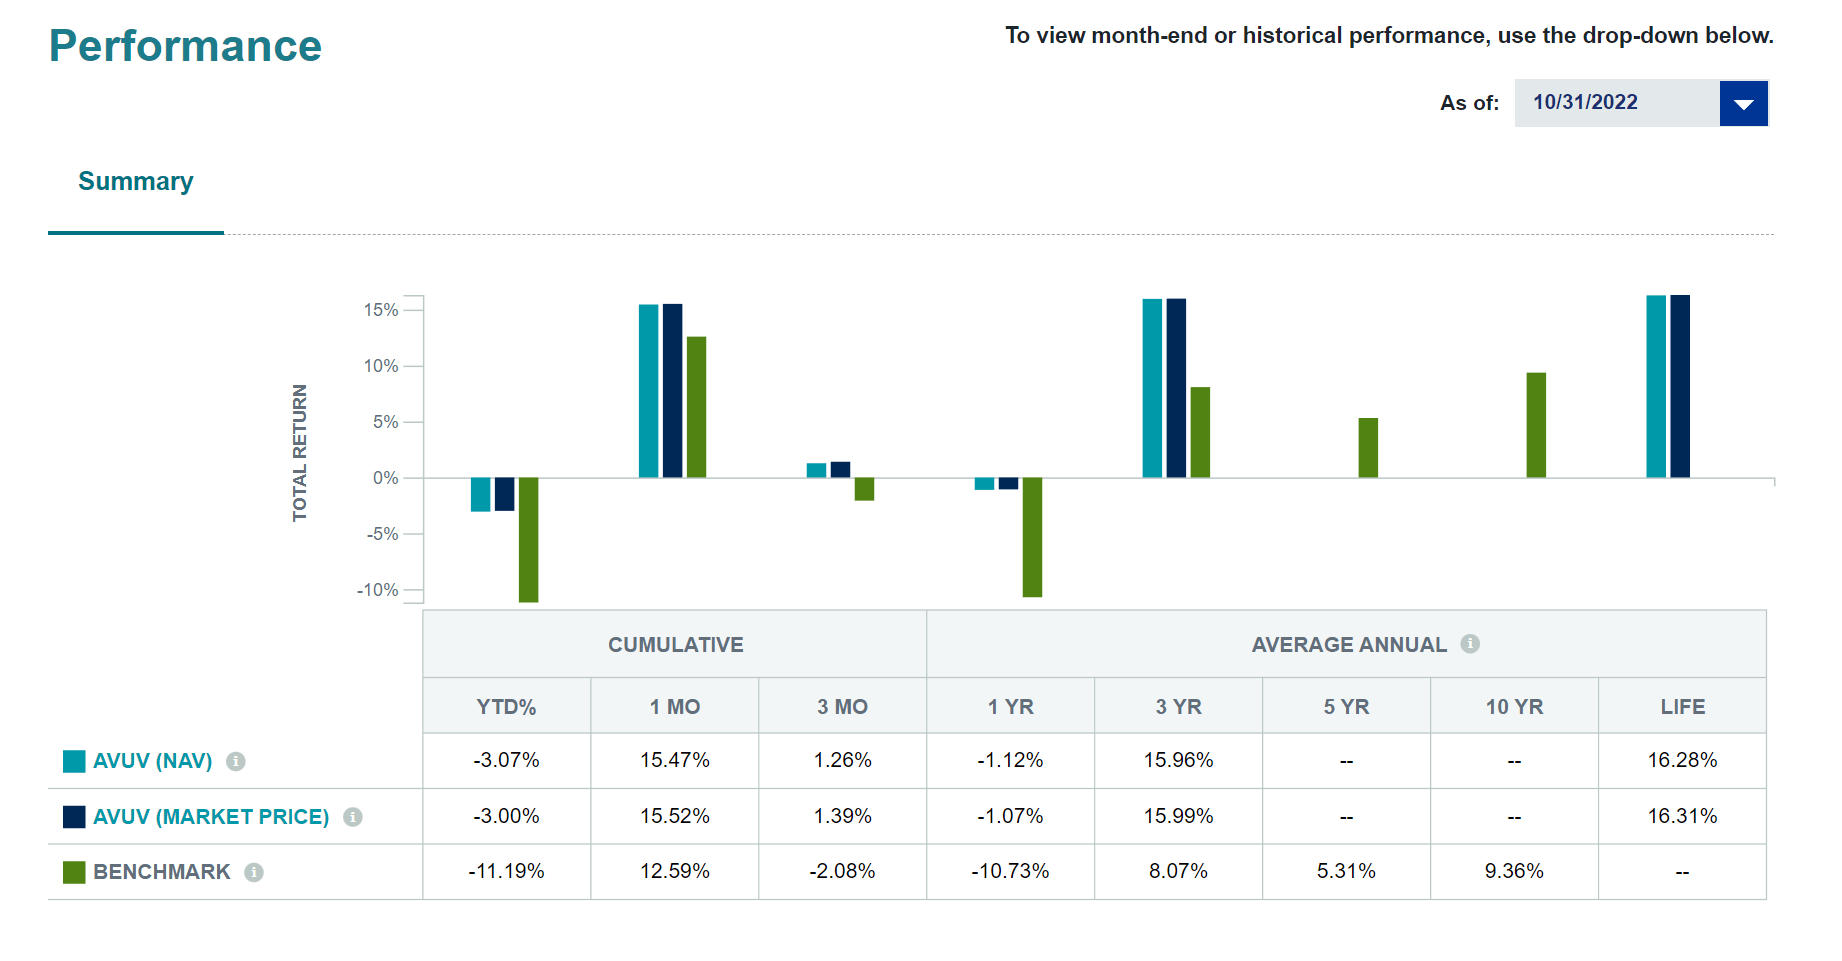
AVUV’s performance has no doubt been aided in recent quarters by the fund’s heavy weight in energy companies, at 15.9% of the portfolio vs. 6.6% in the index. Since bottoming in March 2020, energy companies, as represented by the SPDR S&P Oil & Gas Exploration & Production ETF (XOP) has returned over 400%, far outperforming the iShares Russell 2000 Value ETF (IWN) (Figure 3).
Figure 3 – Energy stocks have outperformed since COVID bottom (Seeking Alpha)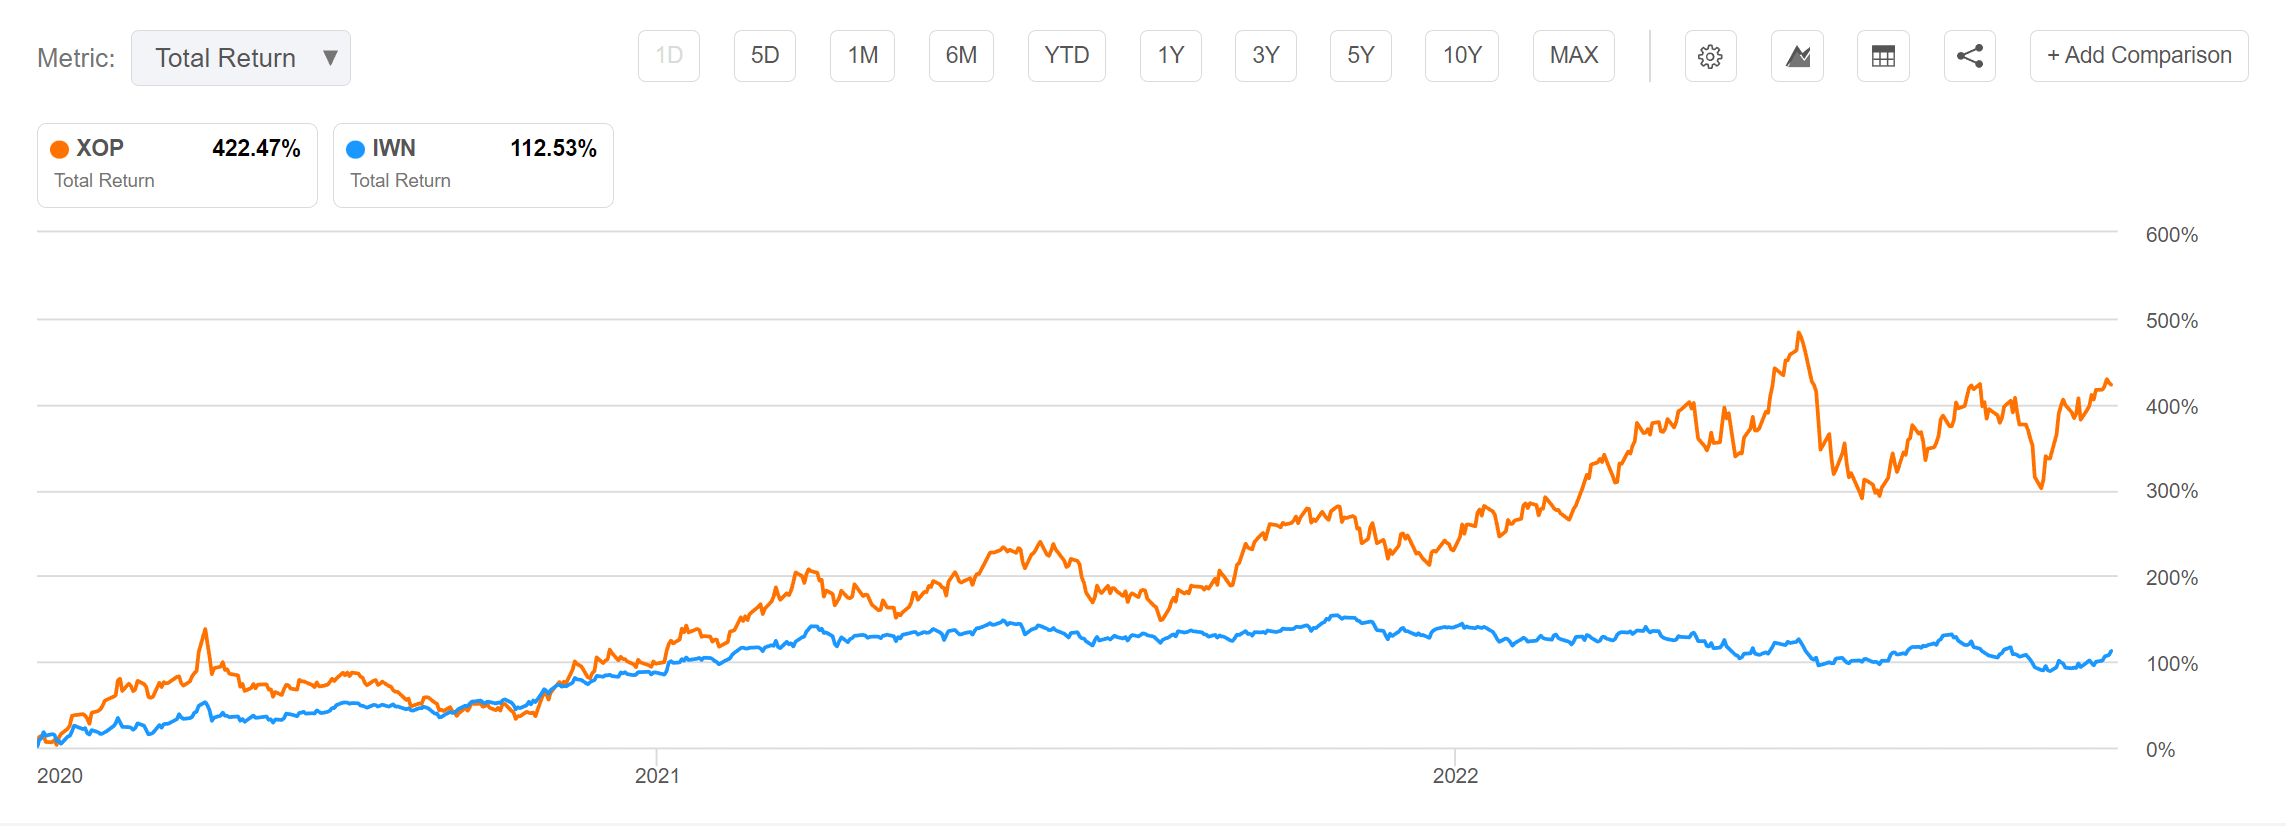
AVUV vs. IWN
Using Portfolio Visualizer to analyze AVUV’s historical performance relative to the Russell 200 Value Index, as represented by IWN ETF, we can see that although the AVUV ETF does have far superior returns (16.4% CAGR vs. 8.6% CAGR from October 2019 to October 2022), it is also more volatile (31.5% Stdev vs 27.1%). AVUV also had a larger max drawdown of -42.4% vs. -35.8% for IWN, which occurred during early 2020 (Figure 4).
Figure 4 – AVUV vs. IWN (Author created using Portfolio Visualizer)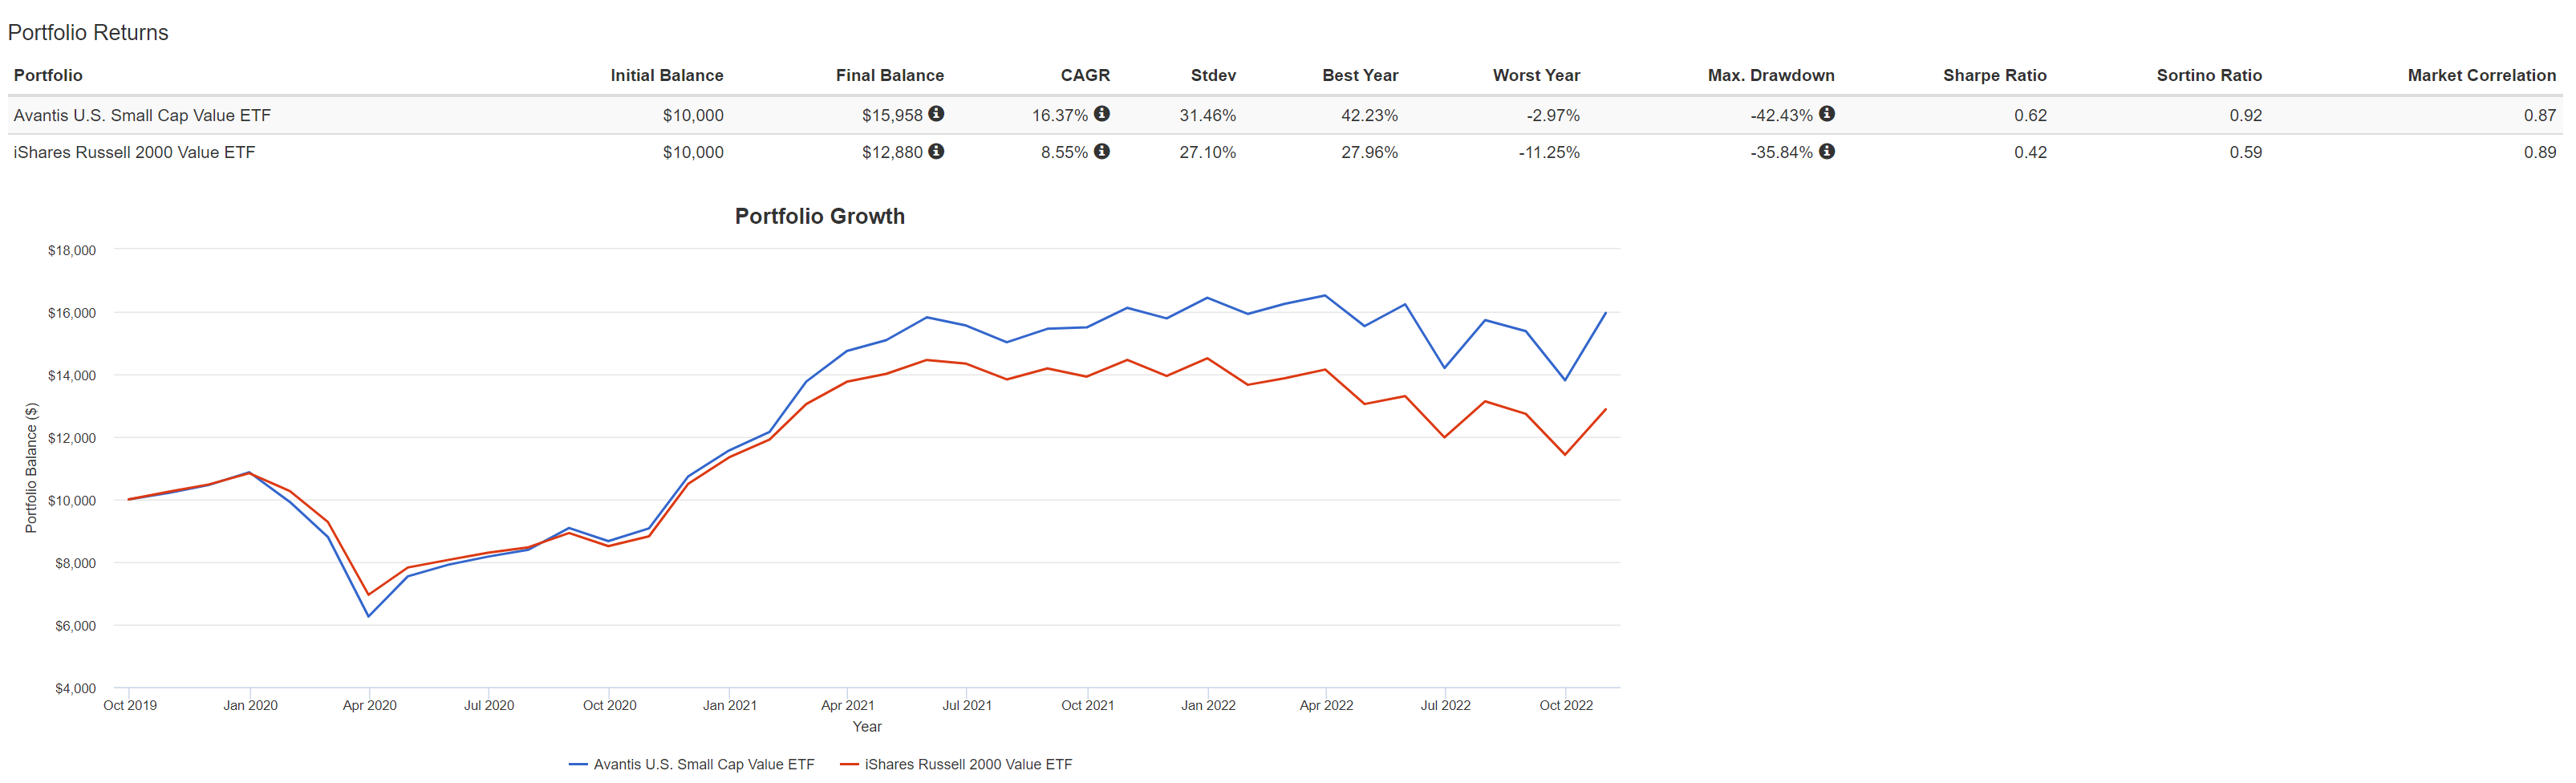
Need More Time To Properly Judge AVUV
Unfortunately, without a longer history of performance data to analyze, it is difficult to determine whether AVUV’s 3-year return outperformance is due to skill or luck.
For example, looking at AVUV’s Semi-Annual report from February 2020, we can see that the AVUV ETF had a sizeable weight in energy companies in early 2020, at 7.3% of the fund (Figure 5).
Figure 5 – AVUV top holdings, February 2020 (AVUV Semi-annual report, February 2020)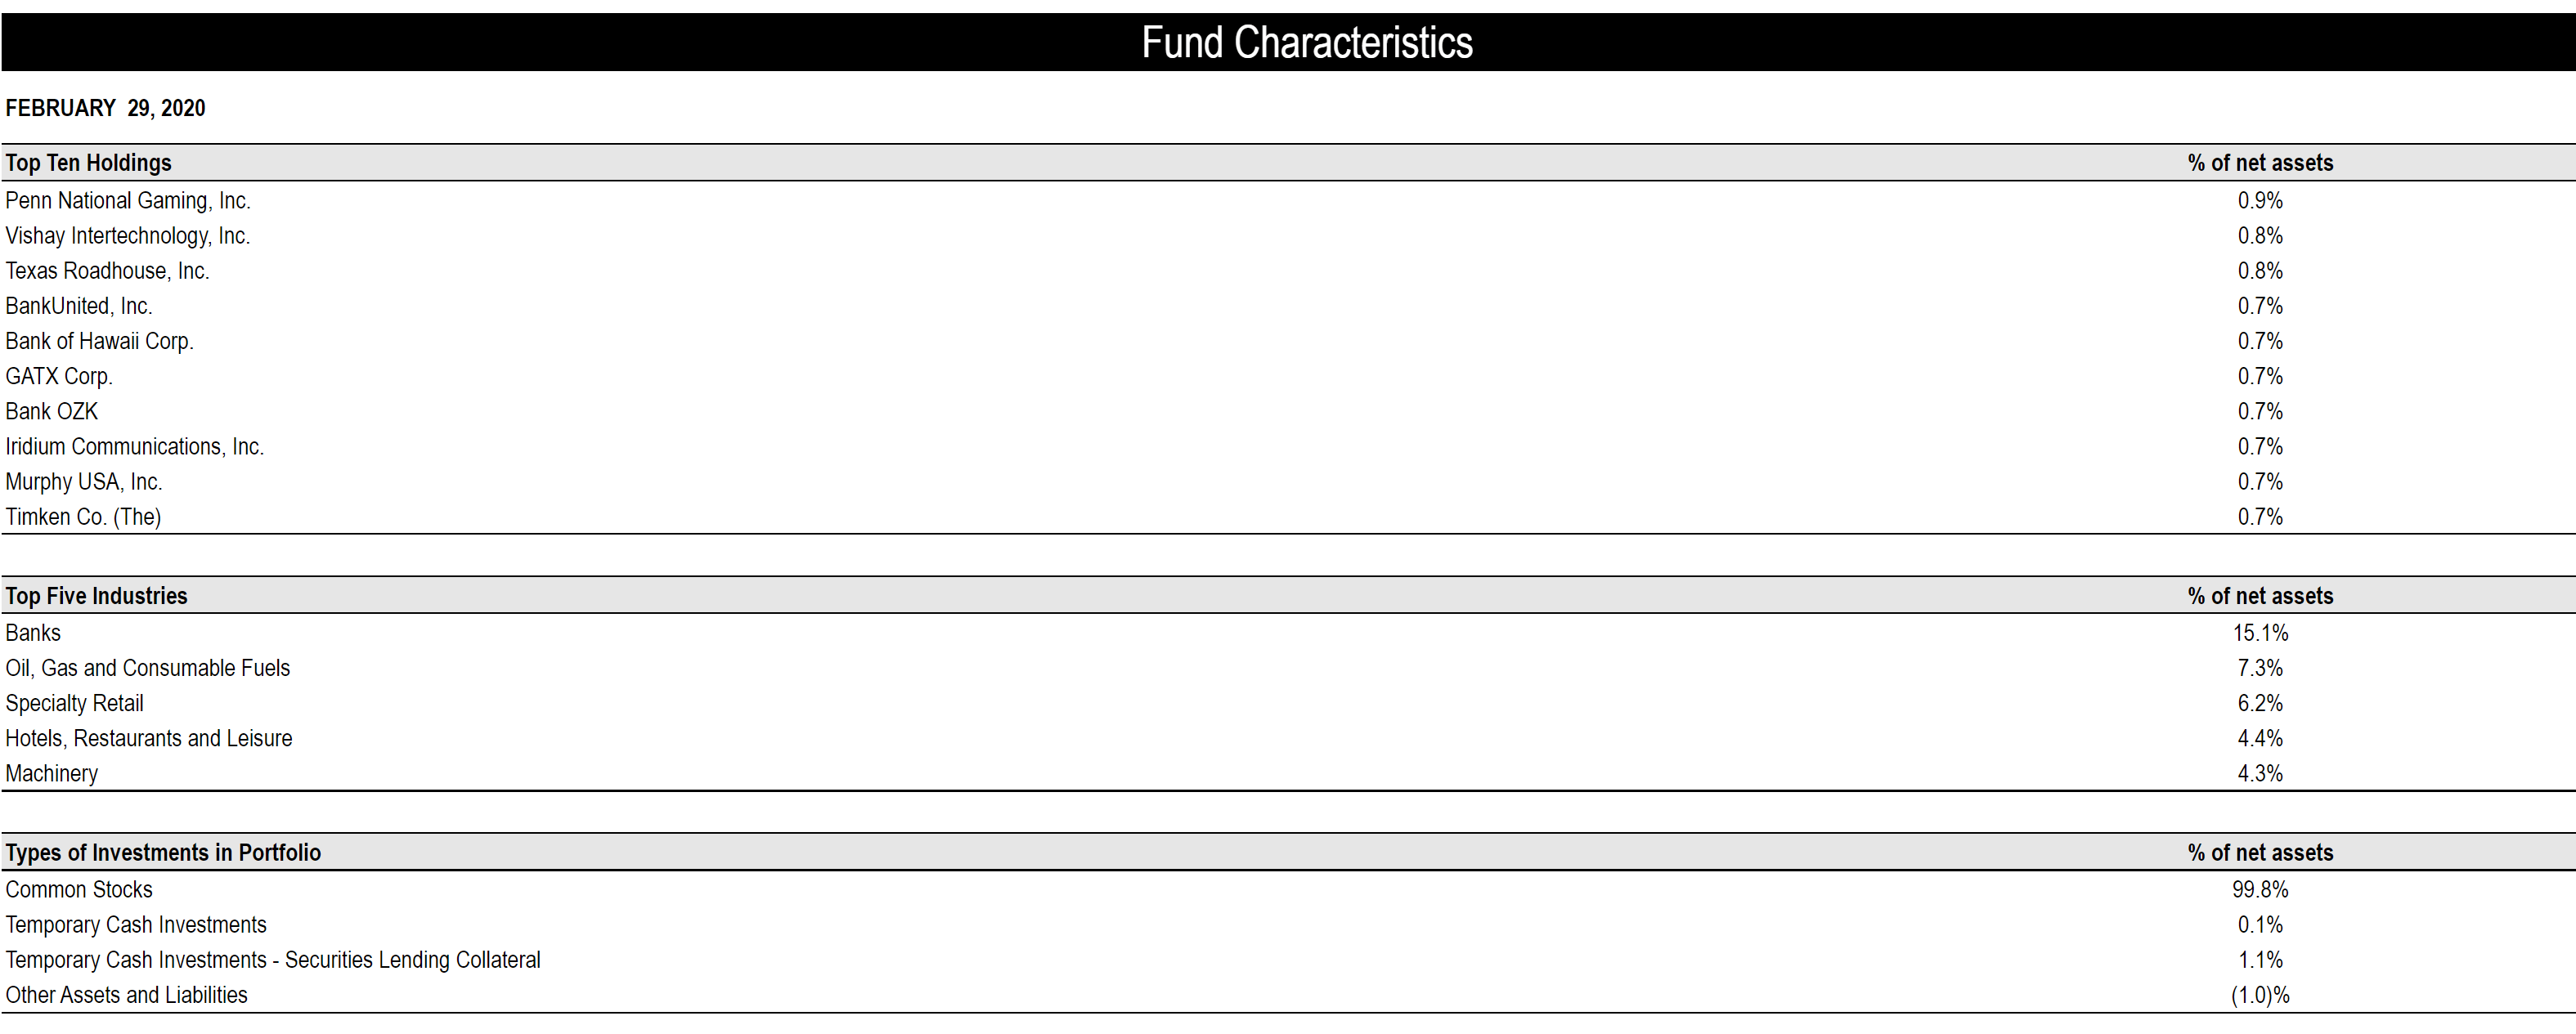
While energy has been a top performing sector in the past two years, investors need to bear in mind that the energy landscape was vastly different in early 2020. U.S. oil and gas companies had a ‘growth at any cost’ mentality and Saudi Arabia was engaged in a price war with Russia. Energy sector profit margins were low (6% profit margin compared to 12% for the S&P 500 at the time), and profitability was declining due to falling energy prices (Figure 6).
Figure 6 – S&P 500 Energy margins (yardeni.com)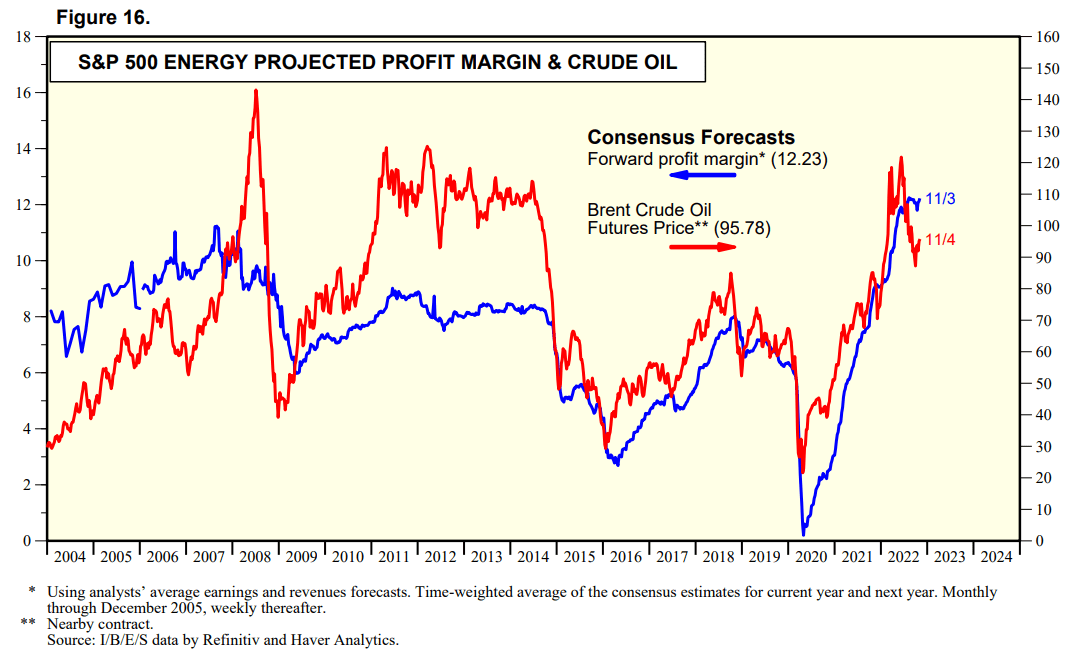
Using the fund’s security selection methodology described in the strategy section above, the AVUV ETF should have been underweight energy in early 2020 as profitability was poor.
AVUV’s large weight in the energy sector is probably the reason why the fund suffered a 42.4% drawdown vs. -35.8% for the index in early 2020, as energy companies were clobbered during the COVID pandemic.
Furthermore, as the world was undergoing COVID lockdowns and global energy consumption outlook was highly uncertain, AVUV’s energy weight actually increased by August 31, 2020, to 8.8% of the fund (Figure 7).
Figure 7 AVUV top holdings, August 2020 (AVUV Annual report, August 2020)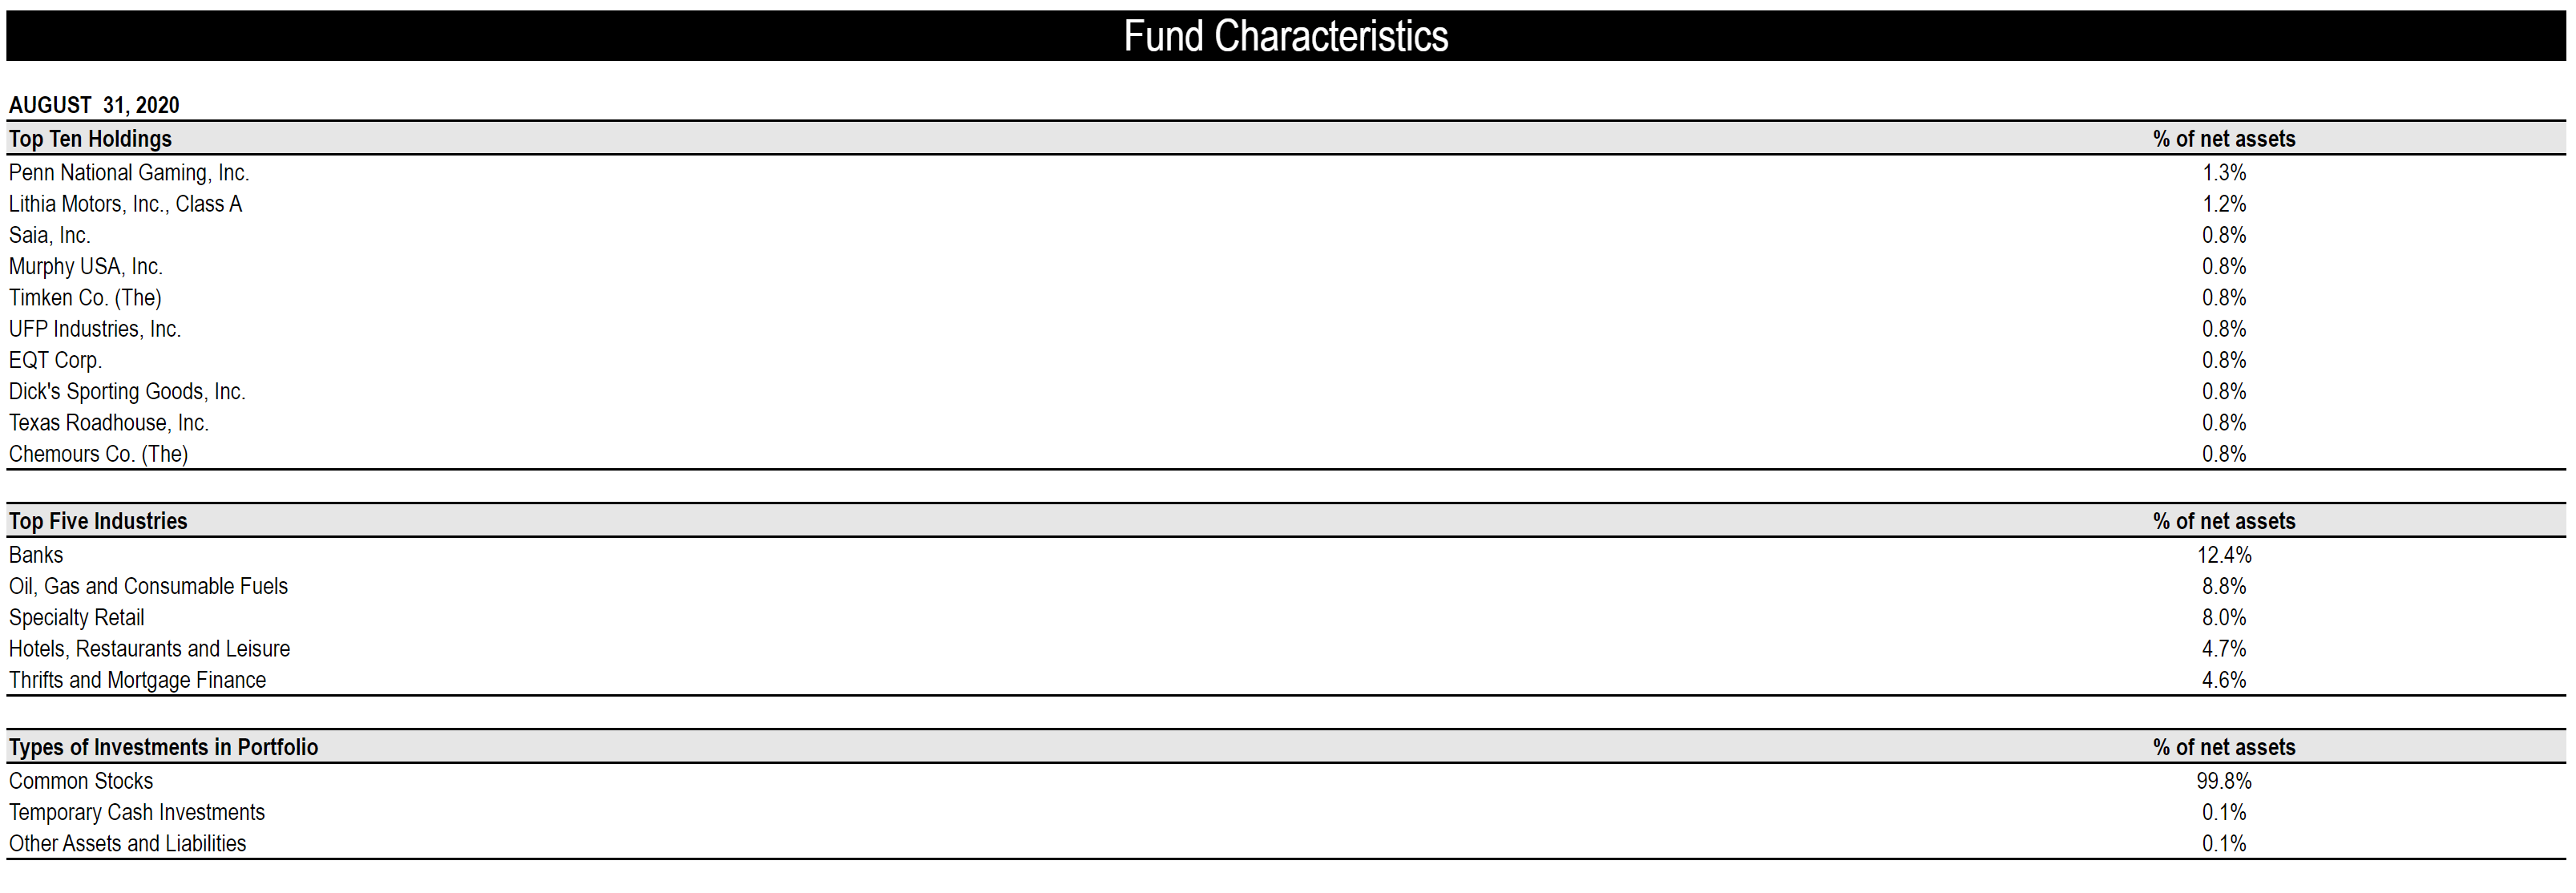
While the portfolio manager’s conviction is highly commendable and was proven right in hindsight, it was completely counter to the fund’s stated strategy of focusing on profitability and value. At that point in time (August 2020), many energy companies were near insolvency due to low energy prices.
Distribution & Yield
The AVUV pays a modest distribution of $1.36 / share in the past 12 months for a 1.7% distribution yield. AVUV’s distribution is paid quarterly and is variable.
Conclusion
In summary, the AVUV ETF has shown strong recent performance, with a 16.0% p.a. 3-Yr return vs. 8.1% for the Russell 2000 Value Index. This outperformance is driven by its large overweight in energy companies. However, it is unclear whether AVUV’s outperformance is sustainable over the long-run, as it appears to have not followed its own rules in 2020 when it maintained a sizeable weight in energy companies despite their poor profitability at the time.
Be the first to comment