

MF3d
Investment summary
Following a rapid shift in price action and recent earnings downgrade, I’ve moved my position on Avantor, Inc (NYSE:AVTR) to hold. At present, I advocate against allocating additional/initial capital despite the attractiveness of it trading at 23x P/E and 17.5x FCF – well below historical averages.
I want to make this clear: we are still long-term bullish on AVTR. I’m just advocating to withhold from allocating right now. Selective opportunities are on the horizon in this name. However, market pundits have a lot to work through. AVTR has been heavily punished in FY22 on the back of the SPX’s delta, alongside management’s narrowed FY22 guidance.
Right now, I’m watching price action in AVTR to understand where to head with risk and sizing, having already wound back the position by ~70% this year amid the heavy drawdown. Nevertheless, there will be opportunity in the name once again for those who are patient, in my estimation.
AVTR full-year guidance narrowed at the bottom-line
Crucial to the investment debate is AVTR’s forward earnings guidance. Management narrowed GAAP and non-GAAP EPS range for FY22 in the earnings call. It now expects EPS growth of 250-300bps or $1.38-$1.40, down from $1.43-$1.49.
Several bottom-line headwinds explain the forecast. First is a c.200bps / $0.30 per share impact from its M&A outlook, with another 200bps of organic growth decline baked into the guidance.
Further headwinds noted as “risk in European macroenvironment, as well as excess inventory in select lab consumable categories” are set to be dilutive to EPS as well. Chief amongst these is the retirement of Covid-19-related revenues, a previous mid-term growth driver. Another 330bps base effect to EPS from forex headwinds is also projected. Forex headwinds are also tipped to reduce revenue growth by 200-300bps in FY22.
Question is, what impact this has to the outlook down the line? In my estimation, not a great deal. Looking at quarterly numbers from FY23-FY24, it’s not unreasonable to expect a double-digit growth in GAAP earnings, with acquisition benefits and revenue upsides. Reconciling to non-GAAP estimations yields similar medium-term results.
Hence, it really is a question of whether the market has overshot its run on AVTR, or if there’s more yet to be discounted into the stock price. Alas, despite these projections, from the price action discussed below, probabilities are there’s more downside to come before AVTR finds its floor.
Exhibit 1. Forward estimates still suggest strong quarterly earnings growth from FY23 [GAAP & non-GAAP]
Note: All figures in $mm, $/share or [%] where relevant. (Data: HB Insights Estimates)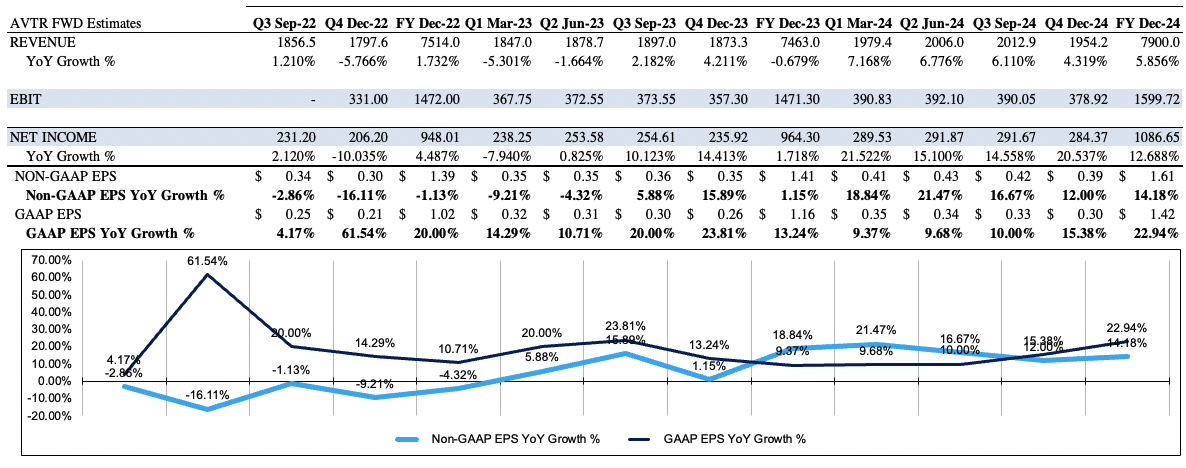
AVTR price evolution drifts to new lows
Ceteris paribus, AVTR longs have witnessed a substantial loss on returns achieved across the pandemic era [FY20-FY21 total]. As seen in the chart below, AVTR endured extensive upside after the March FY20 selloff. It was a star performer in our equity budget across the year. Shares have since corrected from this point and pulled back heavily amid a >50% drawdown.
Simply, the high beta trade has unwound completely in FY22. Investors unloaded AVTR shares this year in tandem with this trend. Moreover, the equity beta premium AVTR once received has wound back since mid-FY21, as seen below. Thus, the June bounce in broad equities wasn’t felt for AVTR shareholders.
With this downtrend, AVTR has continued its selloff whilst the SPX has formed a fairly rigid base from the last 3-months of trade. Alas, despite the numerous fundamental insulators I have identified in previous analyses on AVTR [See: here, also here, additionally here, and here], market mechanics have outweighed the order book resulting in heavy downside in FY22.
Exhibit 2. Bifurcation of AVTR from SPX as covariance structure shifts down as investors continue unwinding high-beta plays
Note: Daily total price return (Data: Updata)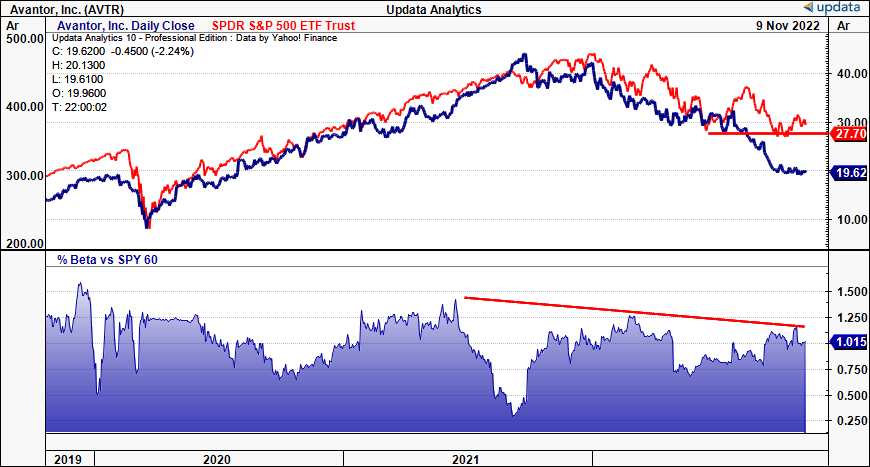
Exhibit 2 shows AVTR’s weekly bars from March FY21 to date. The first sell indication for me came when the stock showed large upside volume with a deep red bar in September FY21.
In the weeks following, shares consolidated to the 50DMA, and the subsequent declining volume trend [shown below] was matched with a tight, flat base in price distribution. Shares tested the 50DMA for a total 10 weeks at this point, whilst weekly volume declined substantially. Important: the poor volume with sideways price action, whilst testing this 50DMA, is indication of heavy resistance in my experience. This resulted in us trimming the position size by 50%.
Looking to current price action [November], it remains bearish in my estimation. Price evolution continues to unwind toward pre-pandemic levels, with distribution pulling further away from the 50DMA and resistance line shown below. As weekly volume increases, so too does the gradient of price decline, suggesting there’s more force and momentum into the move, along with further penetration of the short side of the order book.
Exhibit 3. Poor volume with pullback to 50DMA originally signaled selling point. Additional volume spike in September FY22 with heavy drift from resistance signals additional reduction sizing.
Note: Weekly bars, total price return. (Data: Updata)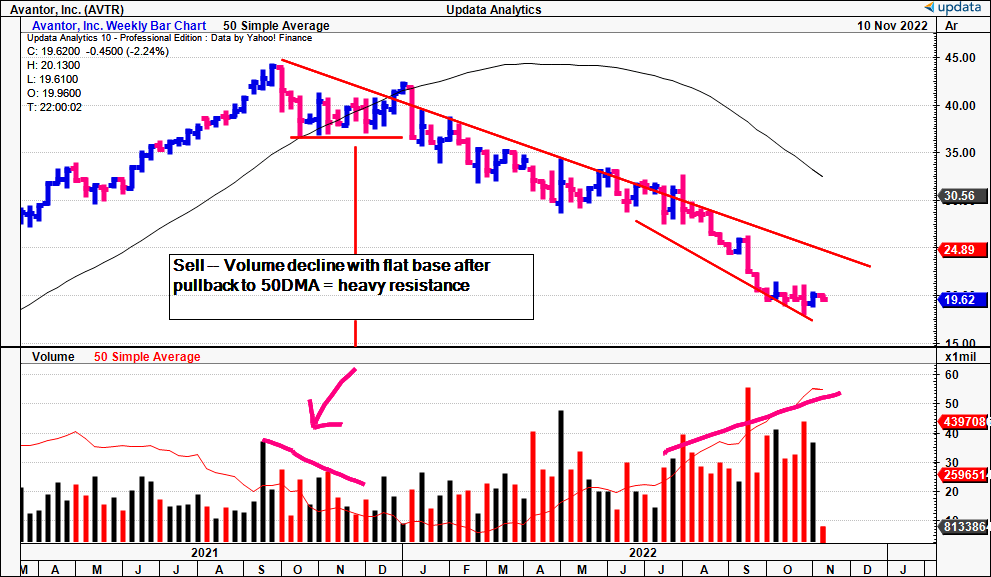
Price action looks unsupported at its current levels and long-term trend indicators [on-balance volume (“OBV”), momentum] suggest further downside could be warranted. OBV in particular remains in a continued downtrend, which is important information. Whilst broad equities caught a strong big in the June bounce in markets, AVTR’s OBV tracked south in divergence from the market trend. Naturally selling pressure continues from this point until date, as seen below.
Exhibit 4. During the June bounce in broad equities AVTR’s OBV drifted to the downside in direct divergence from the market trend
Data: Updata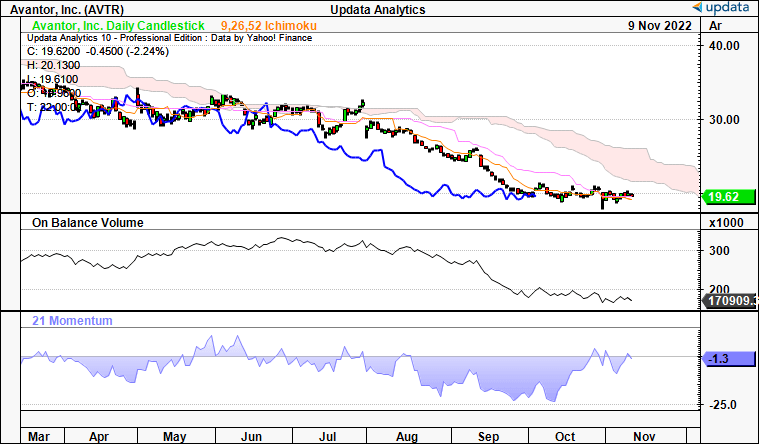
Q3 earnings indicative of FY23 trends
AVTR’s third quarter numbers were mixed and illustrate potential headwinds looking ahead. Revenue of $1.85 Billion (“Bn”) came in ~100bps higher YoY, decompressing gross margin by 150bps YoY to 35%. Accretion to gross margin looks to be driven by acquisition tailwinds, per management. As such, quarterly operating profit of $275.8mm grew 16.2% YoY. This pulled down to a marginal 416bps YoY growth in EPS to $0.25. Notably, AVTR’s weighted average number of shares outstanding increased 85.6mm to 674.1mm YoY as well.
From examination, Q3 operating trends remained in-line with longer-term averages, as seen in Exhibit 4. Quarterly free cash flow margin remained within range at ~12% of turnover, whilst operating profit and gross profit were each up YoY as well, despite rolling off highs in sequential declines from Q1 FY22. Nonetheless, investors can now allocate to AVTR at a 5.7% FCF yield – which ranks in its 99th percentile of its historical ranges since listing in FY19.
Exhibit 5. Even as quarterly operating trends have curled down from Q1 FY22 highs, FCF margin [revenue] remains in double-digits, with YoY growth in operating profit
Data: HB Insights, AVTR SEC Filings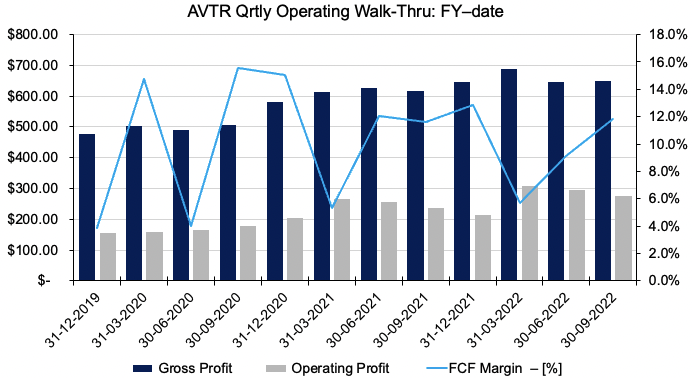
Trends in FCF conversion and return on invested capital (“ROIC”) remain within range as well, as seen in the chart below. Free cash conversion continues to remain in a cyclical uptrend for AVTR and TTM ROIC came in at 8.2% last quarter, in-line with 2-year average of 8.9%. The number is important as quarterly CapEx widened to $39mm [vs. 2-year average $27.4mm] and invested capital decreased ~15.5% YoY to $5.8Bn.
This coupling in free cash and ROIC tells me the company continues to derive sufficient return from its investments – but it needs to improve here to outpace the WACC hurdle of 9.3%. Currently it runs an economic loss at that ROIC/WACC spread of $23.22mm.
Exhibit 6. Return on capital and FCF trends continue to merge higher demonstrating good return in this capital budgeting cycle
Data: HB Insights, AVTR SEC Filings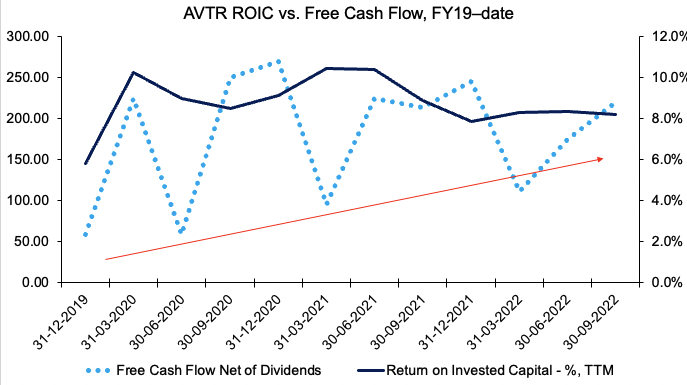
Valuation and conclusion
In valuing AVTR the way I did I noticed there’s a disconnect between fundamental and technical price targets. Price objectives obtained from point and figure charting below suggest a downside target to $16.25, or 17.2% downside from the current market price.
Our EPS estimates [shown in Exhibit 1] imply FY22 EPS of $1.39 which implies the stock should trade at a fair forward P/E of 20.9x, well above consensus’ 14x forward earnings [Exhibit 8]. At this multiple, AVTR is valued at $29. The premium implies EPS upside that sits above consensus estimates, and thus represents an alpha opportunity.
Problem is the breadth between the two valuations [$16.25-$29], a total of $12.75, placing less confidence on the upper bound. The arithmetic mean of the 2 targets is $22.62, a range familiar to AVTR over the past 2-3 months.
With this in mind, my upside target is to $29, downside to $16.25 and a range of $22.25. In either scenario, near-term upside for AVTR appears unlikely, and this means I advocate to hold on allocating additional/initial capital to AVTR shares.
Exhibit 7. Downside targets to $16.25 after just taking out $19.25
Data: Updata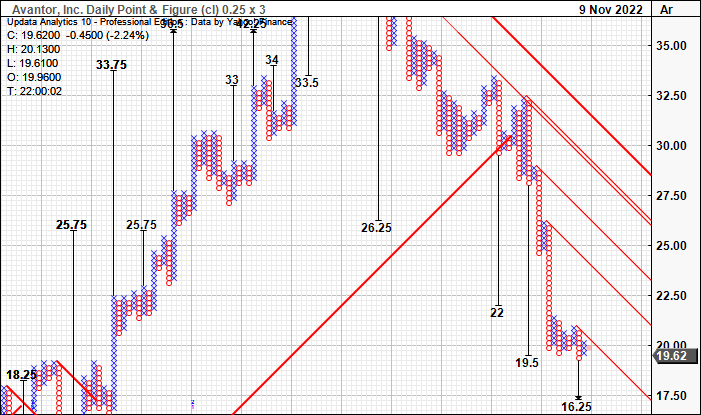
Exhibit 8. Upside target to $29 based on bottom-line fundamentals, forward estimates
Data: HB Insights Estimates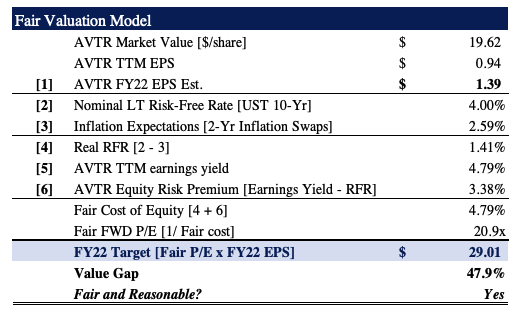
Net-net, the long-term buy thesis remains unchanged for AVTR based on ongoing fundamental momentum and EPS upside. This is evidenced by its measures on ROIC, FCF growth and forward earnings estimates. What’s unsupportive is market technicals that suggest further downside in AVTR is likely, before any reversion to the upside. I believe shares are fairly priced at 20.9x earnings, a push above market consensus’ 14x earnings, and just below its current P/E of 23.1x. Alas, whilst I continue to rate it a buy, at the present, I advocate against allocating to Avantor, Inc., hence hold.
Be the first to comment