

Drazen_
Introduction
I last wrote about Autodesk, Inc (NASDAQ:ADSK) and Bentley Systems, Incorporated (NASDAQ:BSY) in a December 15, 2021, article. In this follow-on article, I will provide an update and outlook on the investment thesis I put forth in my previous article. I have summarized the thesis in figure 1, but I strongly encourage you to refer to the original article for additional context.
Figure 1: Summary of the investment thesis from my December 2021 article
|
Thesis |
Update |
Outlook |
|
1. Strong tailwinds from long-term secular growth due to the need for more and infrastructure and buildings around the world |
Spending slowing in some sectors (e.g., office buildings) but strong in others (e.g., warehouses, transportation infrastructure, water projects) |
Industry forecasts near-doubling of construction by 2030 to $14-15 trillion, but there is risk of a near-term slowdown if the economy enters a recession |
|
2. Construction is a highly complex and customized process that is hampered by inefficiency and low productivity improvements |
Productivity improvements continue to be limited |
Construction cost inflation will force builders to improve efficiency by adopting digital technologies |
|
3. The AEC software industry has highly attractive risk-adjusted return characteristics, including:
|
I have provided additional data in this article to support some of these characteristics |
These economic characteristics are unlikely to change in the foreseeable future |
|
4. Autodesk and Bentley will grow because of long-term secular tailwinds, the industry’s imperative to improve productivity, and clients’ need to keep up with their competitors |
Growth has continued but decelerated |
I expect both companies to continue growing over the long term |
|
5. Valuation was full on a free cash flow yield basis:
|
Following the market pullback:
|
As long-term fundamentals do not appear to have changed, this may be a better opportunity for long term investors to increase their positions |
Source: Author
Even though recent economic news portends near-term volatility, I believe my long-term thesis remain intact. I will provide an update on my thesis and outlook on construction spending in the U.S.
1. Strong tailwinds from long-term secular growth
Construction industry growth forecasts
Oxford Economics forecasted in its Global Construction 2030 report that the global construction market will grow 85% to $15.5 trillion by 2030, with three countries-China, U.S., and India-accounting for 57% of all global growth. In addition, the report forecasted that the US construction market will grow faster than China over next 15 years, India will provide a new engine of global growth for construction in emerging markets growing at almost twice as fast as China, and that the UK will be continental Europe’s stand-out growth market, overtaking Germany to become the world’s sixth largest construction market by 2030
Statista data corroborates Oxford Economics’ market growth projections, forecasting that global construction will almost double to $14.4 trillion by 2030 (figure 2).
Figure 2: Statista global construction growth projections
Statista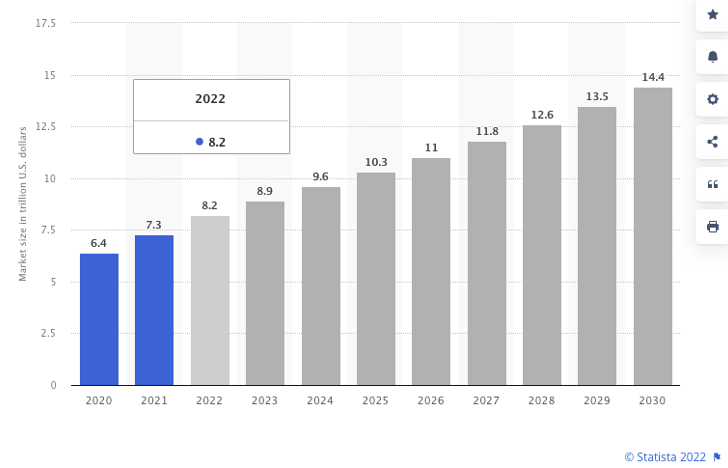
2. Low productivity improvements and inflation in construction
Productivity improvements in construction remain slow, but strong inflationary pressures will force owners and builders to speed up the adoption of digital technologies in order to reduce costs.
Productivity improvements remain slow
According to McKinsey and company, productivity in manufacturing, retail, and agriculture, as measured by gross value per hour worked, has grown by as much as 1500% since 1945. In contrast, productivity in construction has barely increased (figure 3, orange line).
Figure 3: Productivity improvements across industries since 1945
McKinsey and Company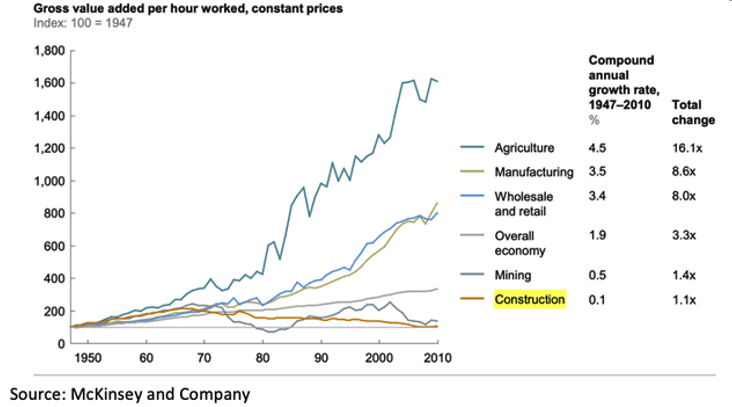
To ascertain whether worker productivity in non-residential construction has improved over the last decade, I calculated the construction spending per worker by dividing non-residential construction spending by the non-residential construction worker count taken from the St. Louis Federal Reserve’s FRED database (TLNRESCONS and CES2023620001). (I acknowledge the limitations of this calculation, but this is the best I can do given the limited data available).
The nominal construction spending per worker increased by about 30% from about $800,000 in 2011 to around $1.05 million (figure 4, blue line). However, if I were to adjust for inflation using the producer price index (PPI) of non-residential building construction spend (WPU801 from the St. Louis Federal Reserve’s FRED database), the construction spend per worker declined (orange line).
Even though it is difficult to say with a high degree of certainty whether the nominal or real construction spending is a better measure, I believe it is reasonable to conclude that the per-worker productivity has not improved significantly over the last decade. Furthermore, the 30% increase in the construction wage rate over the same period (figure 5) puts additional upward pressure on building costs, which the application of digital technology can help mitigate.
Figure 4: Non-residential construction spending per worker
Created by author using data from St. Louis Federal Reserve FRED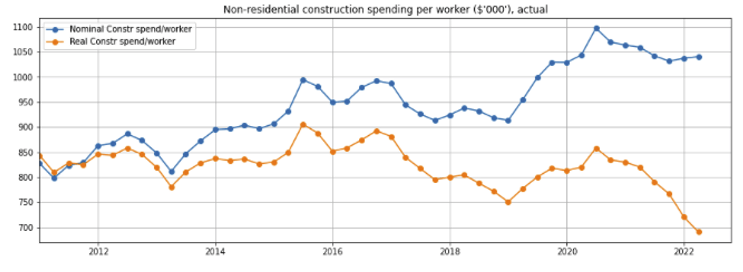
Figure 5: Construction employee wage index (indexed to 2011)
Created by author using data from St. Louis Federal Reserve FRED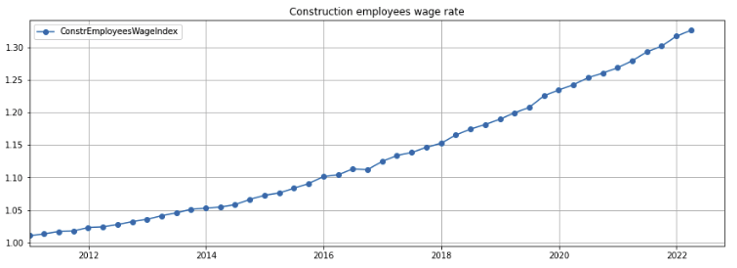
Inflation increases pressure for greater productivity
According to the U.S. Bureau of Labor Statistics (retrieved from the FRED, St. Louis Federal Reserve), the producer price index for new construction has risen sharply. New warehouse, industrial building, and office building construction costs, which increased by about 35% from 2008 through 2021, have risen by an additional 35% since 2021 (figure 6, blue, green, and orange lines). In comparison, the rise in construction employee wages have risen by almost 30% (red line).
Figure 6: Producer price index of construction projects
Created by author using data from St. Louis Federal Reserve FRED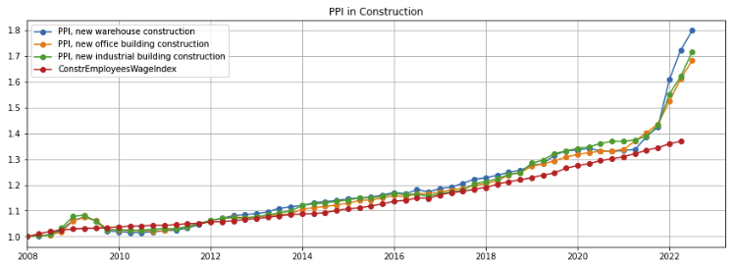
The rapid cost inflation will force owners and builders to speed up the adoption and deployment of digital technologies to enhance efficiency and mitigate material and labor cost increases.
3. Attractive economic characteristics of AEC vendors
I posited in my investment thesis that the AEC software industry has highly attractive risk-adjusted return characteristics, including:
- recurring revenues
- recession resistance
- oligopolistic structure
- powerful network effects
- strong operating leverage
Recurring revenues and recession resistance
Both Autodesk and Bentley’s recurring revenues have continued to grow (figures 7 and 8). In addition, both companies are reasonably geographically well diversified, which lessens their dependence on construction activity in any one region (discussed in figure 13 and 14 below). Recurring revenues and diversification should provide some level of downside protection when the construction industry enters into recessions.
Figure 7: Autodesk recurring revenues
Created by author using public financial data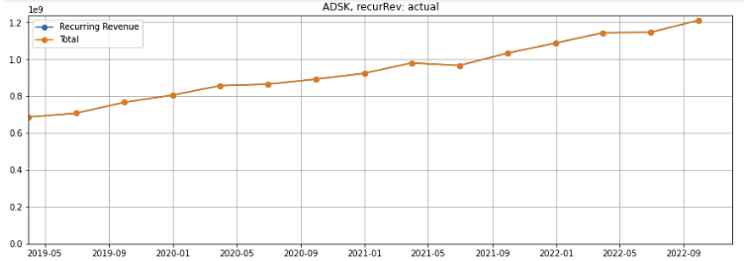
Figure 8: Bentley recurring revenues
Created by author using public financial data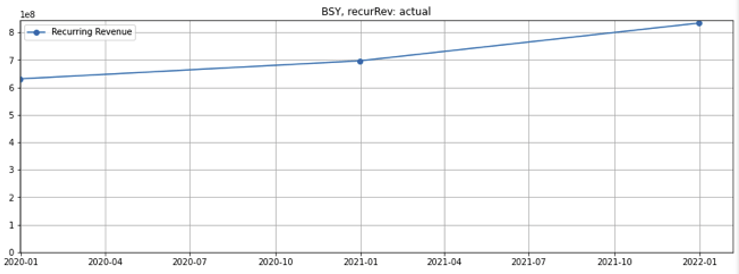
Oligopolistic structure and network effects
There has been no significant change in the AEC software industry’s oligopolistic structure, in which Autodesk and Bentley are both leaders.
As the number of key industry participants (such as designers and construction firms) adopting the Autodesk and Bentley’s computer aided design (CAD) and building information management (BIM) platforms grows, other participants (such as sub-contractors and suppliers) have no choice but to get onto the platform or risk being left out of the information flow. Furthermore, as the productivity of CAD and BIM adopters increase, their competitors will also be forced to adopt the technologies to avoid falling behind.
Over the long term, the amount of customer data stored in Autodesk and Bentley’s servers will increase exponentially and, subject to confidentiality restrictions, can potentially be mined and monetized for valuable insights on an anonymized basis.
Operating leverage
(This will be discussed in the section on EBITDA margins below.)
4. Autodesk and Bentley’s continued growth
Autodesk and Bentley’s revenues have continued to grow across the board. Even though both Autodesk and Bentley’s margins have plateaued in the last eight quarters (discussed in figures 14 and 15 below), I believe they will continue to expand over the longer term as revenues scale up.
Revenues
Autodesk’s revenue is about four times Bentley’s (figure 9, blue and green lines). Since 2021, Autodesk’s annual revenue growth has exceeded Bentley’s total trailing twelve-month revenues.
Figure 9: Autodesk and Bentley revenues vs. comparables
Created by author using public financial data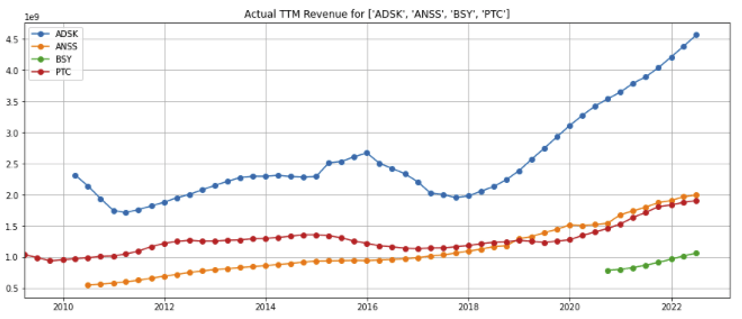
Revenue growth
Compared to its peers, Bentley’s total revenue has grown the most on a percentage basis since 2021 (figure 10, pink dashed line), but less so on a per-share basis (green solid line) because of the shares issued since its September 2020 IPO (figure 11, green line). Autodesk’s per-share revenues has outgrown marginally more than Bentley’s on a percentage basis over the same period (figure 10, solid blue line).
Figure 10: Autodesk and Bentley revenues and per-share revenues vs. comparables, indexed
Created by author using public financial data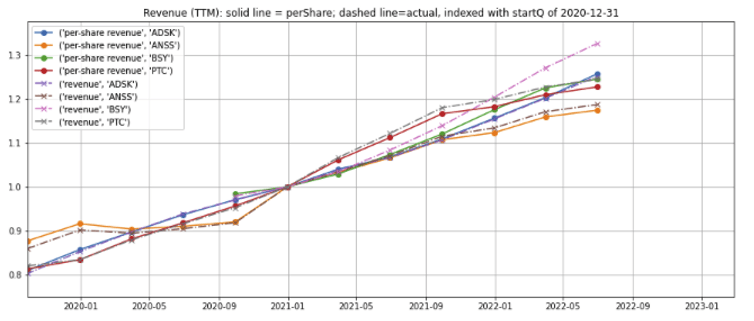
Figure 11: Autodesk and Bentley fully diluted shares outstanding vs. comparables, indexed
Created by author using public financial data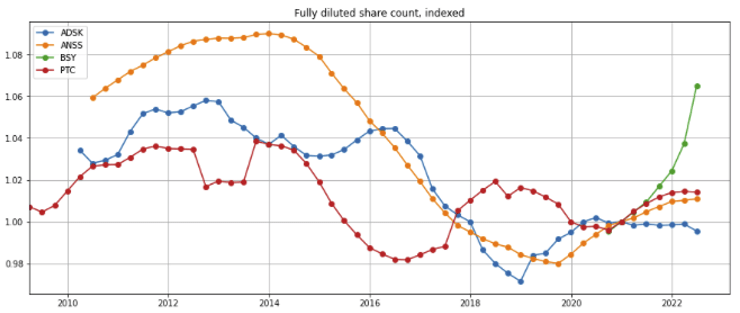
Delving in one level deeper, Autodesk’s revenue was driven by growth across all segments (figure 12), and the revenue of both companies were driven by consistent growth across all their geographical regions (figure 13 and 14).
Figure 12: Autodesk revenue growth by segment
Created by author using public financial data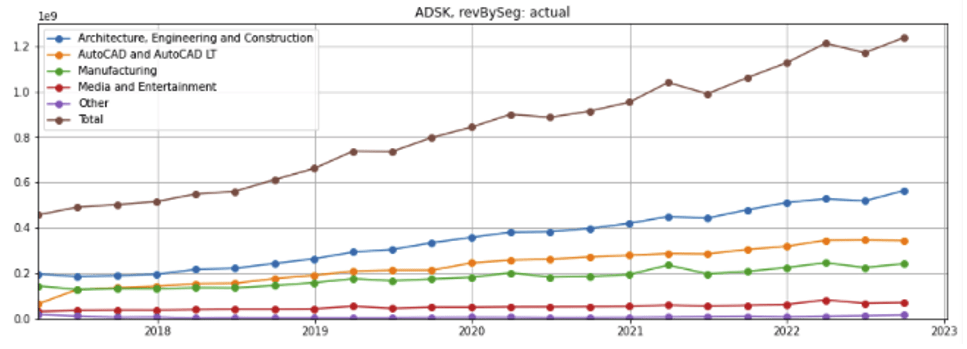
Figure 13: Autodesk revenue growth by geographical region
Created by author using public financial data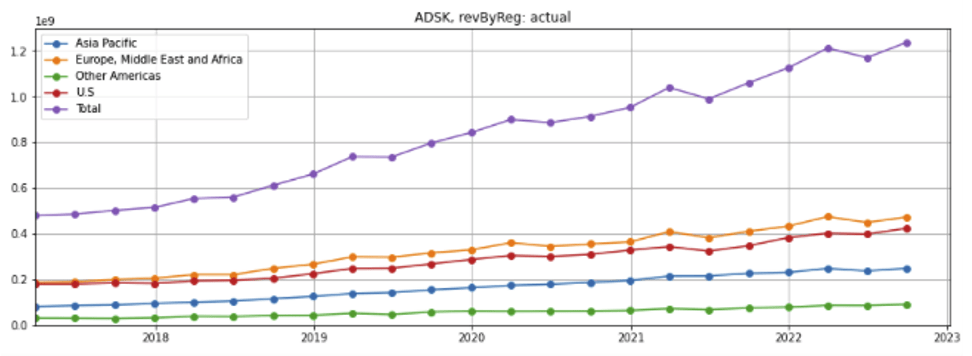
Figure 14: Bentley revenue growth by geographical region
Created by author using public financial data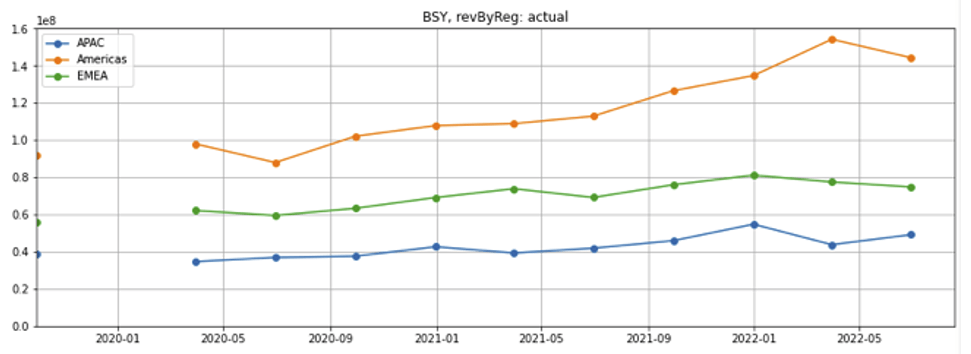
Margins
Autodesk’s gross and EBITDA trailing twelve-month (TTM) margins (orange line, figures 15 and 16) have ticked up since 2019 when it largely completed the transition of its product sales from a perpetual sale plus maintenance fee model to an annual subscription model.
Bentley’s TTM gross margin has held up (figure 15, red line). However, its TTM EBITDA margins (figure 16, red line) ticked down because of a one-time $90 million non-cash charge relating to its deferred compensation plan in the quarter ended September 2021 (figure 17), which also negatively impacted the TTM EBITDA margins for the subsequent three quarters. The “adjusted EBITDA” for the quarter ended September 2021 grew 14.7% year-over-year.
Figure 15: Autodesk and Bentley TTM gross profit margin vs comparables
Created by author using public financial data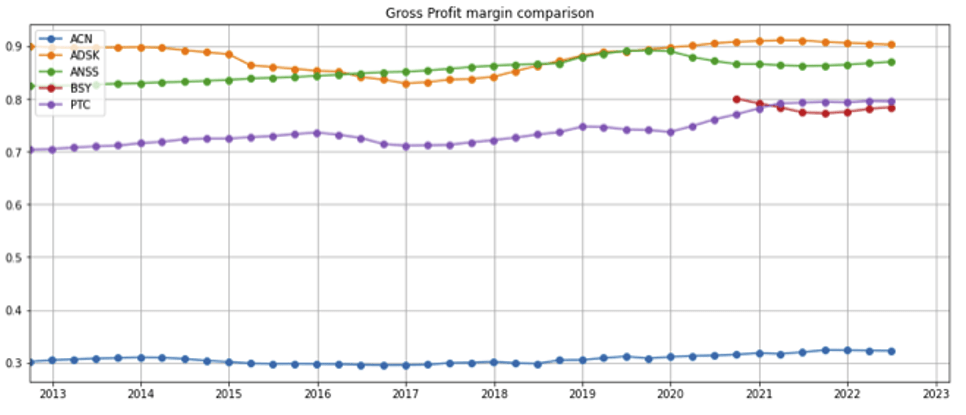
Figure 16: Autodesk and Bentley TTM EBITDA margin vs comparables
Created by author using public financial data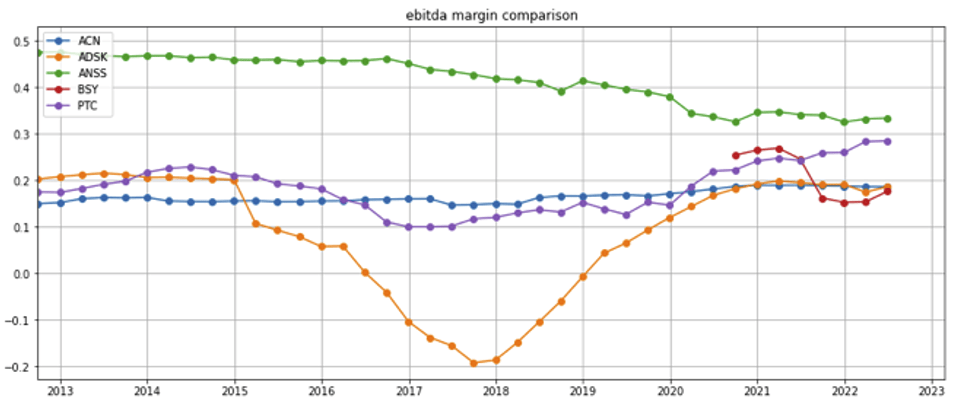
Figure 17: Reconciliation of Bentley net income to adjusted EBITDA
BSY SEC 3Q 2021 10Q filing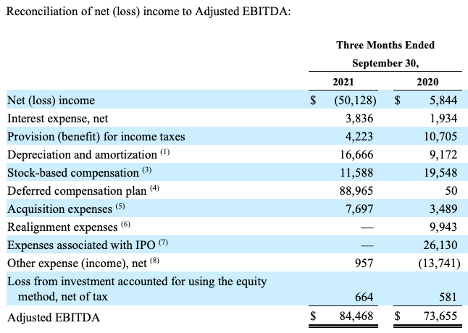
Outlook indicators
Company-specific indicators
Both companies’ remaining performance obligation (RPO) have trended up (figures 18 and 19). A company’s RPO represents the total future performance obligations arising from contractual relationships and is the sum of the invoiced amount and the future amounts not yet invoiced for a contract with a customer. As such, it is a good predictor of near-term revenues.
Figure 18: Autodesk remaining performance obligation
Created by author using public financial data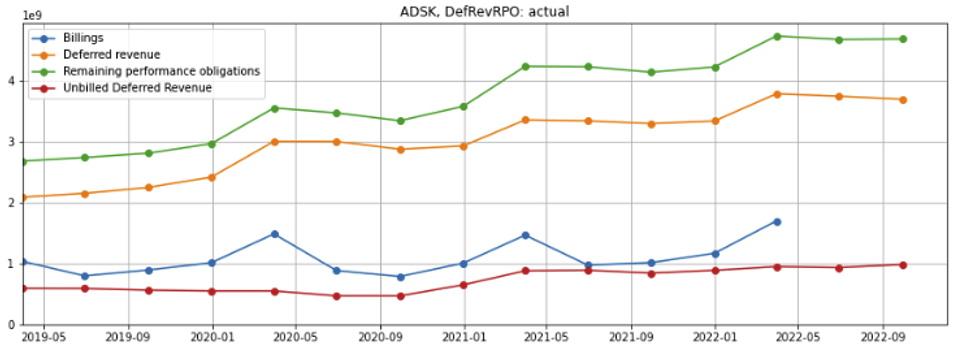
Figure 19: Bentley remaining performance obligation
Created by author using public financial data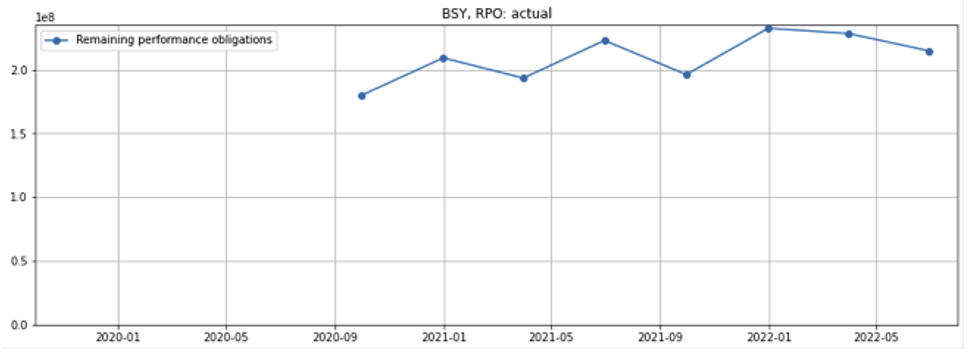
U.S. construction trends and indicators
As a significant portion of both Autodesk and Bentley’s revenues are generated in the U.S., economic and construction trends in the country provide additional guidance into their future earnings prospects.
Residential housing
U.S. rental vacancies are at a 20-year low (figure 20, blue line). Home ownership rates have moved up from 2016 lows (orange line), driving U.S. home prices up (figure 21). However, housing permits and housing starts appear to have peaked (figure 22), suggesting that residential construction activity may be slowing down.
Figure 20: U.S. rental vacancy and homeowner rates
Created by author using data from St. Louis Federal Reserve FRED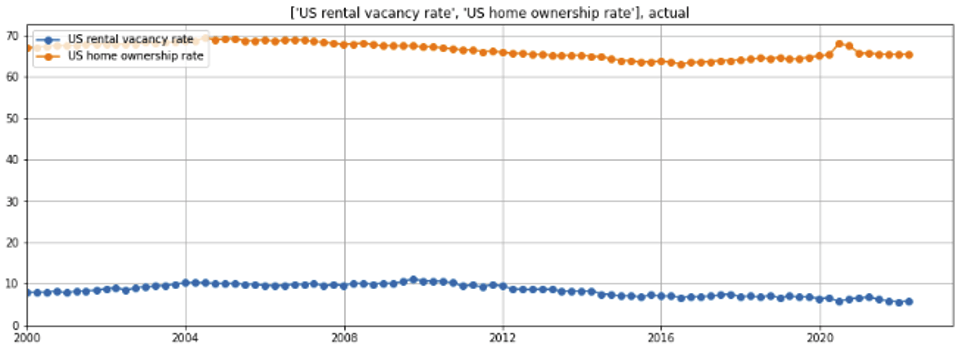
Figure 21: Case-Shiller U.S. National home price index
Created by author using data from St. Louis Federal Reserve FRED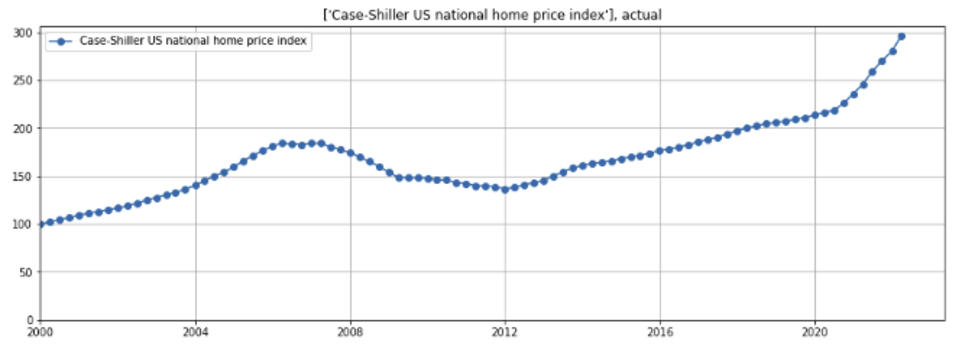
Figure 22: Housing permits, starts and completions
Created by author using data from St. Louis Federal Reserve FRED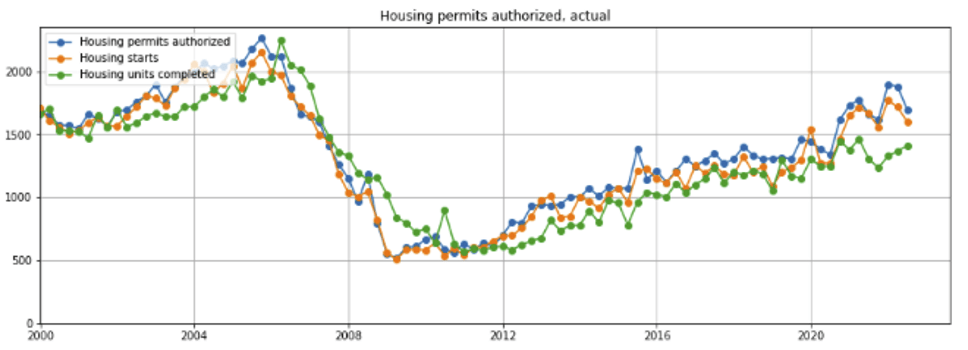
Commercial building
A Wall Street Journal (WSJ) article, Pension Funds Are Selling Their Office Buildings, published on August 25, 2022, noted:
Major U.S. and Canadian pension funds are cutting back investments in office buildings, betting that prices will likely fall as the five-day office workweek becomes a thing of the past.
The WSJ quotes Michael Turner, president of Oxford properties, the real-estate arm of the $90 billion Ontario Municipal Employees Retirement System:
On average, hybrid work will likely result in less office demand per employee over time.
Commercial Architecture Billing Index
Even though office demand per employee is expected to slow, the Commercial Architecture Billing Index (ABI), an economic indicator published by the American Institute of Architects, indicates a still growing but decelerating trend in nonresidential construction activity for the next 9 to 12 months (figure 23).
Figure 23: Commercial Architecture Billing Index
|
Month |
Billings |
Design contracts |
|
July 2022 |
“Pace of growth continued to slow” |
|
|
June 2022 |
53.2 |
52.2 |
|
May 2022 |
53.5 |
56.9 |
|
April 2022 |
56.5 |
55.4 |
|
March 2022 |
58.0 |
60.5 |
|
February 2022 |
51.3 |
55.2 |
|
January 2022 |
51.0 |
56.1 |
Source: American Institute of Architects
AECOM book-to-bill and backlog
AECOM (ACM), a major construction firm, reports strong backlog growth (figure 24, dotted red line) and a book-to-bill above 1 (solid red line), suggesting that near-term activity will hold up.
Figure 24: AECOM book-to-bill and backlog
Created by author using AECOM public financial data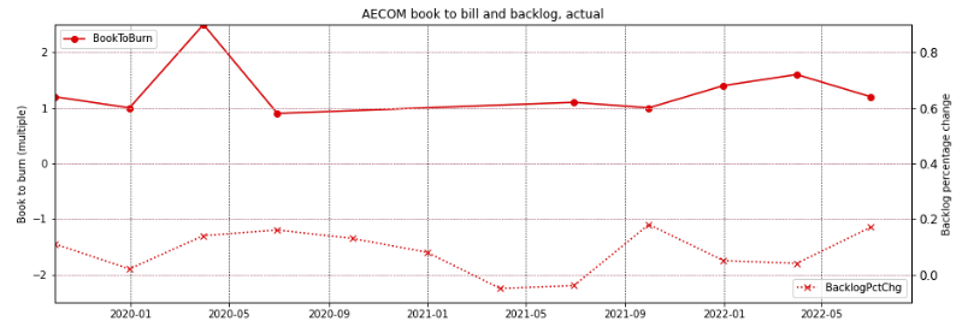
The August 25, 2022 WSJ article further observed:
Retirement funds are still buying property, partly in a bid to reduce the impact of inflation. But those investments are more focused on warehouses, lab space, housing, and infrastructure such as airports.
Warehouses
Private investment in warehouses has increased 3x since the last peak in 2007 and 8x since 2010 due to the strong demand for storage space from e-commerce companies (figure 25). This trend accelerated following the COVID-19 pandemic outbreak that drove more retail purchases online.
Industrial warehouse REITs such as Prologis (PLD) and STAG Industrial (STAG) continue to report very high occupancy rates (97.6% and 98.1% respectively at the end of the quarter ended June 30, 2022) and both expect strong demand to continue.
Figure 25: Fixed investment in warehouses
St. Louis Federal Reserve FRED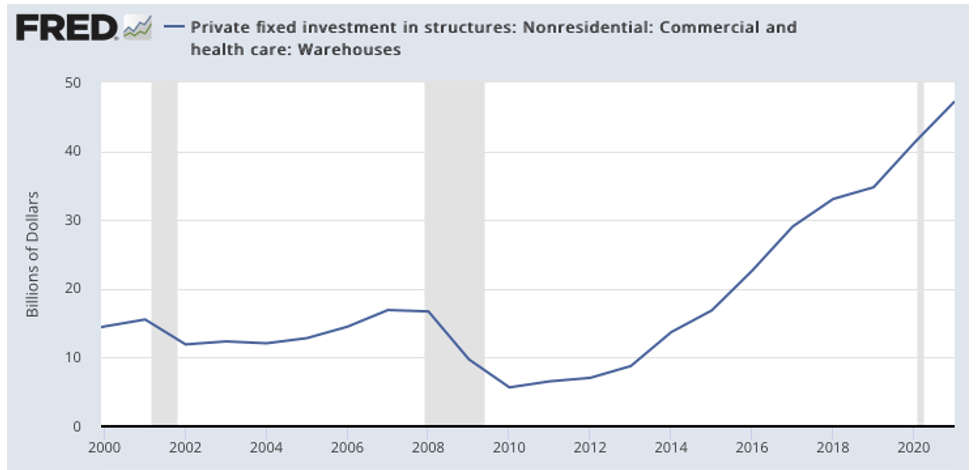
Stag Industrial cited several additional macro trends driven by both the pandemic and geopolitical events that are driving the demand for warehouse space, including the accelerating re-shoring and near-shoring trends, as well as “just-in-case” and reverse logistics needs. Stag also noted that the current retail inventory to sales ratio is hovering near 8-year lows, which is likely to create more demand for warehouse space as it returns closer to normalized levels (figure 26).
Figure 26: COVID-19 impact on e-commerce and supply chain configuration
STAG Industrial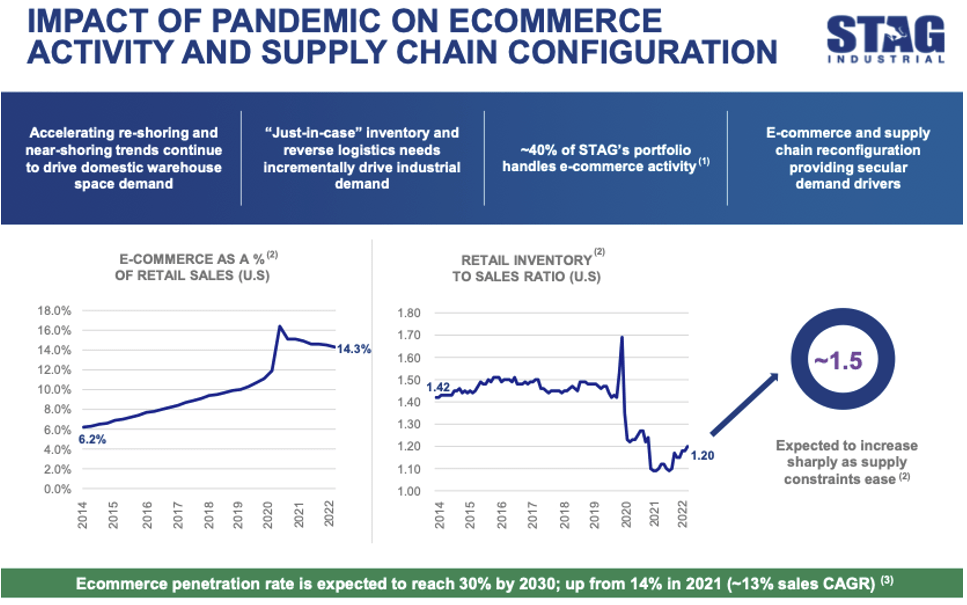
Infrastructure and waterworks
The 2021 Infrastructure Investment and Jobs Act (IIJA) passed by Congress included funding for transportation, clean water, electric grid, and broadband access funding (figure 27). The $1.2 trillion included $550 billion in spending over the next decade above the amount Congress is expected to authorize regularly, or an average of $50 billion a year.
Figure 27: Spending under the Infrastructure Investment and Jobs Act
NPR.org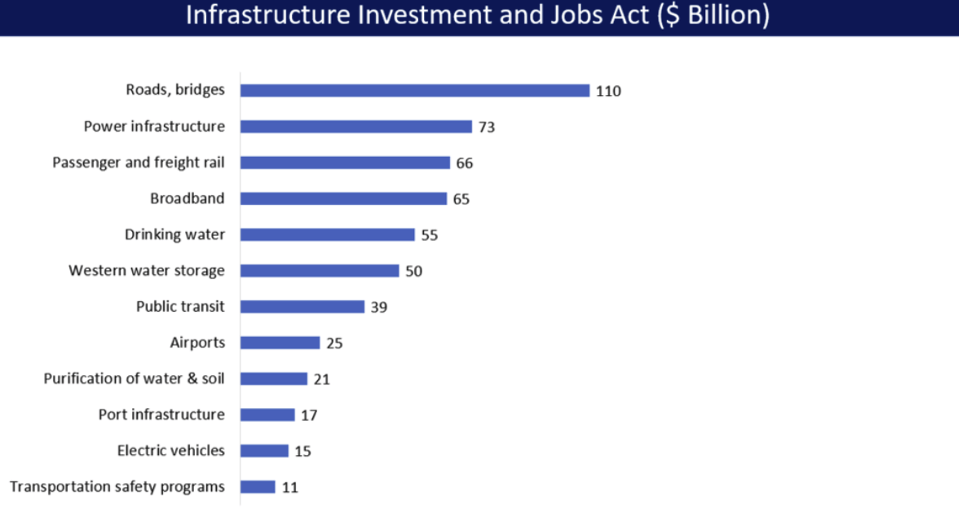
Highways: The FY 2022 IIJA Funding announced by the Federal Highway Administration of $52.5 billion for bridge and highway repair and transportation modernization (figure 28) is significant compared to the annual highway and street funding in the U.S. (figure 29).
Figure 28: Announced IIJA Funding by US Federal departments and agencies
Nasdaq.com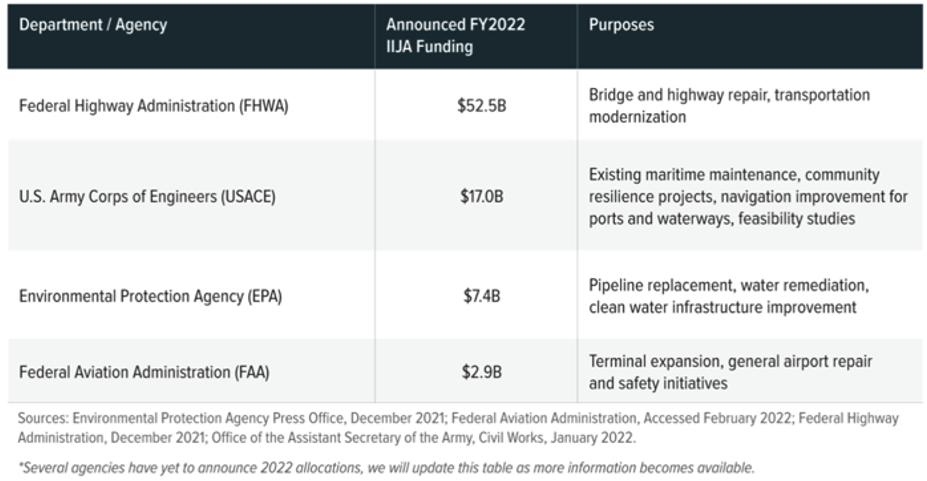
Source: What’s Next for Infrastructure Spending?
Figure 29: Total construction spending on highways and streets in the U.S.
St. Louis Federal Reserve FRED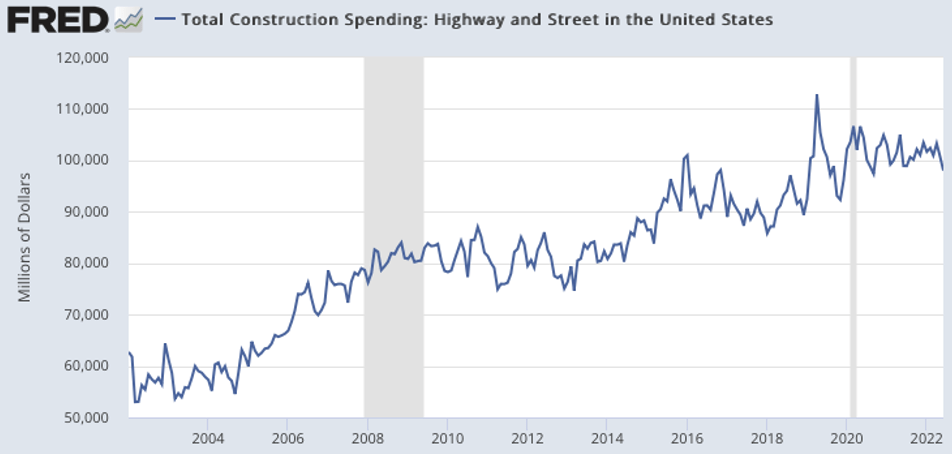
Waterworks: Similarly, the $7.4 billion allocated by the Environmental Protection Agency (EPA) for pipeline replacement, water remediation and clear water infrastructure constitutes almost one-third of the total construction spending on water supply in the U.S. (figure 30).
Figure 30: Total construction spending on water supply in the U.S.
St. Louis Federal Reserve FRED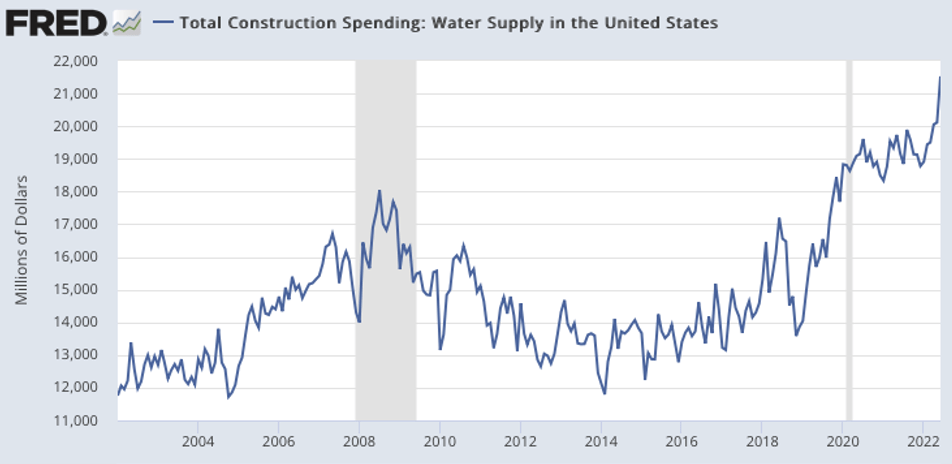
The implementation of the Infrastructure Investment and Jobs Act is likely to accelerate, keeping infrastructure construction activity strong for the coming years (figure 31).
Figure 31: Impact of the Infrastructure Investment and Jobs Act
Nasdaq.com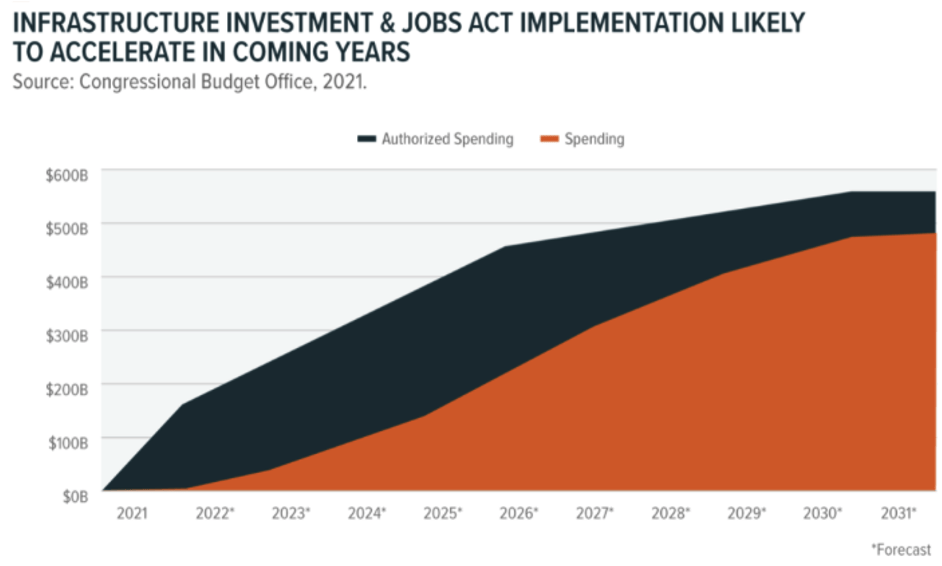
Source: What’s Next for Infrastructure Spending?
Bottom line:
Autodesk’s AEC (Architecture, Engineering, and Construction) and related tools comprise over 70% of its total revenues. Its products span the full spectrum of design, project management, and asset management. Similarly, approximately two-thirds of Bentley’s revenues are derived from public works (roads, rails airports, ports, water, and wastewater networks) and utilities (electric, gas, water, and communications).
Both companies will benefit indirectly from the secular growth in construction as well as the increased infrastructure spend, which create additional demand from the architects, engineers, and contractors that utilize the companies’ products to design these projects and drive productivity.
5. Valuation
Autodesk’s free cash flow yield pulled back to over 4% before recovering to around 3.4% (figure 32, blue line). At 2.6%, Bentley’s free cash flow yield remains significantly higher (figure 33, blue line), likely due to the large percentage of stock still held by members of the founding Bentley family.
Figure 32: Autodesk valuations
Created by author using public financial and stock price data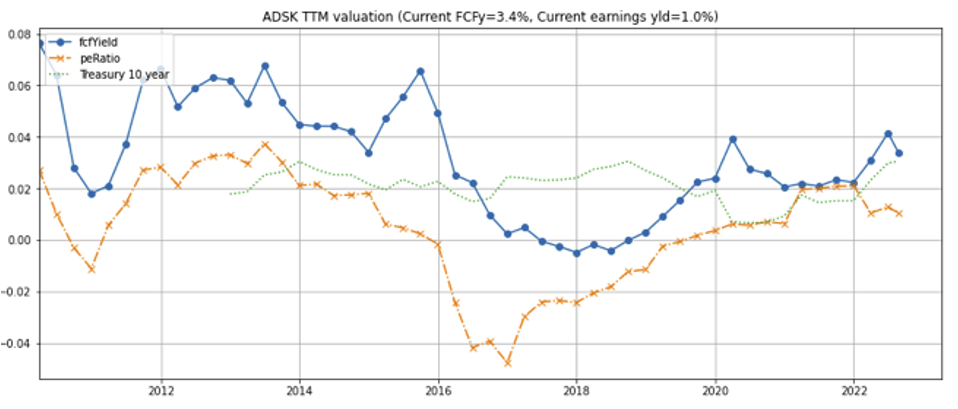
Figure 33: Bentley valuations
Created by author using public financial and stock price data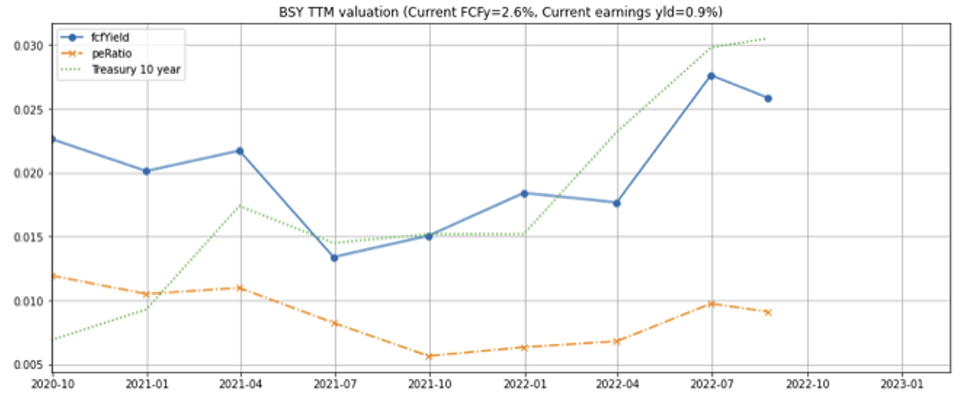
Even though Autodesk’s per-share growth rate has been higher than Bentley and its comparables such as PTC Inc. (PTC) and ANSYS, Inc. (ANSS), its free cash flow yield is lower (figure 34). Assuming the growth rates stay on similar trajectories, Autodesk appears to offer the most attractive risk-adjusted return.
Figure 34: Autodesk and Bentley free cash flow yields vs comparables
Created by author using public financial and stock price data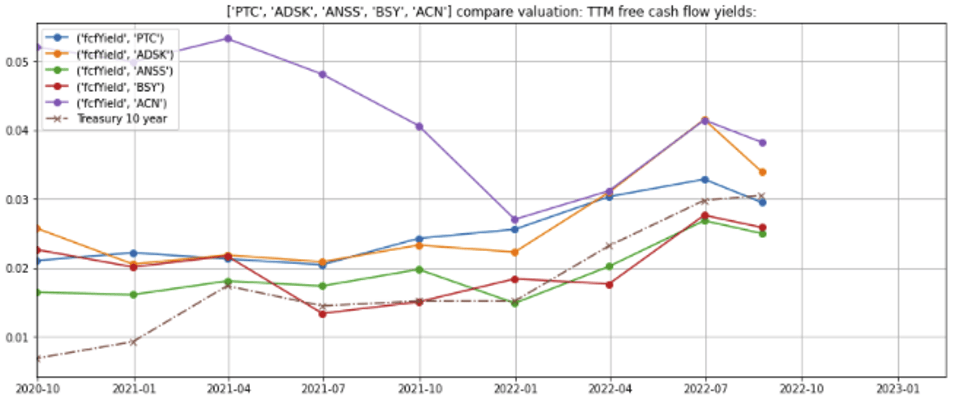
Concerns
In my December 2021 article, I noted that my biggest concern was the valuation: I believed that the valuations of Autodesk and Bentley were full and could take a hit if management’s warnings of decelerating usage growth materialize. The valuations have pulled back since the Federal Reserve began its rate hikes and the onset of the Ukraine war, and are more attractive today than they were nine months ago.
Recessionary risks: In a severe and prolonged economic slowdown, clients could reduce the number of seats in their subscriptions, which could in turn negatively impact earnings through the downturn. However, I continue to believe in the long-term growth prospects of the building software segment, and will use a further pullback to add to my position.
Summary
- The investment thesis in my previous article-the long-term secular growth in construction, need for digital technologies to improve productivity, and attractive risk-adjusted return characteristics of the construction design and build software-continue to hold.
- Despite a slowing economy, Autodesk and Bentley have continued to grow, and are poised to benefit from the increased demand in residential, industrial, warehouse, and healthcare facilities as well as infrastructure construction and remediation projects.
- Valuations of both companies have pulled back following the Federal reserve’s interest rates hikes, creating another opportunity for long-term oriented investors to add to their positions.
Be the first to comment