

ipuwadol
A Quick Take On Aurora Mobile
Aurora Mobile (NASDAQ:JG) reported its Q3 2022 financial results on November 23, 2022, missing expected revenue estimates.
The firm provides a range of mobile data services and software to developers in China and overseas.
I’m on Hold for JG until management can reignite growth while achieving operating breakeven.
Aurora Mobile Overview
The Shenzhen, China-based company was founded in 2011 to provide precision marketing, user activity analysis, and financial risk analysis for primarily mobile applications.
Management is headed by Co-Founder and CEO Weidong Luo, who has been with the firm since inception and was previously the General Manager at Shenzhen Zhiwo Information Technology Company Limited.
From developer devices, Jiguang is getting access to user behavioral data in real-time and anonymously. Once received, this information is aggregated, cleansed, structured and encrypted.
Currently, Jiguang offers four categories of services that it calls:
-
Union – integrated services
-
Operations & Growth
-
Dev Tools
-
Industry Applications
According to a 2018 market research report by IBIS World, the Internet Services market in China is projected to reach $527 billion by the end of 2018 and $2.281 trillion by the end of 2023. This represents a CAGR of 34% over the course of the next five years.
The main factors driving market growth are increasing internet coverage and adoption of e-commerce.
Major potential competitive vendors that are developing mobile data services include:
-
Tencent (OTCPK:TCEHY) (OTCPK:TCTZF)
-
Baidu (BIDU)
-
Alibaba (BABA)
-
Others
Aurora Mobile’s Recent Financial Performance
-
Total revenue by quarter has produced the following results:
9 Quarter Total Revenue (Seeking Alpha)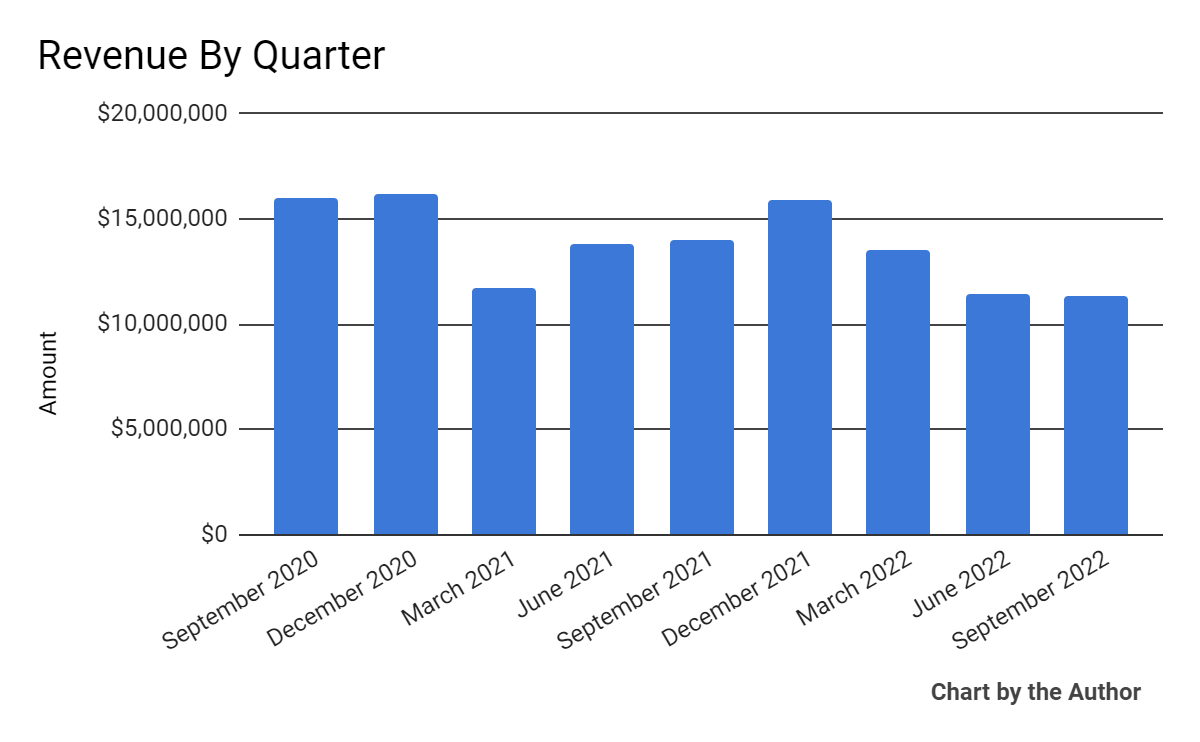
-
Gross profit margin by quarter has trended lower in recent quarters:
9 Quarter Gross Profit Margin (Seeking Alpha)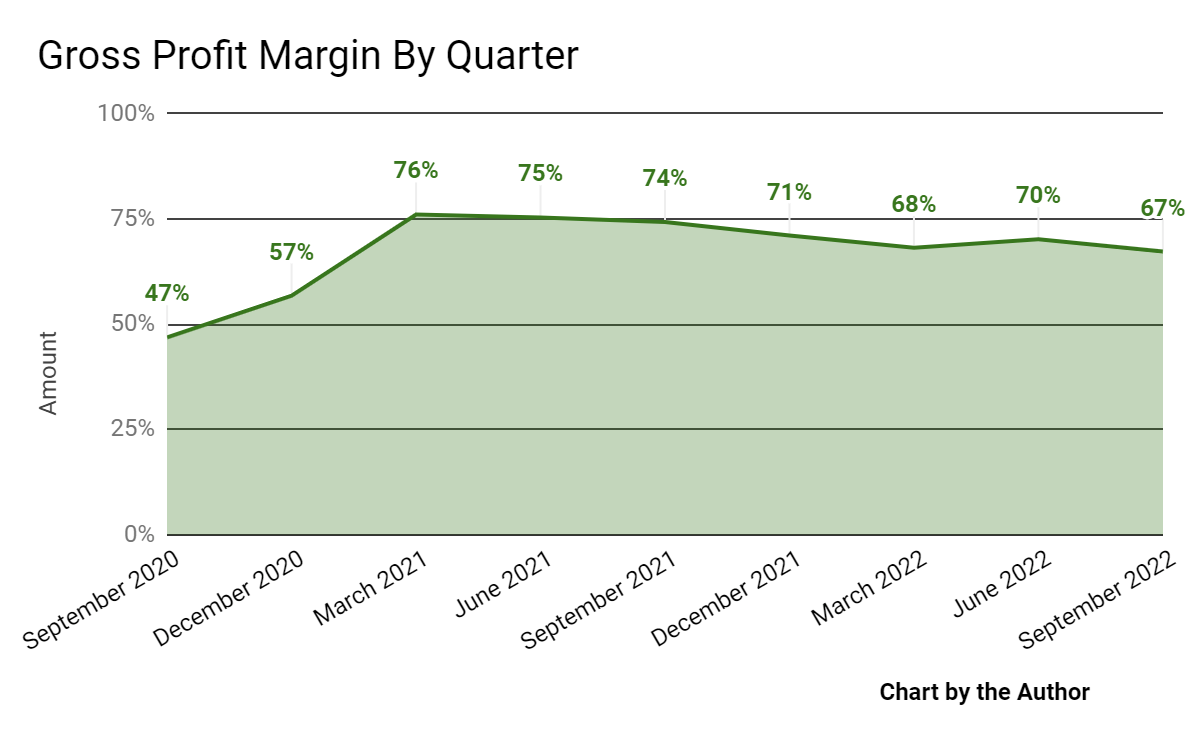
-
SG&A expenses as a percentage of total revenue by quarter have dropped slightly for comparative periods:
9 Quarter SG&A % Of Revenue (Seeking Alpha)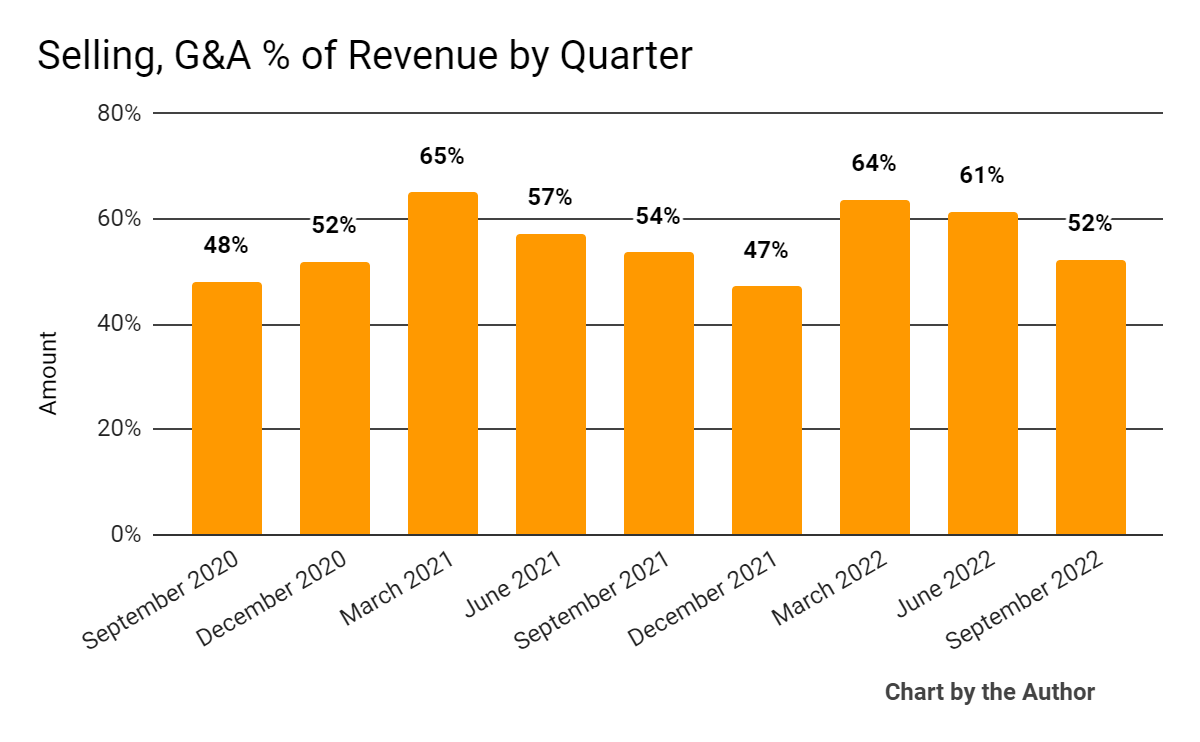
-
Operating losses by quarter have lessened recently:
9 Quarter Operating Income (Seeking Alpha)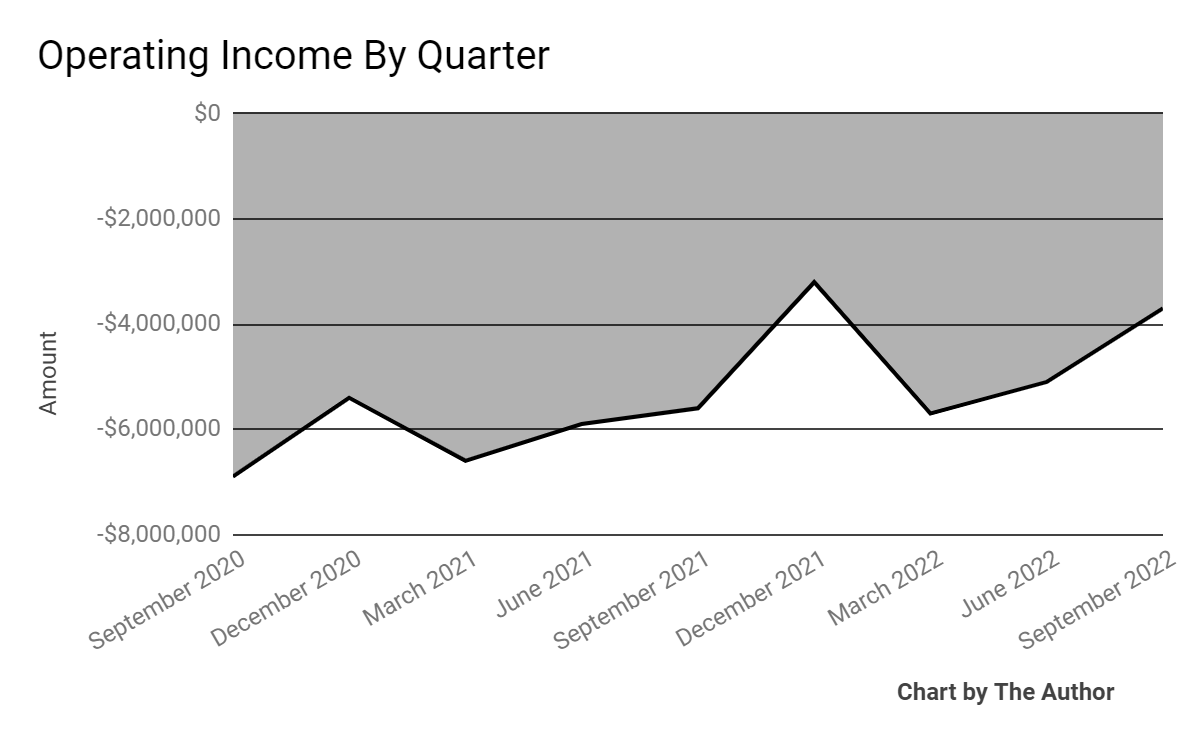
-
Earnings per share (Diluted) have been trending toward breakeven:
9 Quarter Earnings Per Share (Seeking Alpha)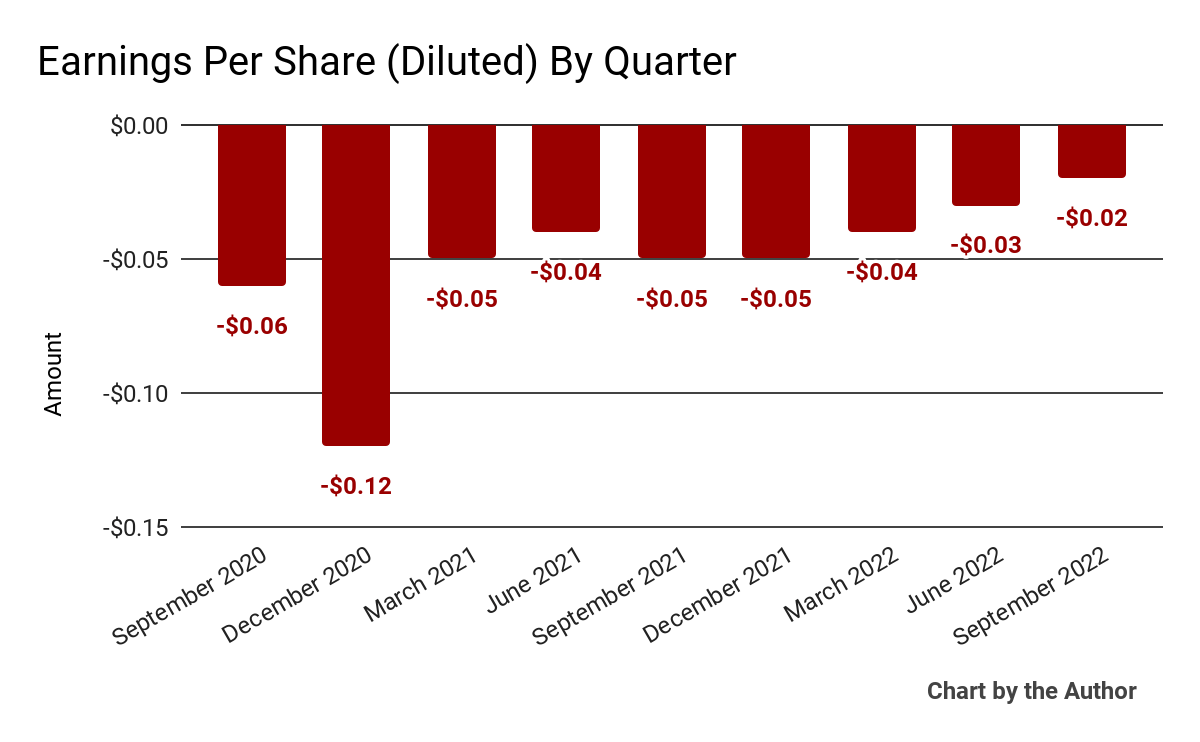
(All data in the above charts is GAAP)
In the past 12 months, JG’s stock price has dropped 22.3% vs. the U.S. S&P 500 index’s (SPY) drop of around 17.2%, as the comparison chart below indicates:
52-Week Stock Price Comparison (Seeking Alpha)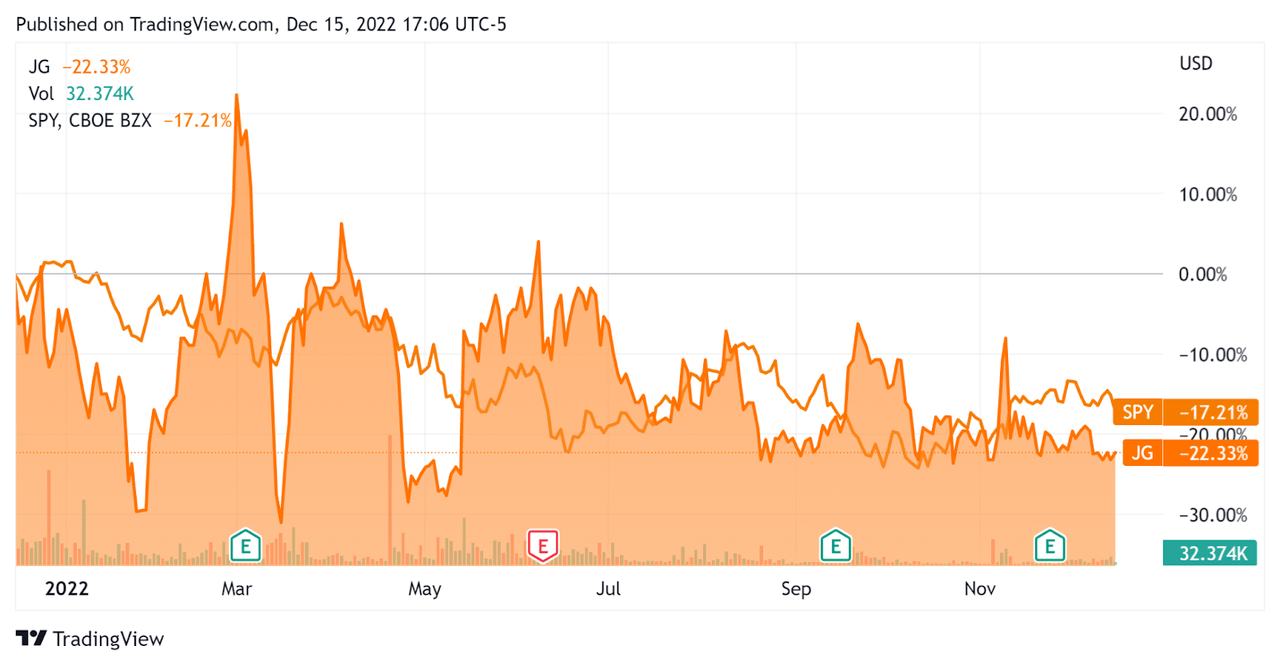
Valuation And Other Metrics For Aurora Mobile
Below is a table of relevant capitalization and valuation figures for the company:
|
Measure [TTM] |
Amount |
|
Enterprise Value / Sales |
1.9 |
|
Revenue Growth Rate |
-5.3% |
|
Net Income Margin |
-31.8% |
|
GAAP EBITDA % |
-28.3% |
|
Market Capitalization |
$103,375,912 |
|
Enterprise Value |
$92,637,680 |
|
Operating Cash Flow |
-$5,882,063 |
|
Earnings Per Share (Fully Diluted) |
-$0.14 |
(Source – Seeking Alpha)
The Rule of 40 is a software industry rule of thumb that says that as long as the combined revenue growth rate and EBITDA percentage rate equal or exceed 40%, the firm is on an acceptable growth/EBITDA trajectory.
JG’s most recent GAAP Rule of 40 calculation was negative (33.6%) as of Q3 2022, so the firm performed poorly in this regard, per the table below:
|
Rule of 40 – GAAP |
Calculation |
|
Recent Rev. Growth % |
-5.3% |
|
GAAP EBITDA % |
-28.3% |
|
Total |
-33.6% |
(Source – Seeking Alpha)
Commentary On Aurora Mobile
In its last earnings call (Source – Seeking Alpha), covering Q3 2022’s results, management highlighted the company’s focus on expanding its footprint into overseas markets while continuing its cost control efforts.
However, the company is seeing ‘major transitions’ in various economies and is contending with growth uncertainties.
Its Developer Services segment was hard hit, resulting in a 12% reduction in revenue ‘due to the weakness in value-added services, offset by the growth in Subscription Services.’
As to its financial results, total revenue dropped 19.3% year-over-year, while gross profit margin fell by 7 percentage points during the same period.
Leadership did not disclose any company retention rate or related metrics.
JG’s Rule of 40 results has been highly negative for the trailing twelve-month period.
Operating income has remained substantially negative while earnings per share have made some progress toward breakeven.
For the balance sheet, the firm finished the quarter with $15.2 million in cash, equivalents, and short-term investments and no debt.
The company repurchased 27,000 ADSs during the quarter.
Looking ahead, the firm is essentially hunkering down, having reduced its headcount and lowered its cost structure over the past year or so.
Regarding valuation, the market is valuing JG at an EV/Sales multiple of around 1.9x.
The SaaS Capital Index of publicly held SaaS software companies showed an average forward EV/Revenue multiple of around 6.3x on November 30, 2022, as the chart shows here:
SaaS Capital Index (SaaS Capital)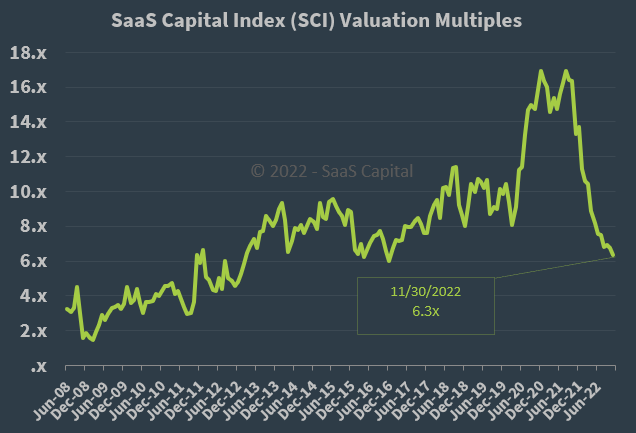
So, by comparison, JG is currently valued by the market at a substantial discount to the broader SaaS Capital Index, at least as of November 30, 2022.
The primary risk to the company’s outlook is a macroeconomic slowdown or recession, which has already been reducing its revenue growth trajectory.
In the near term, I don’t see a case for a meaningful upside catalyst to the stock from organic efforts.
I’m on Hold for JG until management can reignite growth while achieving operating breakeven.
Be the first to comment