

Swiss Franc, CHF, AUD/CHF, NZD/CHF, EUR/CHF – Talking Points:
- AUD/CHF breaking out of downtrend, 0.6900 level firmly in sight
- NZD/CHF pushing higher, firm resistance ahead at 0.6560
- EUR/CHF forming potential double bottom around 1.07, 0.382 Fib level eyed
AUD/CHF Technical Analysis
The AUD/CHF cross has seen a bit of a bounce in October, taking the pair outside of the descending channel that was held for much of September. The bounce has seen relative strength rise steadily, as the pair firmly eyes the 0.6900 level. Further validation of the uptrend was seen in the break above the pivot zone below 0.6180, an area that has seen multiple rallies falter previously. Now in fresh air, price remains vulnerable. With momentum pointing for a continued push higher, price may check back to the top of the pivot zone below before making a firm run at the 0.6900 level.
AUD/CHF Daily Chart
Chart created with TradingView
NZD/CHF Technical Analysis
NZD/CHF appears to finally be breaking higher after a prolonged formation of a falling wedge. Descending yet converging support and resistance primed price for an explosive move as price action became more condensed. The breakout has seen a bounce through the 0.618 Fibonacci retracement at 0.6510, with the September high of 0.6581 firmly eyed. Price may look to find support back at the 0.618 Fib level before charging higher. With price back above both the 50-day and 200-day moving averages, market participants may want to remain cognizant of an extension of the current breakout. Price has failed at 0.6560 on multiple occasions, and further progress higher may depend on a break of that key level.
NZD/CHF Daily Chart
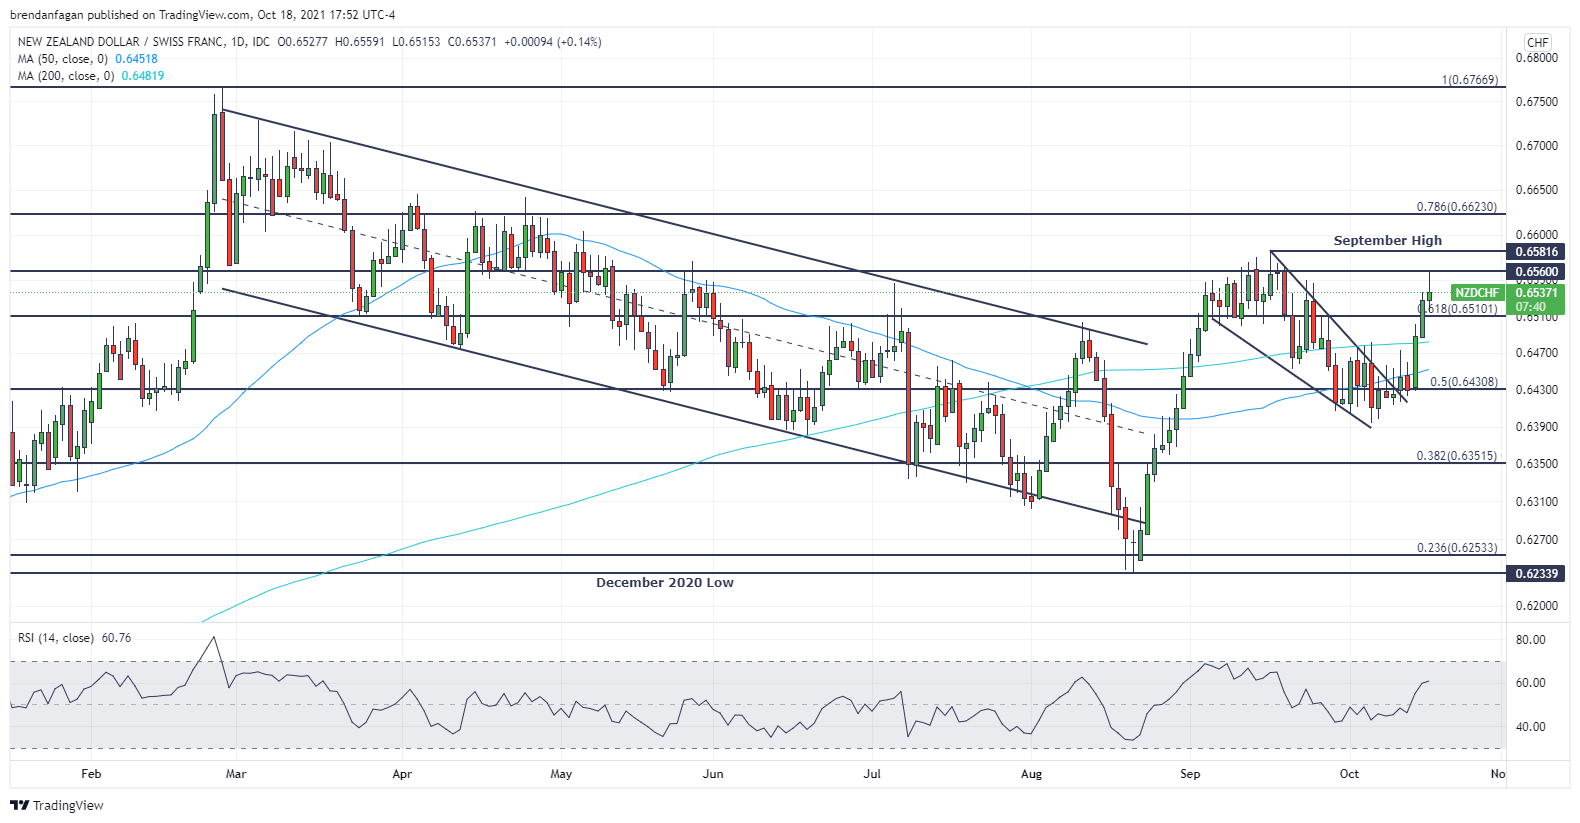
Chart created with TradingView
EUR/CHF Technical Analysis
EUR/CHF has remained under pressure for much of the last month, with price appearing to bottom around the 1.07 level. The catalyst for the swift move lower in the latter half of September was a break out of a bear flag above the 0.5 Fibonacci retracement level, with price also failing to hold the 0.382 Fib level on the way down. Price may have found a bottom at current levels, as the 1.07 level proved to be the bottom in the August swing lower. A bounce from the current level could invite a retest of the 50-day moving average just below 1.08.
EUR/CHF Daily Chart

Chart created with TradingView
Resources for Forex Traders
Whether you are a new or experienced trader, we have several resources available to help you; indicator for tracking trader sentiment, quarterly trading forecasts, analytical and educational webinars held daily, trading guides to help you improve trading performance, and one specifically for those who are new to forex.
— Written by Brendan Fagan, Intern
To contact Brendan, use the comments section below or @BrendanFaganFX on Twitter
Be the first to comment