

akinbostanci/iStock via Getty Images
Thesis
Firstly, let me be crystal clear up front: I am not recommending you buy AT&T (NYSE:T) simply because it’s the lesser of the two evils when compared to Lumen (NYSE:LUMN). A’s problem does not go away simply because B’s problem is bigger. Plus, as the saying goes, you cannot spend relative performance. All told, conservative accounts with a short timeline may want to sit on the sidelines for both stocks, as they both face tremendous uncertainties in the near term.
For T, there were a number of nonrecurring charges during the second quarter tied to debt repayment, restructuring, and asset impairments. I expect these types of charges to continue over the next couple of quarters as the company streamlines operations post the Warner divesture. In the meantime, T also had to ramp up its capital spending to keep building its 5G network capabilities. It has no choice on this front if it wants to compete with rivals like Verizon (VZ). To make the problem even worse, the company is also dealing with timing issues of customer collections. Consequently, it recently cut its free cash flow guidance by $2B from the previous guidance of $16 billion to the revised $14 billion. As a result of these issues, its stock prices are currently trading near a historical low. Its valuation is also near the bottom range of its historical record in terms of pretty much all metrics, such as dividend yield price/sales, price/book value, price/earnings, and price/cash flow basis.
To wit, its dividend yield currently stands at nearly 10% (9.97% to be exact) as seen in the chart below. On an FWD basis, the yield is a bit lower considering its recent cut, but the FWD Dividend Yield is still a generous 6.83%. The current yield is not only far above its historical average but also near a peak level in a decade as you can see.
So the logical question to ask is if the cheap valuation properly compensates for the risks ahead. As you will see in the remainder of this article, I will argue that the answer is yes. And the argument is best illustrated by a comparison against LUMN.
Source: Seeking Alpha and YCharts data.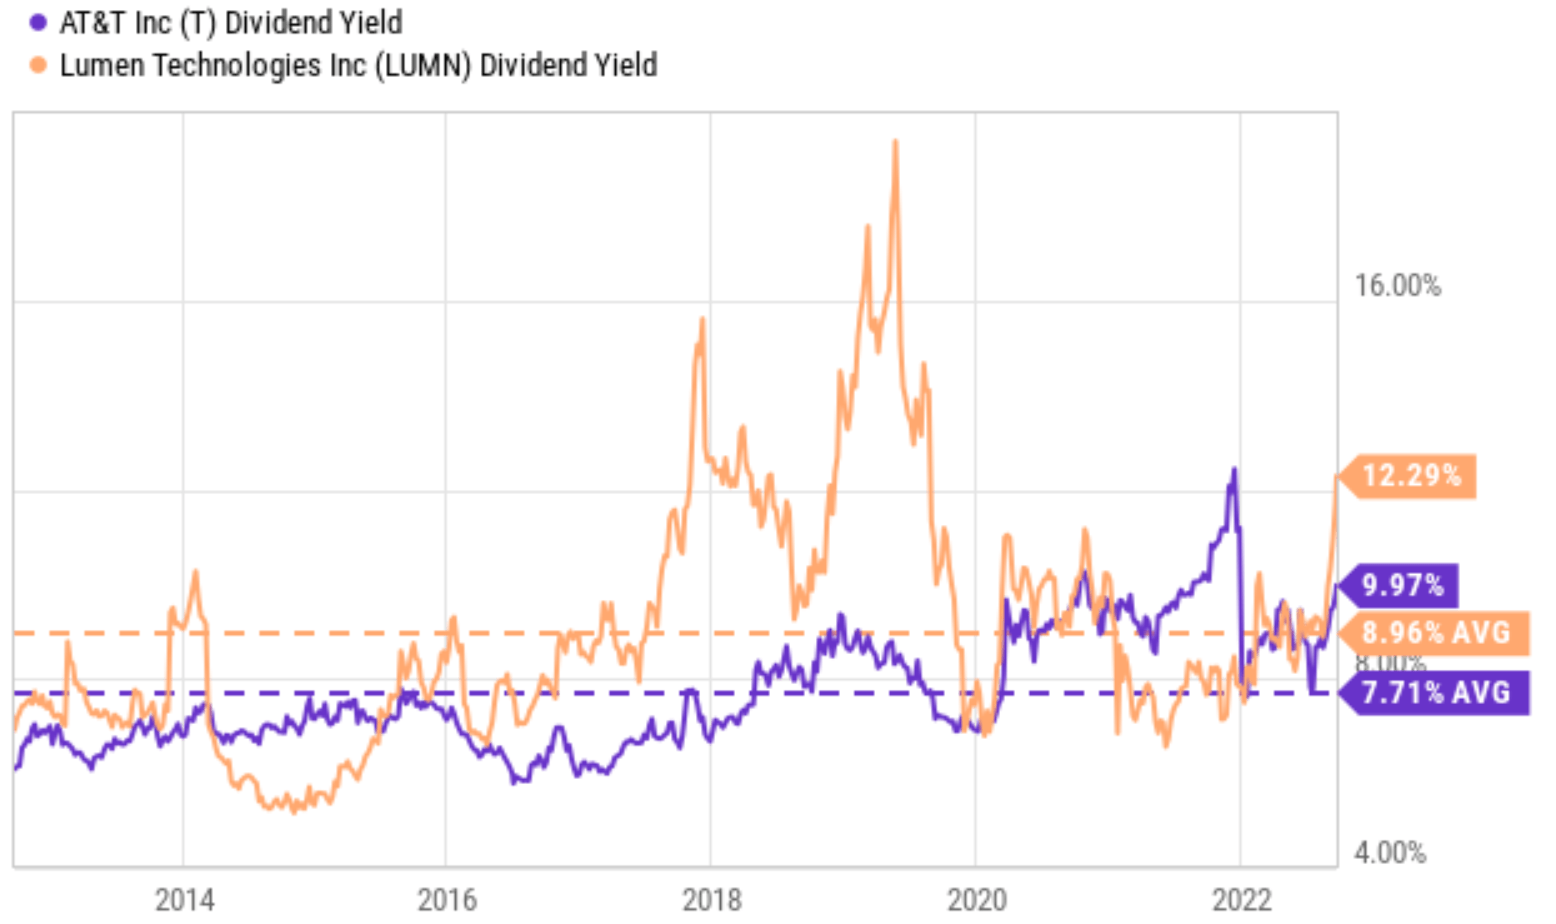
A historical perspective
Let’s first start with a historical perspective, as shown in the next chart. The chart compares the price returns and total returns in the past 5 years from LUMN and T. A few key observations as you can clearly see from the data. First, LUMN is even worse than T (which itself lagged the overall market miserably). T delivered a negative 45% price return, while the overall market went through a strong bull run. LUMN suffered a price loss of 56%. Second, LUMN’s underperformance remains even when the dividends are accounted for. As you can see from the previous chart, LUMN has paid a higher yield (averaging 8.96% in the past decade) than T (7.71% average). However, as seen in the bottom panel of this chart, when dividends are adjusted, T returned a negative 16%, still better than LUMN’s 28% loss by a sizable margin.
Source: Seeking Alpha and YCharts data.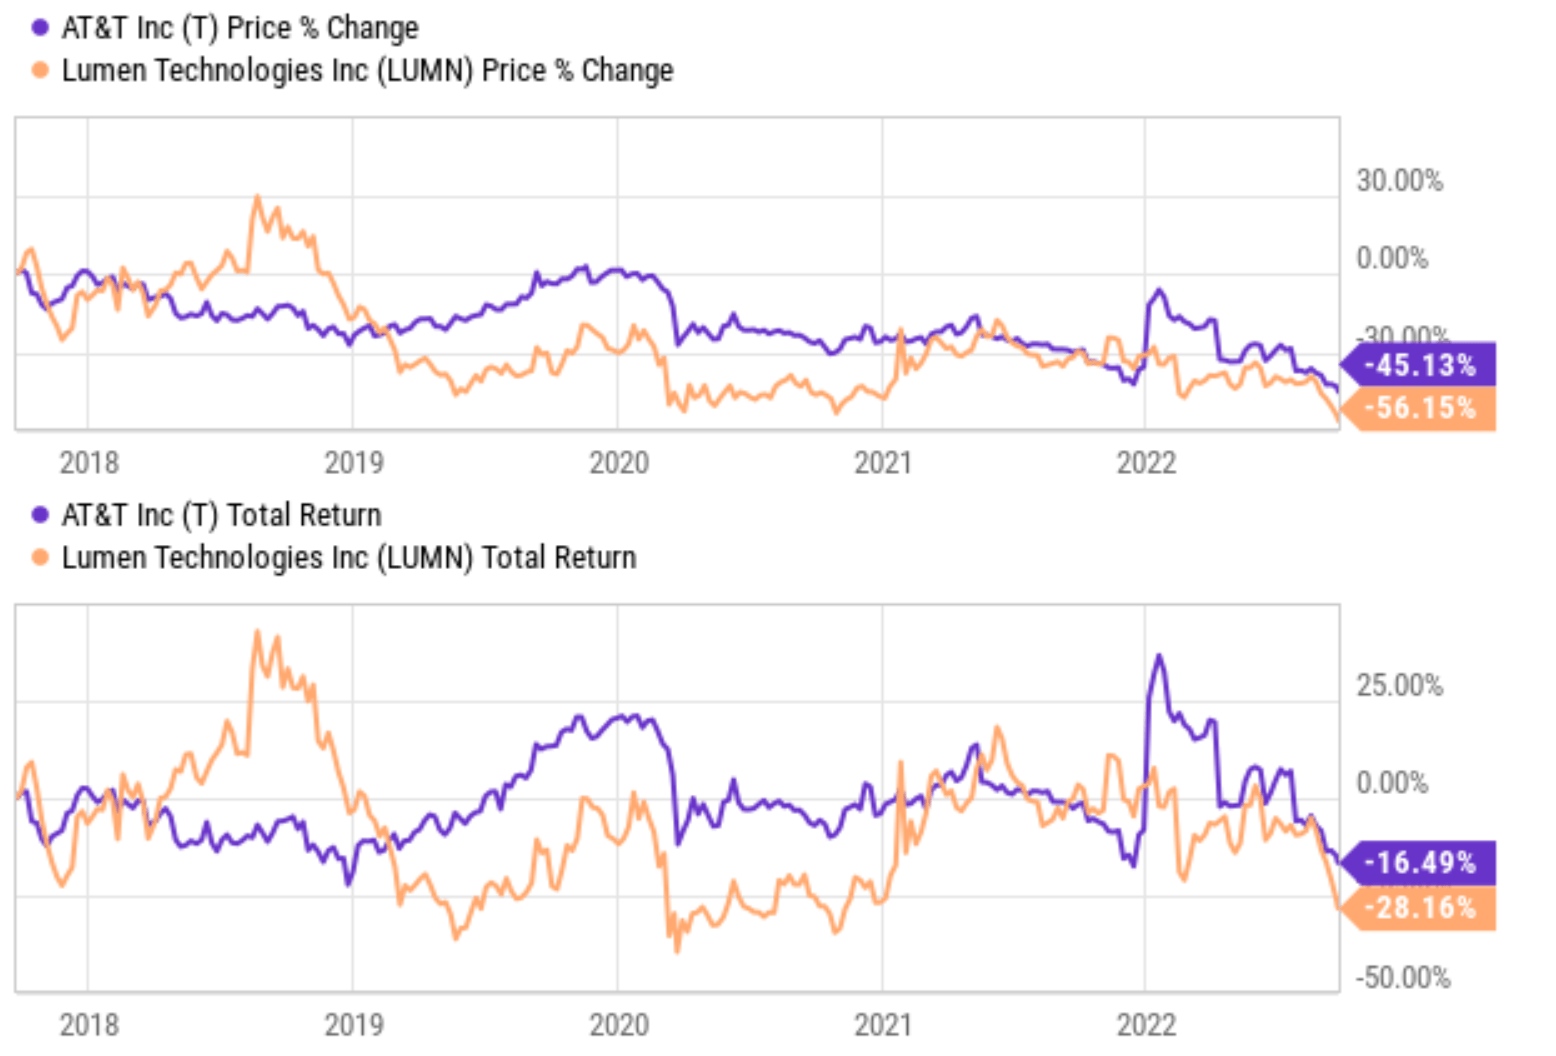
On top of lagging performance, LUMN has also suffered higher volatility risks too as you can see from the next chart. In terms of standard deviation, LUMN’s volatility has been on average 39% in the past 3 years, almost 2x higher than T’s 21%. In the past 5 years, the picture does not change too much. LUMN’s volatility has been on average 36%, still about 1.8x higher than T’s 20%. The comparison against VZ (the most conservative one in this group) is more dramatic as seen.
Now, before moving on, let me reiterate one more time that I am using this comparison because I think it is an effective way to illustrate the risk/ reward profile for both stocks. I am NOT using this comparison to show that A’s problems go away because B’s problem is even bigger.
With this clarification, let’s see the future return prospects for these stocks.
Source: Portfolio Visualizer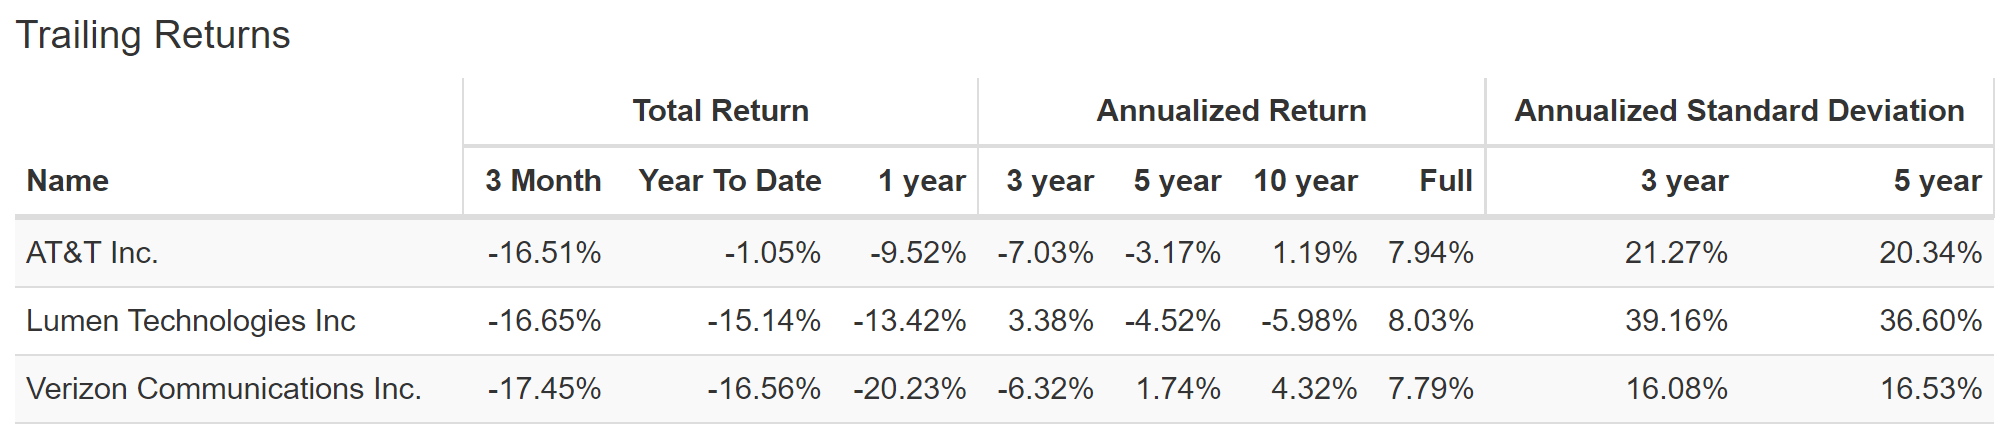
The misleading dividend yields and payout ratios
Many investors probably feel that LUMN is a “safer” stock given its higher current dividend yield (12% on an FWD basis compared to T’s 6.83%), and furthermore, its payout ratios seem quite conservative on the surface. However, both the dividend yield and the simple payout ratios are often misleading as in the case of LUMN.
The next chart shows LUMN and T’s dividend payout ratios in terms of earnings (top panel) and also cash flow (bottom panel). As can be seen, LUMN’s current payout ratios are indeed lower than T by both metrics. Its earnings payout ratio is 52.33% and T’s is 66.90%. In terms of cash payout ratios, LUMN’s current payout is 30.19%, again lower than T’s 59.25% by a good margin. Next, we will see how these simple payout ratios can be misguiding.
Source: Seeking Alpha and YCharts data.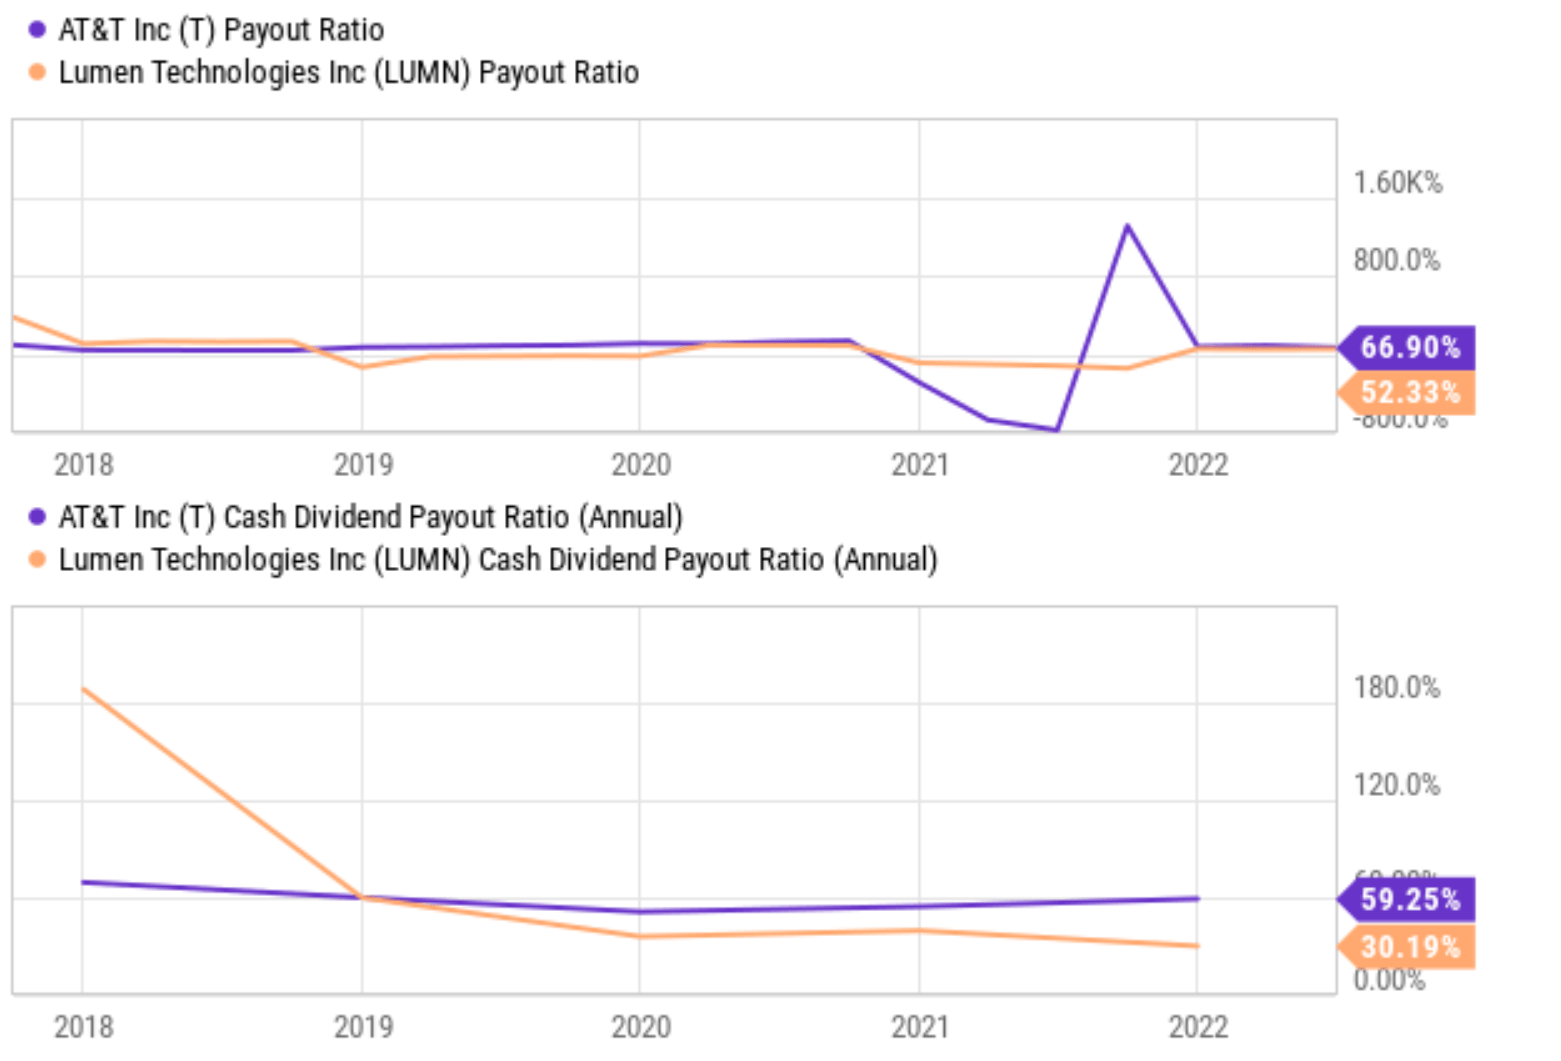
Closer look at dividend safety
A full discussion of the limitations of payout ratios and the holistic assessment of dividend safety can be found in our past articles. Such holistic assessment enjoys the advantage of being comprehensive. The downside is that it’s a bit involved and requires a more intimate understanding of various financial concepts (cash position, working capital, debt, et al). Here, I will just point out a few simple things that you can easily and quickly check.
The first thing to check beyond the simple payout ratios is the debt coverage as shown in the top panel below. LUMN’s interest coverage ratio has fluctuated from about as low as negative 3x to as high as 2.9x in the 5 years, with an average of 0.756x. Its current value of 2.84x is far above its historical average. But in absolute terms, an average interest coverage of 0.756x is just too low (i.e., unsafe) in my view and so is its current 2.8x coverage, especially considering the interest rates uncertainties ahead. A coverage ratio of 0.756x means that on average, its earnings are insufficient to service its debt alone.
In contrast, T’s interest coverage ratios are much safer. It is also more consistent and has fluctuated in a narrower range (relatively speaking) from a low of 4x to as high as 6x in the past 5 years with an average of 3.36x. Its current value of 5.19x is far above LUMN’s and also its own historical average. A coverage ratio of 5.19x means that less than 20% of its earnings will be needed to service its debt. To provide another benchmark, the average debt coverage for the overall economy represented by the S&P 500 is about 6x on average. So LUMN’s current financial strength is far weaker than the overall economy while T is about on par with the overall economy.
The safety issue is further illustrated by the debt-to-equity ratio as shown in the bottom panel. LUMN’s ratio has been in a range from 2x to 3x in recent years as seen. The business deleveraged somewhat since 2020 and the current ratio stands at 2.44x, slightly below its historical average of 2.49x. In contrast, T is much more conservatively leveraged. As seen, its long-term debt-to-equity ratio is about 0.99x only, and its current ratio of 0.83x is about 17% below its already-conservative historical average and also almost only 1/3 of LUMN’s.
Source: Seeking Alpha and YCharts data.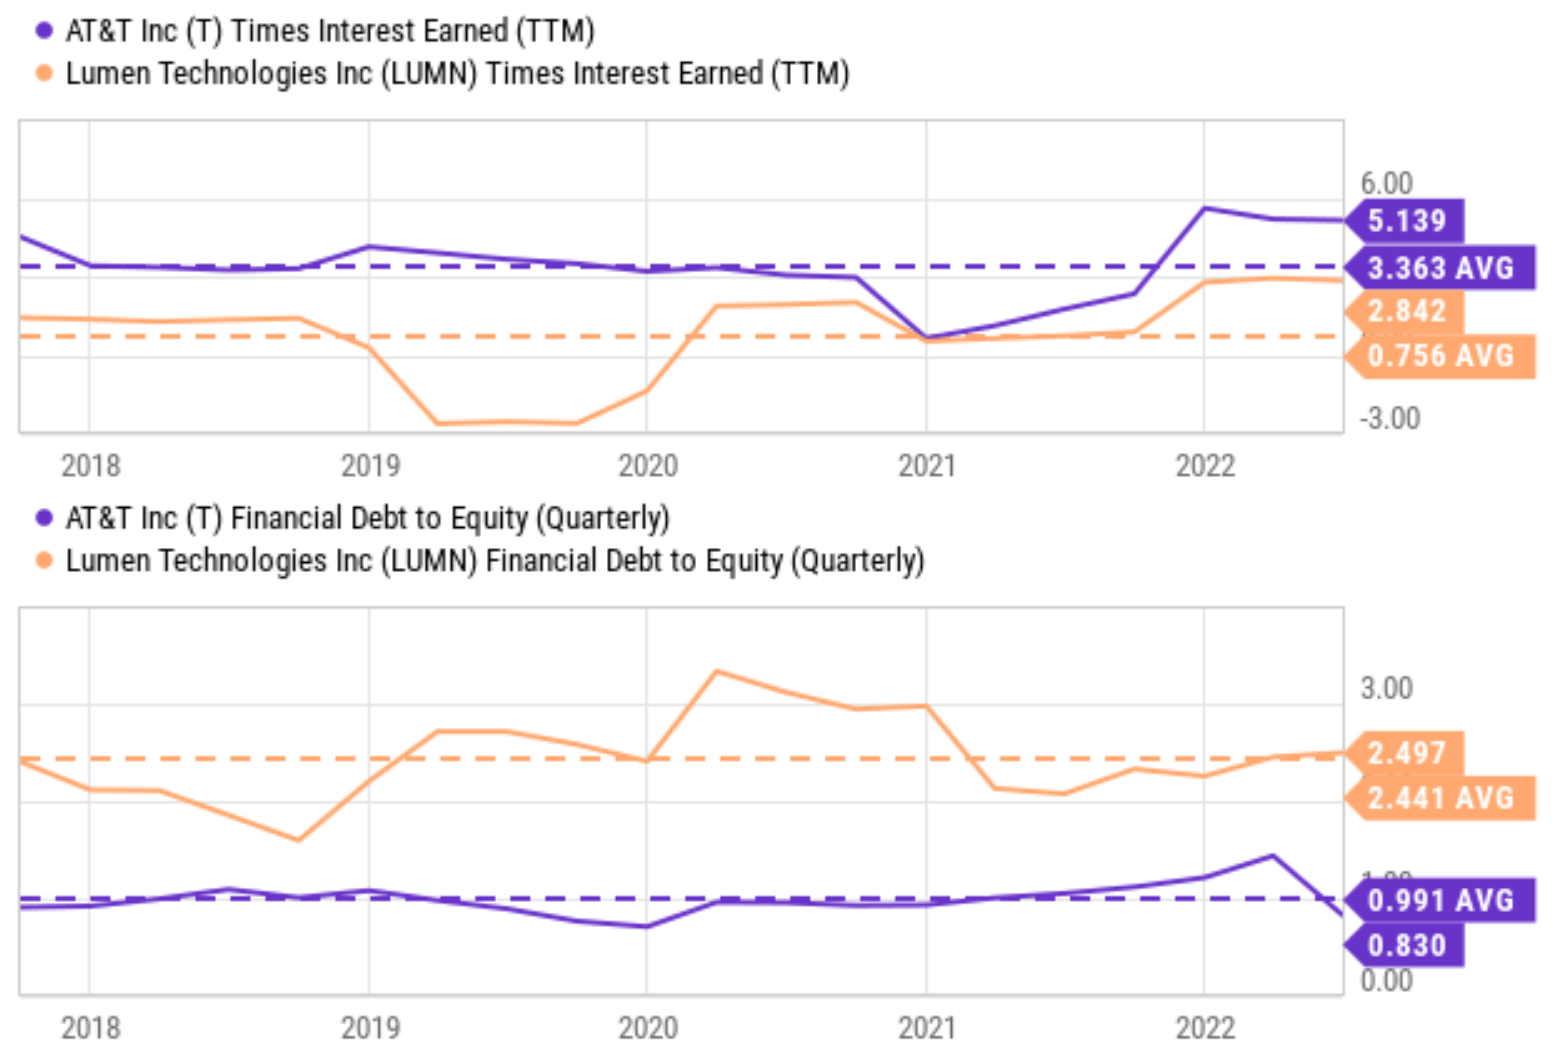
Growth rates and projected returns
Another simple and quick thing to check is the reinvestment rate. A big part of dividend investing involves dividend GROWTH at a rate that can at least combat inflation. Without a healthy and sustainable reinvestment rate, a business will stagnate.
The following chart provides a summary of LUMN and T’s CAPEX expenditures and their total depreciation and amortization (“DA”). And as a quick and dirty approbation, I will use the DA to approximate the maintenance CAPEX. As seen, LUMN has been structurally underinvesting over the years. Its average DA over the past few years since 2018 was about $1.12B, while its CAPEX investments have been on average $0.813B. Currently, its quarterly DA stands at $827M while its CAPEX investment is only $761, a gap of about $60M.
T has been systematically underinvesting also over the past few years. Its average DA has been $6.45B since 2018, and its average CAPEX investment has been $4.62B during this period. Therefore, again if we assume DA represents the maintenance CAPEX requirements, then T has been on average underinvesting $1.83 billion over the past few years. However, you can see that the picture changed dramatically for T in recent quarters since the Warner spinoff. Its total DA has substantially decreased to the current level of $3.37 billion, while its CAPEX expenditures remain at the historical average of $4.72 billion, thusly creating a net positive growth CAPEX investment into the business.
Looking forward, I see the positive growth CAPEX investment to continue for T. The WarnerMedia spinoff provides its more capital allocation flexibility by lowering its debt burden immensely and also allows it to better focus on 5G and fiber rollout.
Source: Seeking Alpha and YCharts data.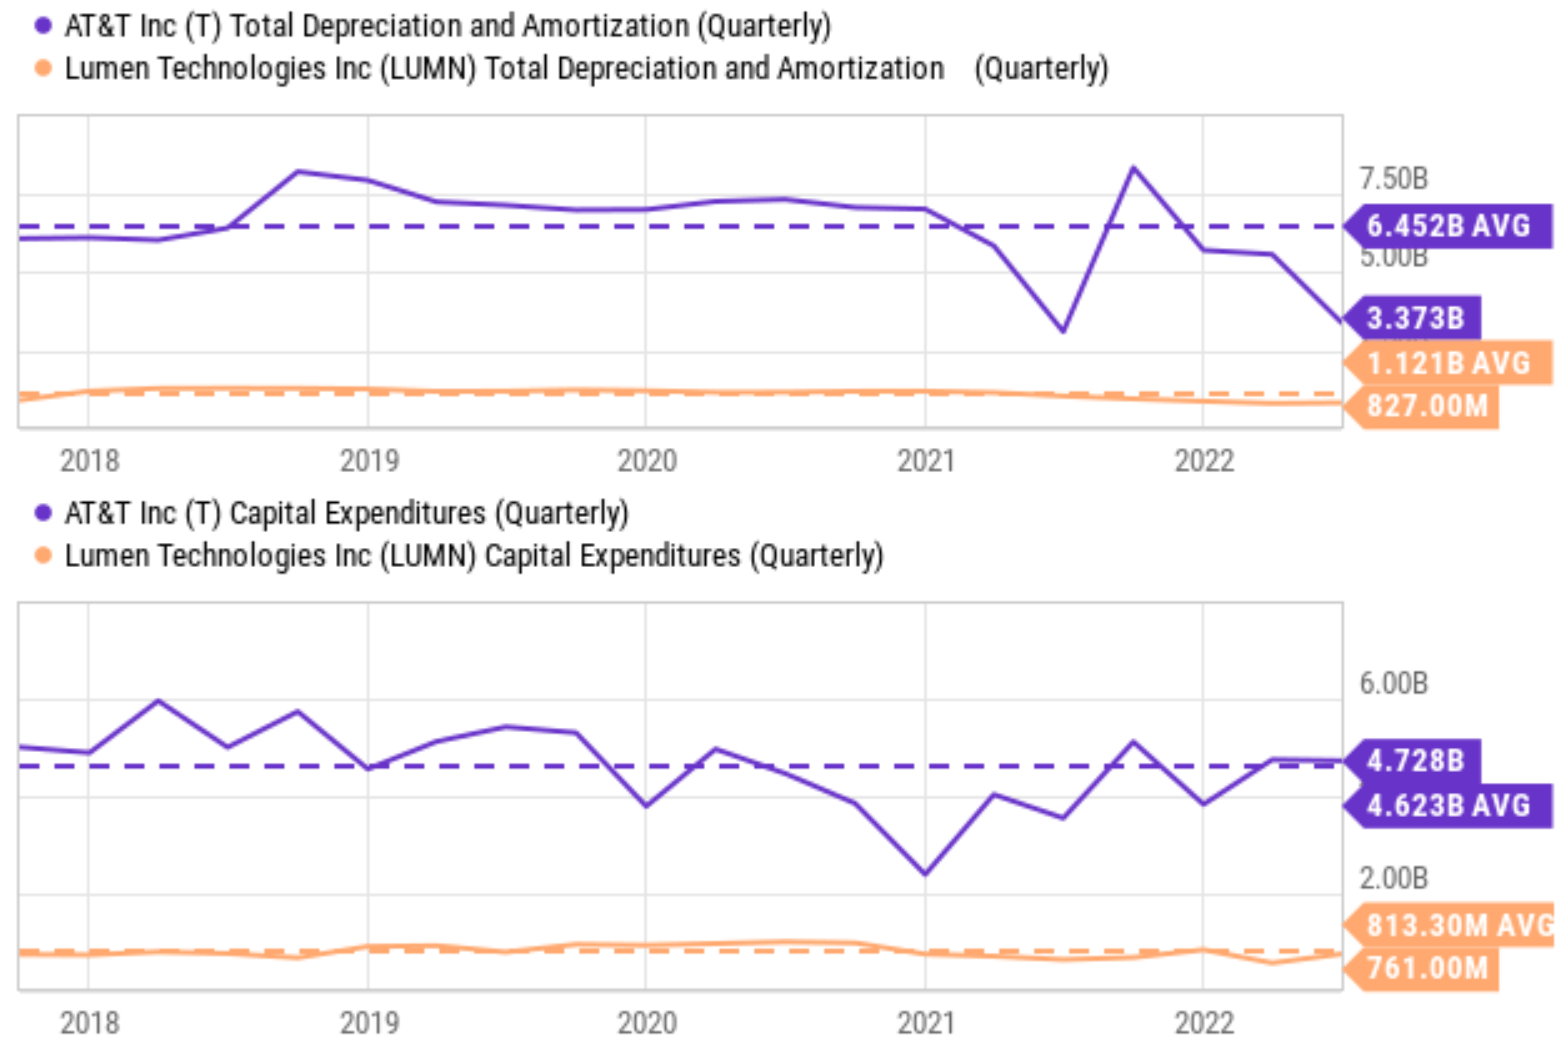
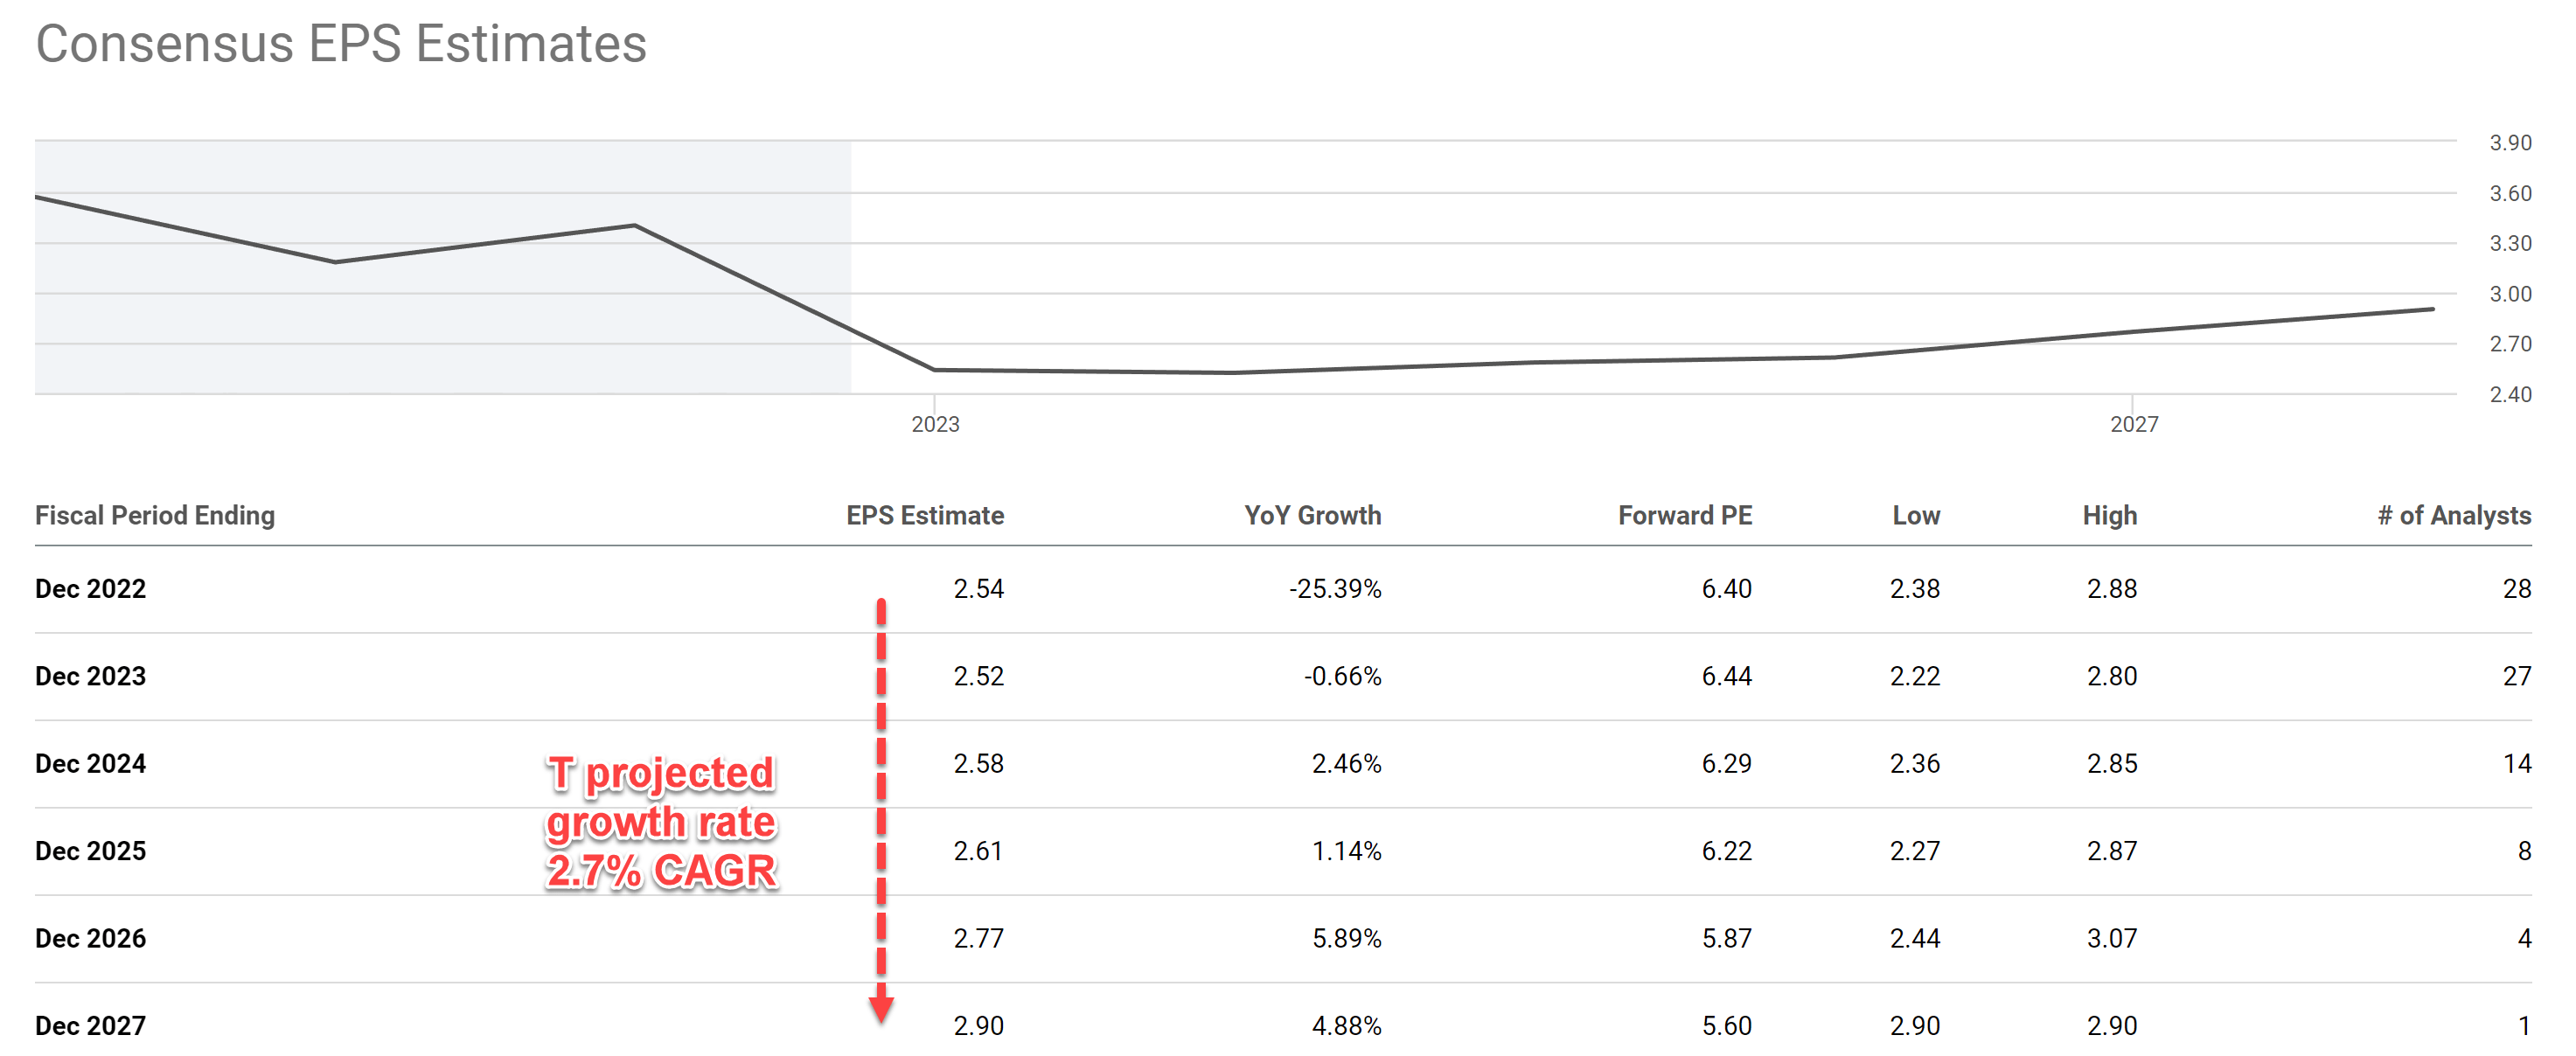
In the long term, the growth rate is simply the product of ROCE (return on capital employed) and reinvestment rate. For T, its reinvestment rates are about 10% based on my analysis using its recent financial data, and its ROCE is about 30.3%. As a result, its long-term growth rate would be about 3% (10% reinvestment rate x 30% ROCE = 3% growth rate). And as you can see, the consensus estimates project an earnings growth rate of 2.7% in the next few years, consistent with my estimate.
And the projected returns in the next 3~5 years as summarized in the following waterfall chart. This projection assumes the following return drivers:
- I am assuming a 2.7% growth rate to be more on the conservative side.
- 1% share dilution per year, consistent with its historical trend in recent years
- The dividend yield remains at the current 6% level
- A valuation reversion to the mean. Its current 6.4x FW PE would contribute about 8.2% of annual return if fully recovered to its historical mean of about 9.5x in the next ~5 years. However, its recovery and post-Warner consolidation may take longer and here I am modeling a valuation reversion to 8.5x PE in the next 3~5 years, contributing a 5.5% annual return.
Based on the above assumptions, the annual return should be around 13.2% a year as shown below.
Source: Author based on Seeking Alpha and YCharts data. Source: Seeking Alpha and YCharts data.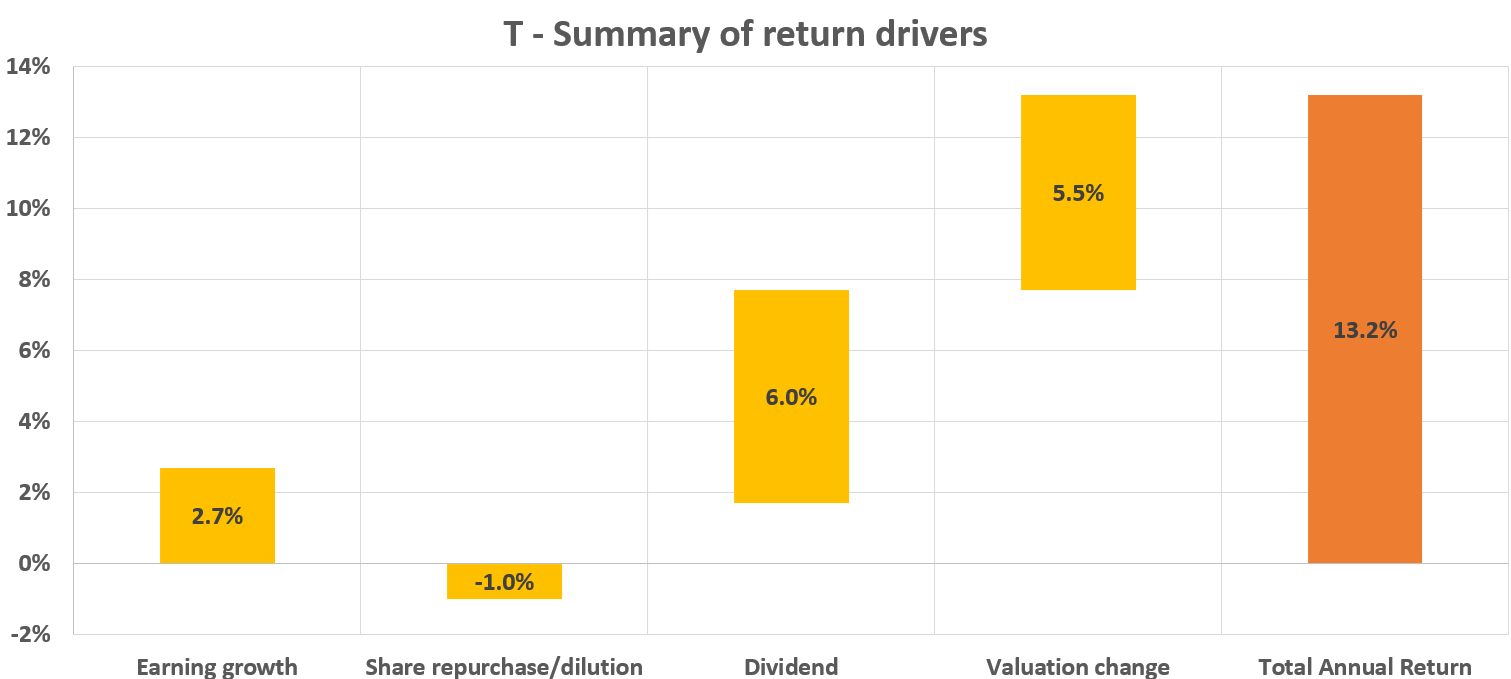
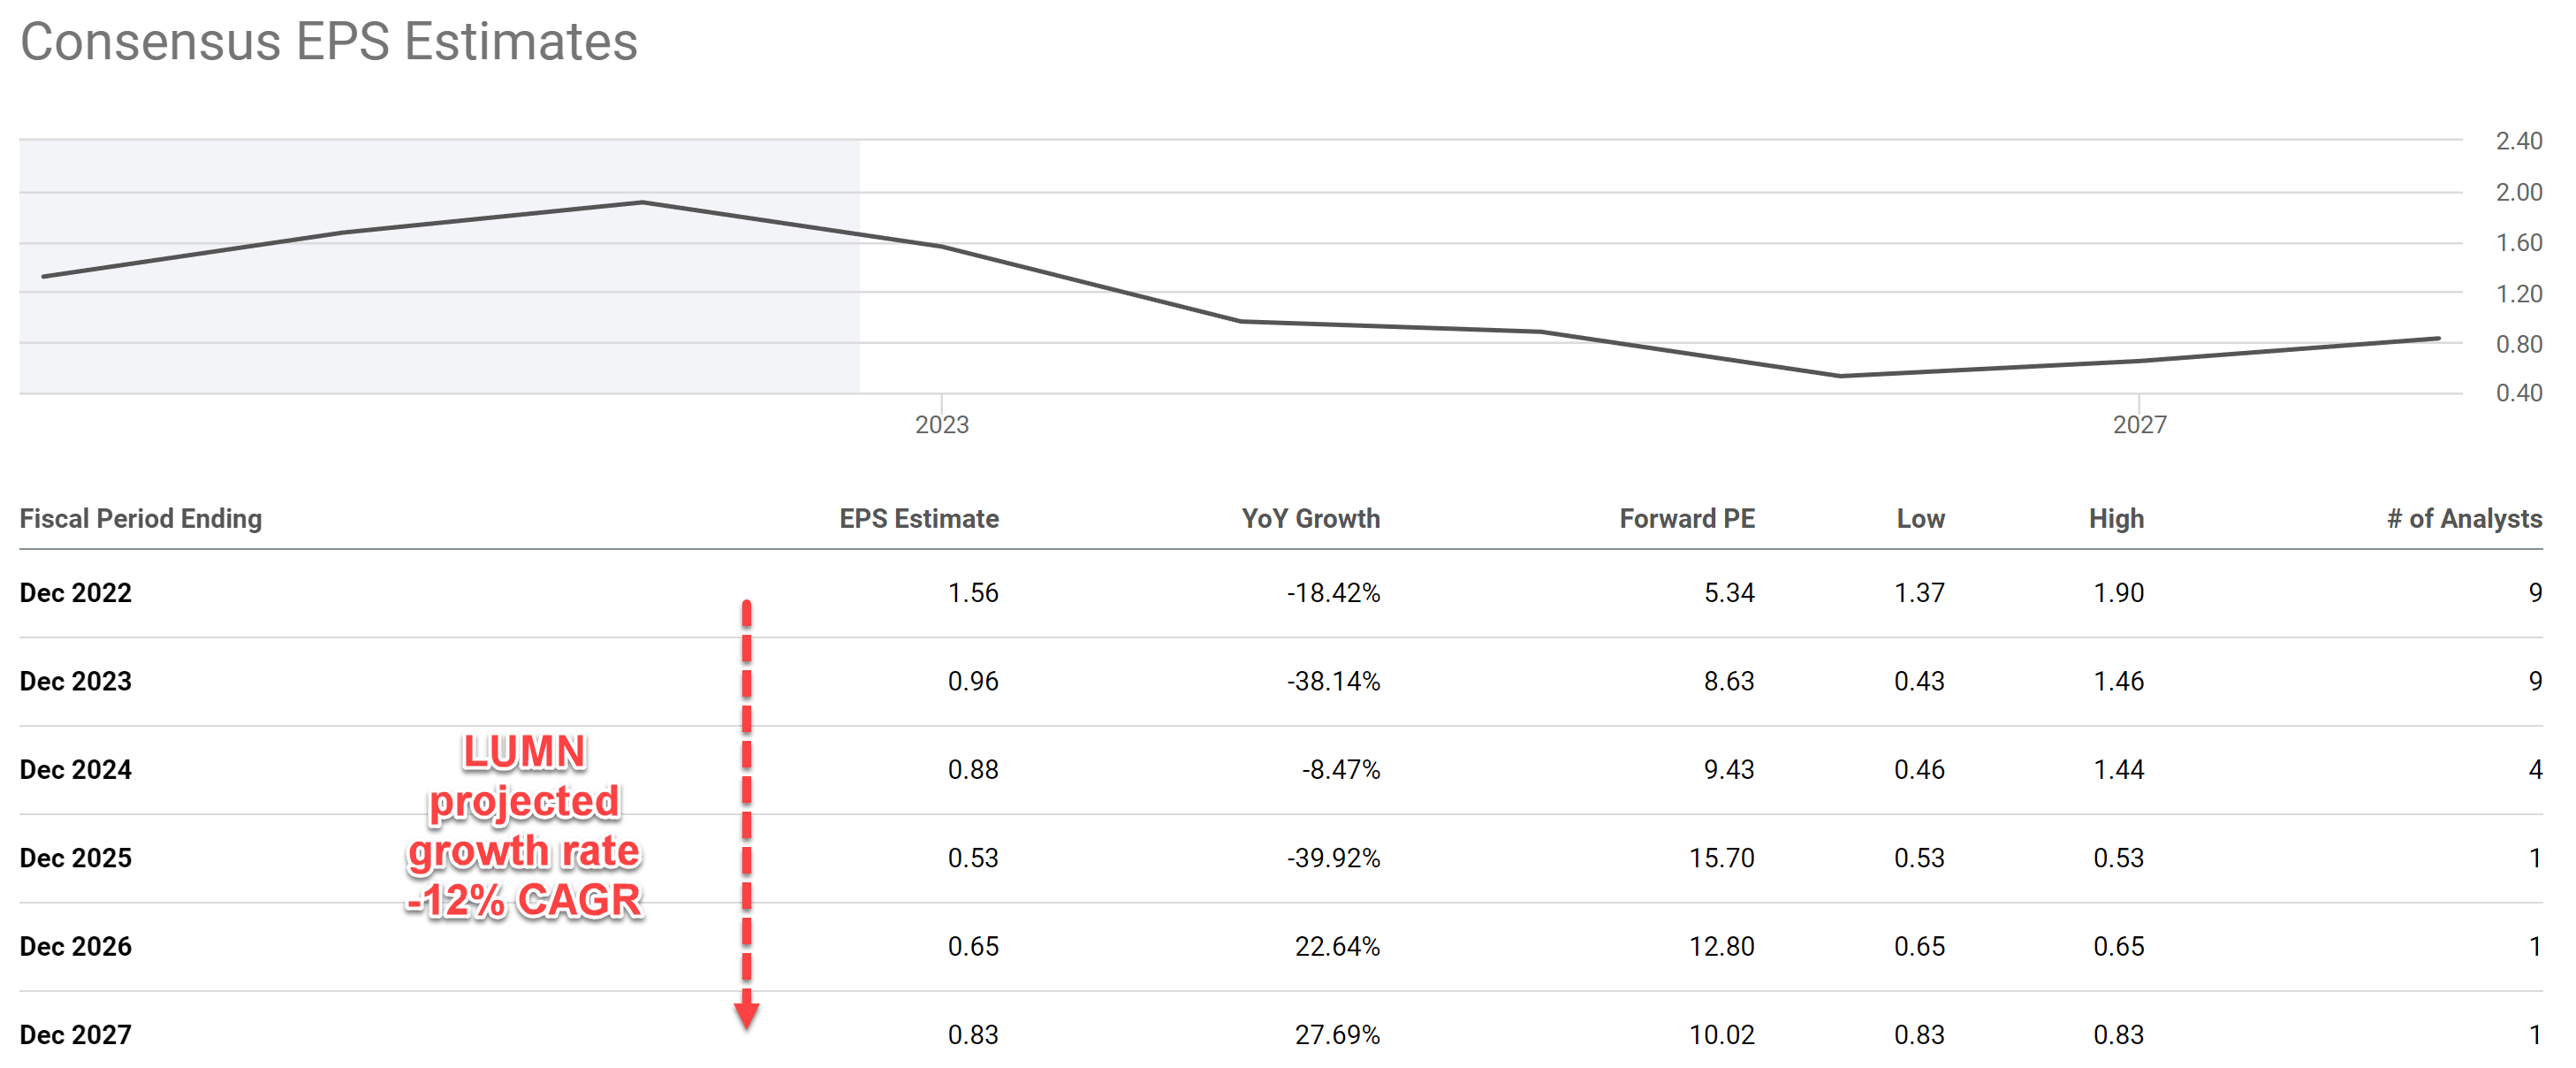
The picture for LUMN would be dramatically different. First, I do not expect meaningful growth due to the lack of growth CAPEX investment as aforementioned. Consensus estimates actually project a contraction of EPS (from the current level of $1.56 to $0.83 in 2027) at a rate of 12% per year. Secondly, I do not expect valuation expansion either. When EPS stagnates or even contracts, the stock is very likely to be terminally cheap. Therefore, the best return scenario in my mind for LUMN is very likely in the single digits as shown despite its 10%+ dividend. A large part of the return provided by its dividends is likely to be canceled off by earnings contraction and valuation compression (let alone the possibility of a dividend cut if enraging do decline).
Source: Author based on Seeking Alpha and YCharts data. Source: Seeking Alpha and YCharts data.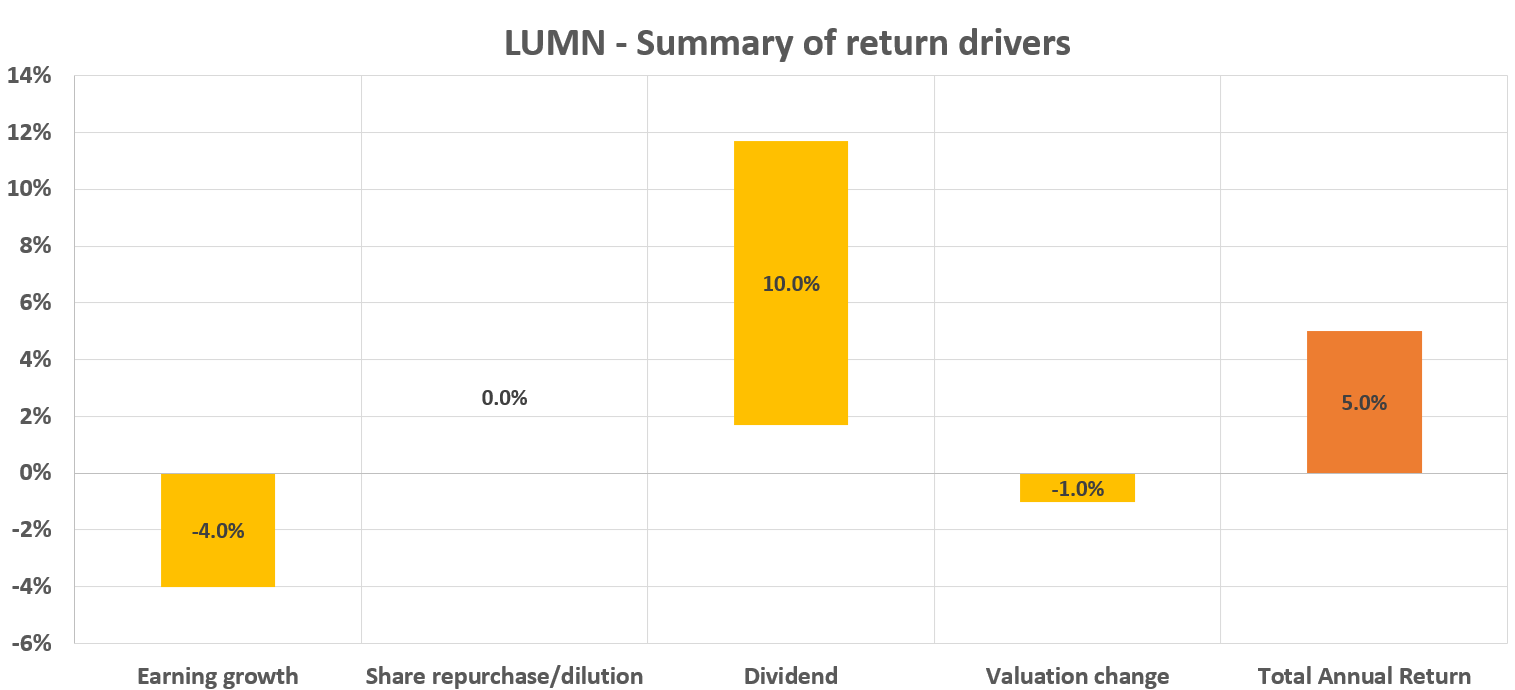
Other risks and final thoughts
To reiterate, I am not trying to argue that T’s problems just disappear because LUMN’s problems are similar and even worse. Conservative accounts with a short timeline may want to sit on the sidelines for both stocks, as they both face tremendous uncertainties in the near term. Besides the risks aforementioned, there are considerable macroeconomic risks brewing, ranging from geopolitical tensions, to inflation, and to a full-scale recession.
Specific to LUMN, its mature business has been in a chronic decline. And management is trying to retain customers with newer offerings such as cloud-based solutions, IP/VoIP services, and automating VPN data networks. However, these efforts required sustained capital requirements, while the business’ capital allocation is constrained by its debt burden, dividend commitment, and earning pressures. For T, its nonrecurring charges such as debt repayment, restructuring, and asset impairments are expected to persist into the near future as the company continues its operation streamlining post the Warner spinoff. Its 5G and fiber CAPEX requirement will remain high for a while, and the lower free cash flow guidance is concerning.
To conclude, investors, even income-oriented investors, should not solely base their investment decisions on dividend yields and simple payout ratios. These metrics offer simplicity (which is good) but can be partial or even misleading. Investors should look beyond these simple metrics to evaluate the financials holistically and focus more on the total return potential instead of just dividend yields. Specifically, for T and LUMN, I am seeing a total return potential in the double-digits for T and mid-single digits for LUMN despite LUMN’s current yield of 12% being almost 2x higher than T’s 6.8%. Furthermore, for the safety of the dividend itself, I also see T in a better position than LUMN despite LUMN’s more conservative payout ratios on the surface.
Be the first to comment