Justin Sullivan
AT&T Inc. (NYSE:T) has just declared its Q3 earnings as covered by Seeking Alpha here. It is still very early, but it appears like the stock is reacting favorably to a trifecta of good news: EPS beat, Revenue beat, and increasing guidance.
We have a history of analyzing AT&T’s free cash flow (“FCF”) before and after earnings, as covered in this article after 2022 Q1 results. But why FCF, you may ask?
Why cash flow over EPS
When evaluating dividend coverage, most investors and analysts tend to look at earnings per share [EPS]. We prefer free cash flow as a better indicator of financial health for these reasons:
- Earnings tend to be up and down depending on rare events and write-offs.
- Earnings are more prone to GAAP-related fluctuations.
- Cash flow is king.
Let’s see how AT&T’s third quarter results stack up from this perspective.
- Total shares outstanding: 7.126 Billion
- Current quarterly dividend per share: $0.2775
- Quarterly FCF required to cover dividends: $1.977 Billion
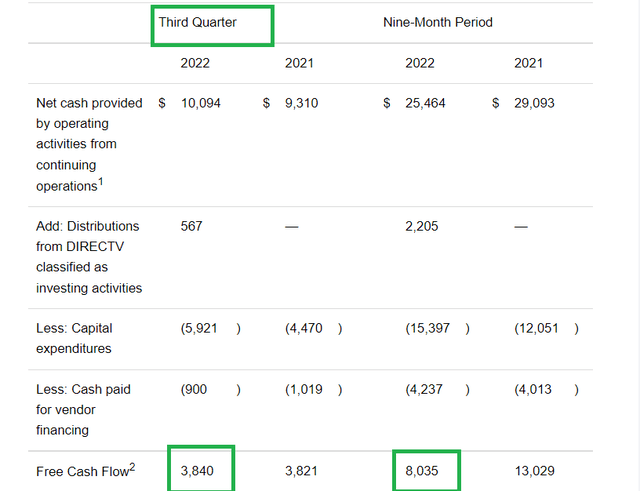
- FCF in Q3: $3.84 Billion, as shown in the table below.
- Payout ratio using Quarterly FCF: 51% ($1.977 Billion divided by $3.84 Billion)
- EPS reported: 68 cents
- Payout ratio using Quarterly EPS: 40% ($0.2775 divided by $0.68)
We just published an article on International Business Machine Corporation’s (IBM) dividend coverage, and this exercise brought light to the fact that short term numbers can sometimes be misleading. IBM’s dividend coverage looked much healthier when using annual FCF and EPS over its quarterly. Although AT&T’s quarterly numbers look healthy above, could the reverse be true here where AT&T had one great quarter but overall numbers don’t look that good? Let’s find out.
- Total shares outstanding: 7.126 Billion
- Current annual dividend per share: $1.11
- Annual FCF required to cover dividends: $7.90 Billion
- FCF so far in FY 2022: $8.035 Billion, as shown in the table above. The company has generated enough cash flow in three quarters to cover annual dividend payout. Obviously, they need more cash flow than just to pay dividends and the annual FCF projection last stood at a healthy $14 Billion.
- Payout ratio using Annual FCF: 56% ($7.90 Billion divided by $14 Billion)
- Projected forward EPS: $2.55
- Payout ratio using Annual EPS: 43% ($1.11 divided by $2.55)
How do we look?
Both quarterly and annual FCF/EPS based dividend coverage look strong at the moment. Although we’ve been hurt by AT&T’s high yield in the past, these numbers look strong enough to give some hope for future dividend increases. In addition, comparing Q3 numbers to Q1, AT&T has shown either continuing or improving strength.
Back to this quarter’s results, key highlights include the following:
- AT&T showed a great deal of strength in postpaid net adds with ~700K added, which pushes total adds to 2.2 Million. This is expected to be industry leading numbers as Seeking Alpha has reported.
- Wireless showed its best growth in more than 10 years. Mobility continued improvements with a 6% YoY revenue increase.
- Free cash flow for entire year re-affirmed to be in the $14 Billion range.
- To summarize the quarter and current forward-looking guidance, the new (or what should have been the original) AT&T is showing improvements in many areas and this is reflected in the guidance:
“We now expect our adjusted EPS* from continuing operations for the full year to be $2.50 or higher.”
Conclusion
These are some solid numbers, especially from a company trading at such low valuation that its P/E is less than its yield. But long term, AT&T investors like us know better than just to be enamored by the yield. AT&T’s debt situation is something to always be monitored given the company’s history. When looking at the debt level, bear in mind that the recent reduction shown on many websites is primarily a result of the spinoff. So, the key level to watch is around the $140 Billion to $150 Billion, which reflects the stand-alone AT&T.
Although it was well known that the company would need to spend to keep up the demand on its fiber-optic network, this news has AT&T investors worried about the company taking on more debt, as can be seen in the comments there. And rightly so. This is also one of the reasons why FCF is more indicative than EPS for a capital intensive business like AT&T.
We are holding all our shares and are reinvesting the high dividends. AT&T will become a sell candidate if the debt situation worsens, but in about 3 quarters since the spinoff, AT&T has shown clearly it is a better telecom company than a conglomerate.


Be the first to comment