

Nastco/iStock via Getty Images
Q3 recap and thesis
Both AT&T (NYSE:T) and Verizon (NYSE:VZ) have released their Q3 earnings report (“ER”) in later Oct 2022. Before we review the Q3 ER, let me first provide context by recapping their Q2 results. Both companies reported disappointing results in Q2. T lowered its free cash flow (“FCF”) forecast by $2B (from $16B to $14B) for the 2022 full year. VZ missed consensus estimates and lowered its 2022 full-year guidance also. The market response was brutal as you can see from the chart below. After the Q2 results, both stocks were in a free fall and suffered a maximum drawdown of almost 30% in total.
Then came the Q3 ER. The results were a lot more upbeat this time. VZ’s Q3 results beat consensus estimates on both lines. Its Non-GAAP EPS came in at $1.32, beating consensus estimates by $0.03. And its revenues came in at $34.2B, beating consensus estimates by $410M and translating into an annual growth rate of 4.0%. VZ commented that it anticipates growth in the range of 8.5%~9.5% for 2022 in its wireless service segment. It also reaffirmed its adjusted EPS outlook of $5.10 to $5.25. T also delivered Q3 results that beat consensus estimates. T’s Q3 Non-GAAP EPS came in at $0.68, beating consensus estimates by $0.07. And its revenue came in at $30B, also exceeding consensus estimates by $140M (although revenues declined by 4.2% YOY). More importantly, the business added 964k total subscribers over the quarter and reaffirmed its cash flow outlook for the year. And as you can see from the following chart, the market responded much more positively this time. Both stocks have recovered significantly after the Q3 results.
After the Q2 results, the top concern for many T and VZ investors (myself included) must be the possibility of a (or another dividend cut). For T, I was concerned about another dividend cut because its H1’22 free cash flow was insufficient to cover its ongoing dividends. And for VZ, I was concerned about the sustainability of its generous dividends considering its CAPEX plans and debt obligations.
However, with the reaffirmed guidance and business outlooked provided in the Q3 ER, I see business turned a corner in both places. I have no concern about a dividend cut anymore in the foreseeable future as to be elaborated on next.
Source: author and Seeking Alpha.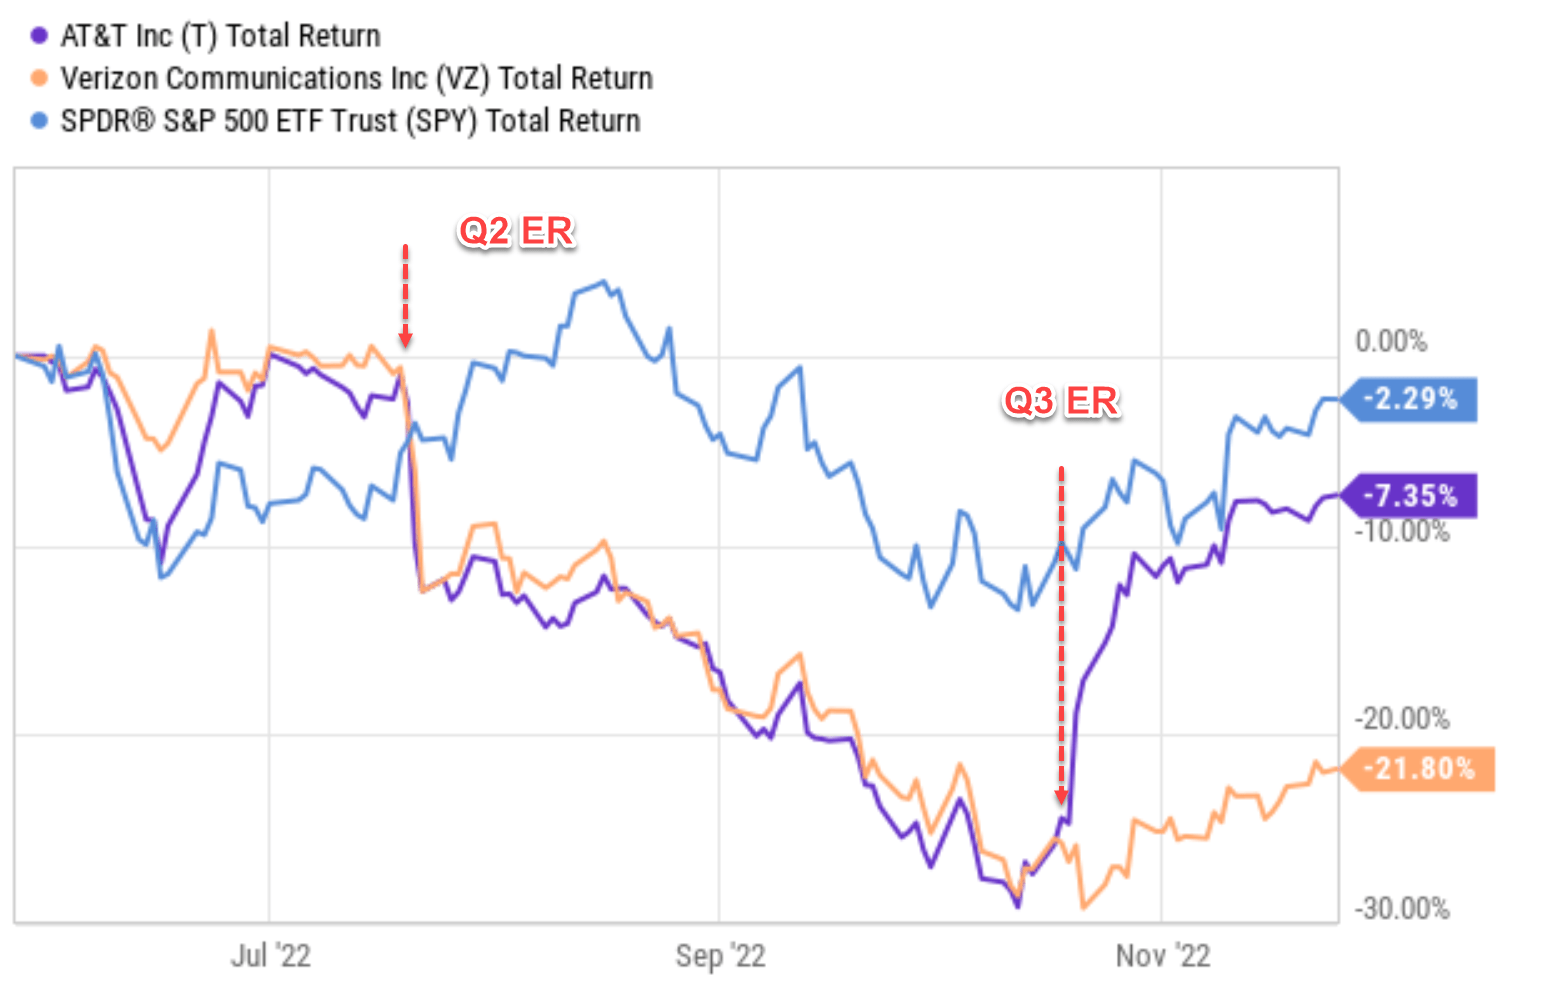
T and VZ Q3: FCF in focus
First, let’s take a look at their FCF forecast and compare that to their immediate dividend obligations. VZ’s operating cash flow came in at $28.2B as of TTM 2022 and its CAPEX expenditures totaled $15.8B as commented by VZ’s CFO Matt Ellis below (slightly edited with emphases added by me):
Cash flow from operating activities for the first three quarters of 2022 totaled $28.2 billion compared with $31.2 billion in the prior year period as working capital impacts from higher device activations and increased inventory levels continue, as we expected. Capital spending for the first three quarters of the year totaled $15.8 billion, an increase of $2.0 billion compared to last year. C-band spending was $4.5 billion for the first 9 months of the year. The net result of cash flow from operations and capital spending is a free cash flow of $12.4 billion for the first three quarters of the year.
As a result, VZ generated a total FCF of $12.4 billion for the first 3 quarters of 2022. Its dividend obligations for the first 3 quarters of 2022 were $8.07B in total in comparison, comfortably covered by its FCF. Furthermore, its leverage is also stable. Its debt-to-adjusted EBITDA ratio sat at 2.7x as of Q3, unchanged from the previous year.
Source: VZ Q3 ER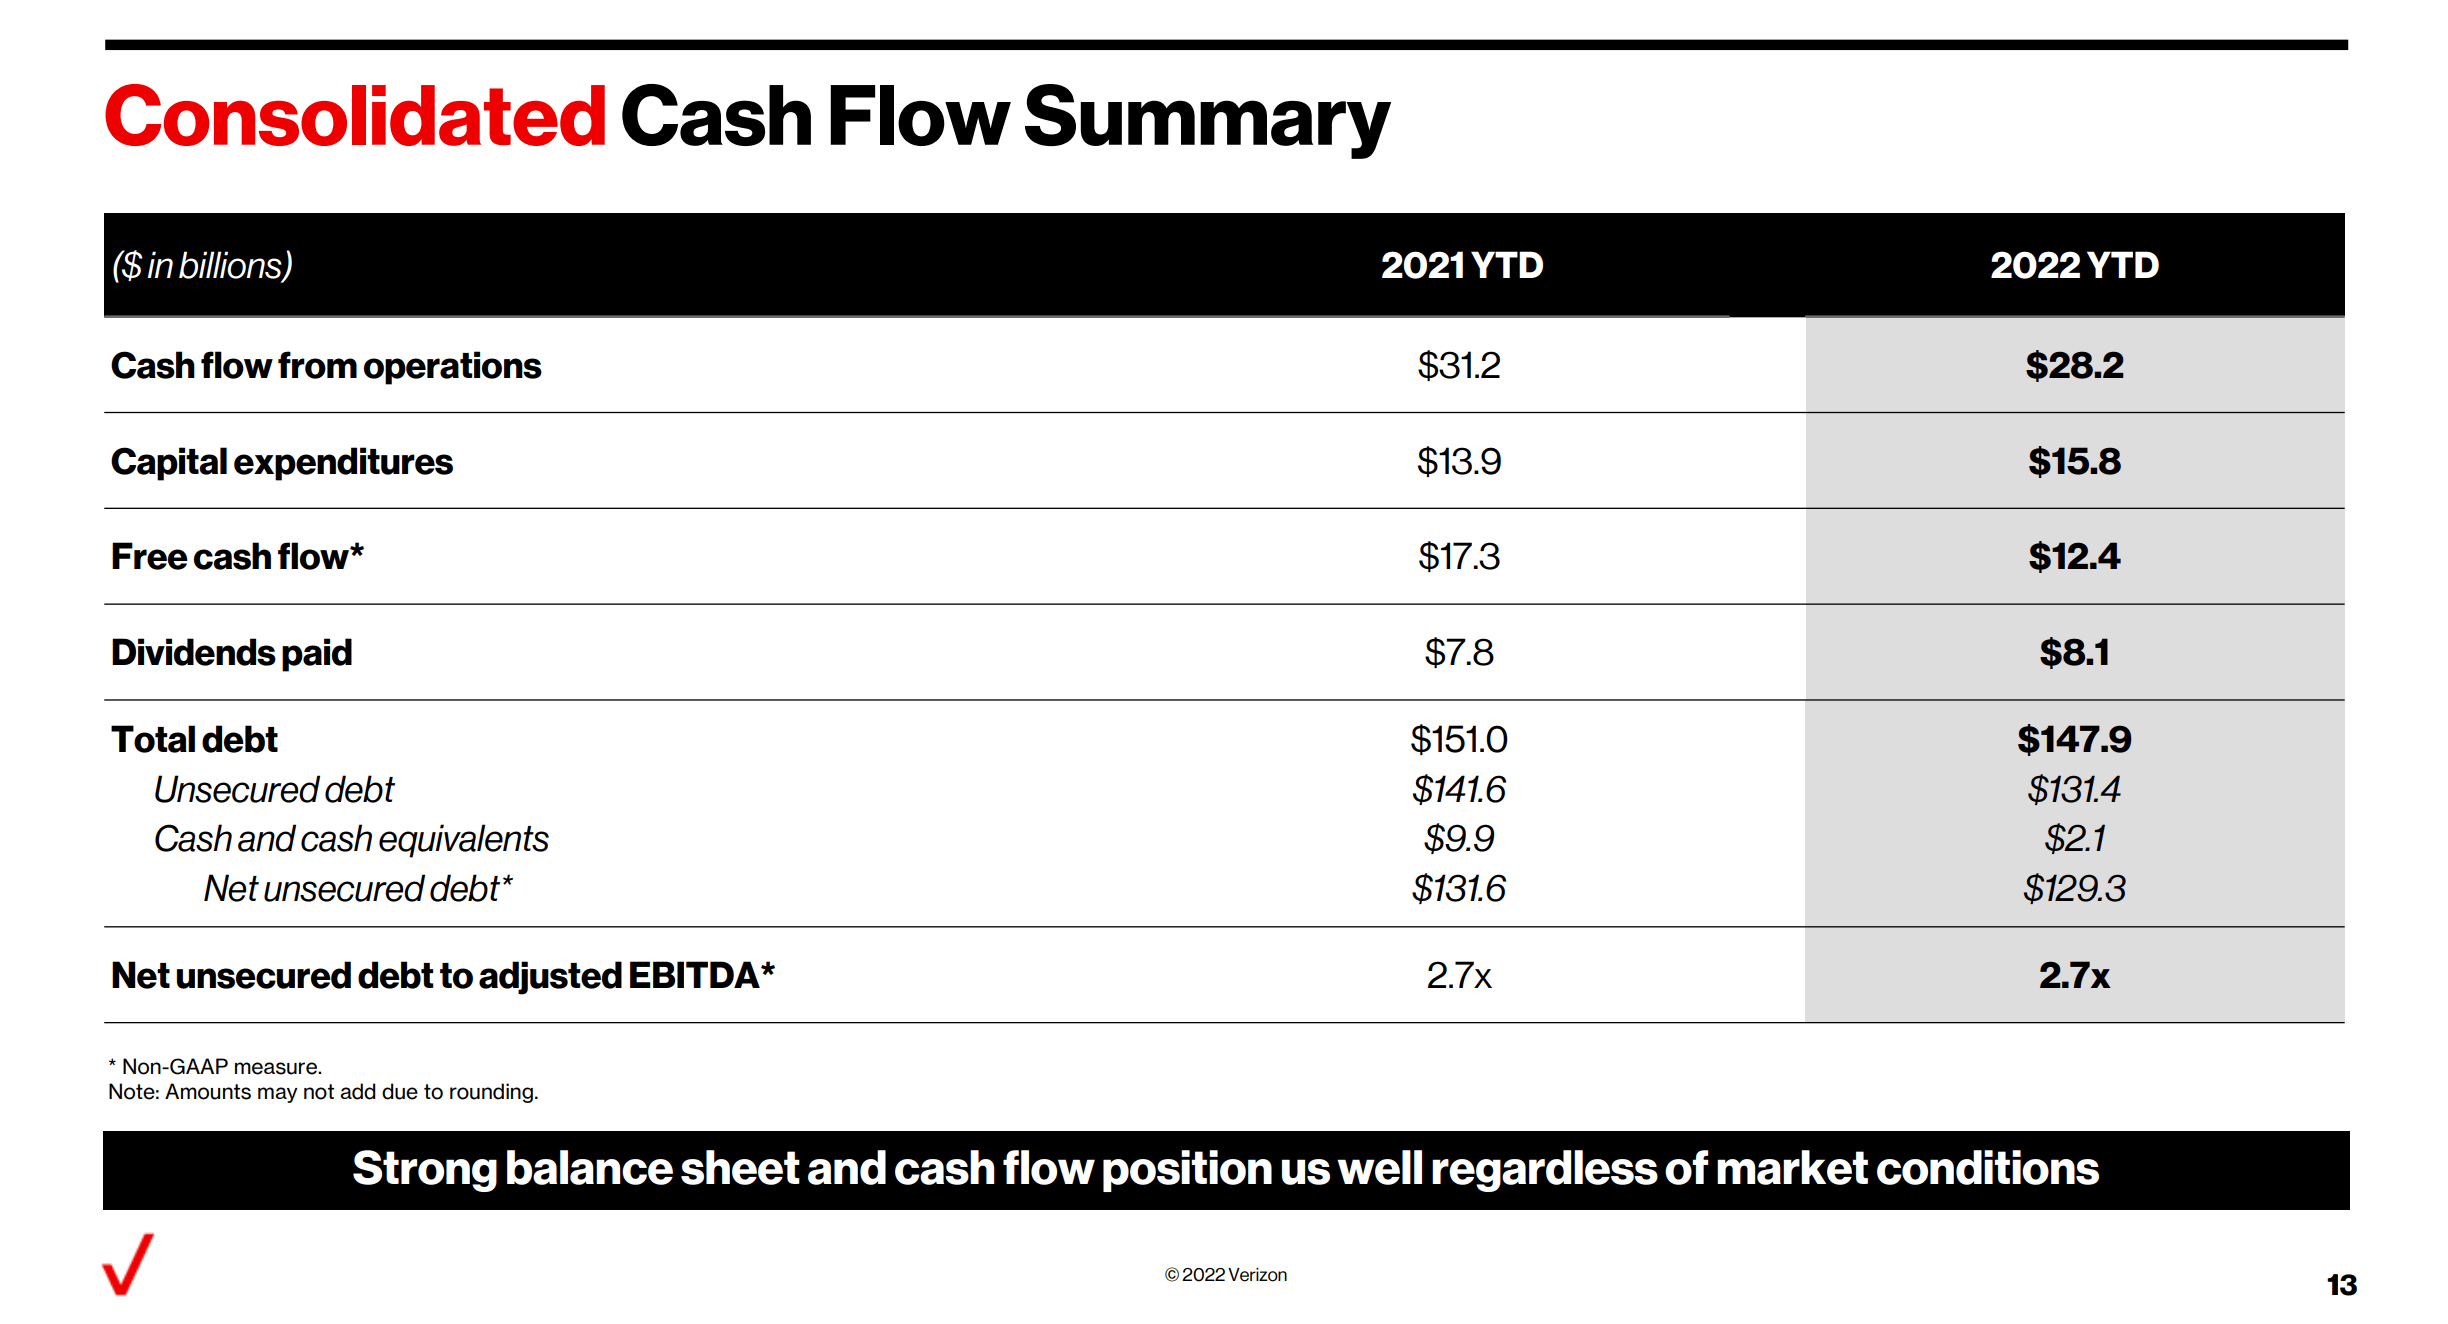
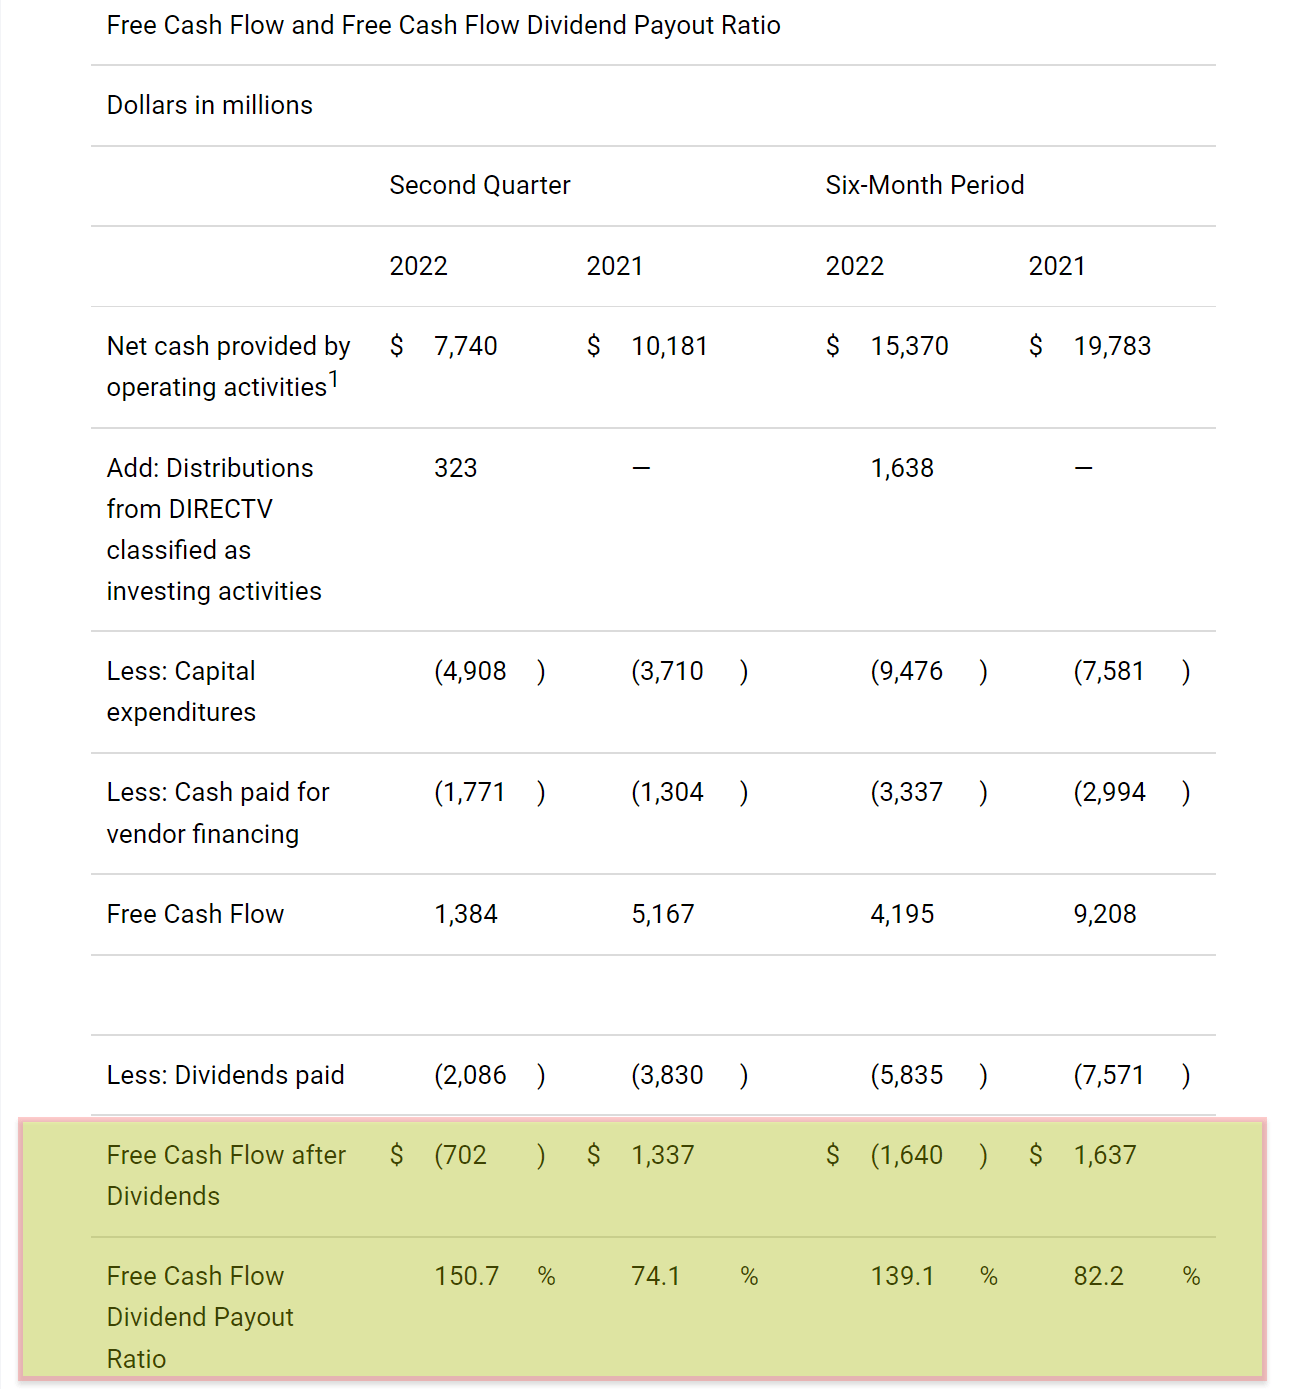
The FCF picture for T is a bit more stretched. In VZ’s case, even the FCF can cover the dividends with no problem (with an FCF payout ratio of 65% only in the first 3 quarters of 2022). In T’s case, its FCF came in at $3.8 billion in Q3 as you can see from the following chart. And its FCF totaled $4.19B for the first 6 months of 2022 as you can see from the 2nd chart below. As a result, T generated a total FCF of $7.77 billion for the first 3 quarters of 2022. Now, its dividend obligations for the first 3 quarters of 2022 were $7.84B in total, slightly above its FCF. Its FCF payout ratio is 100.9% for the first 3 quarters of 2022. It is concerning, but much better than what it was in the previous quarter when the FCF payout ratios were in the range of 139% to 150%.
Source: T Q3 ER Source: T Q2 ER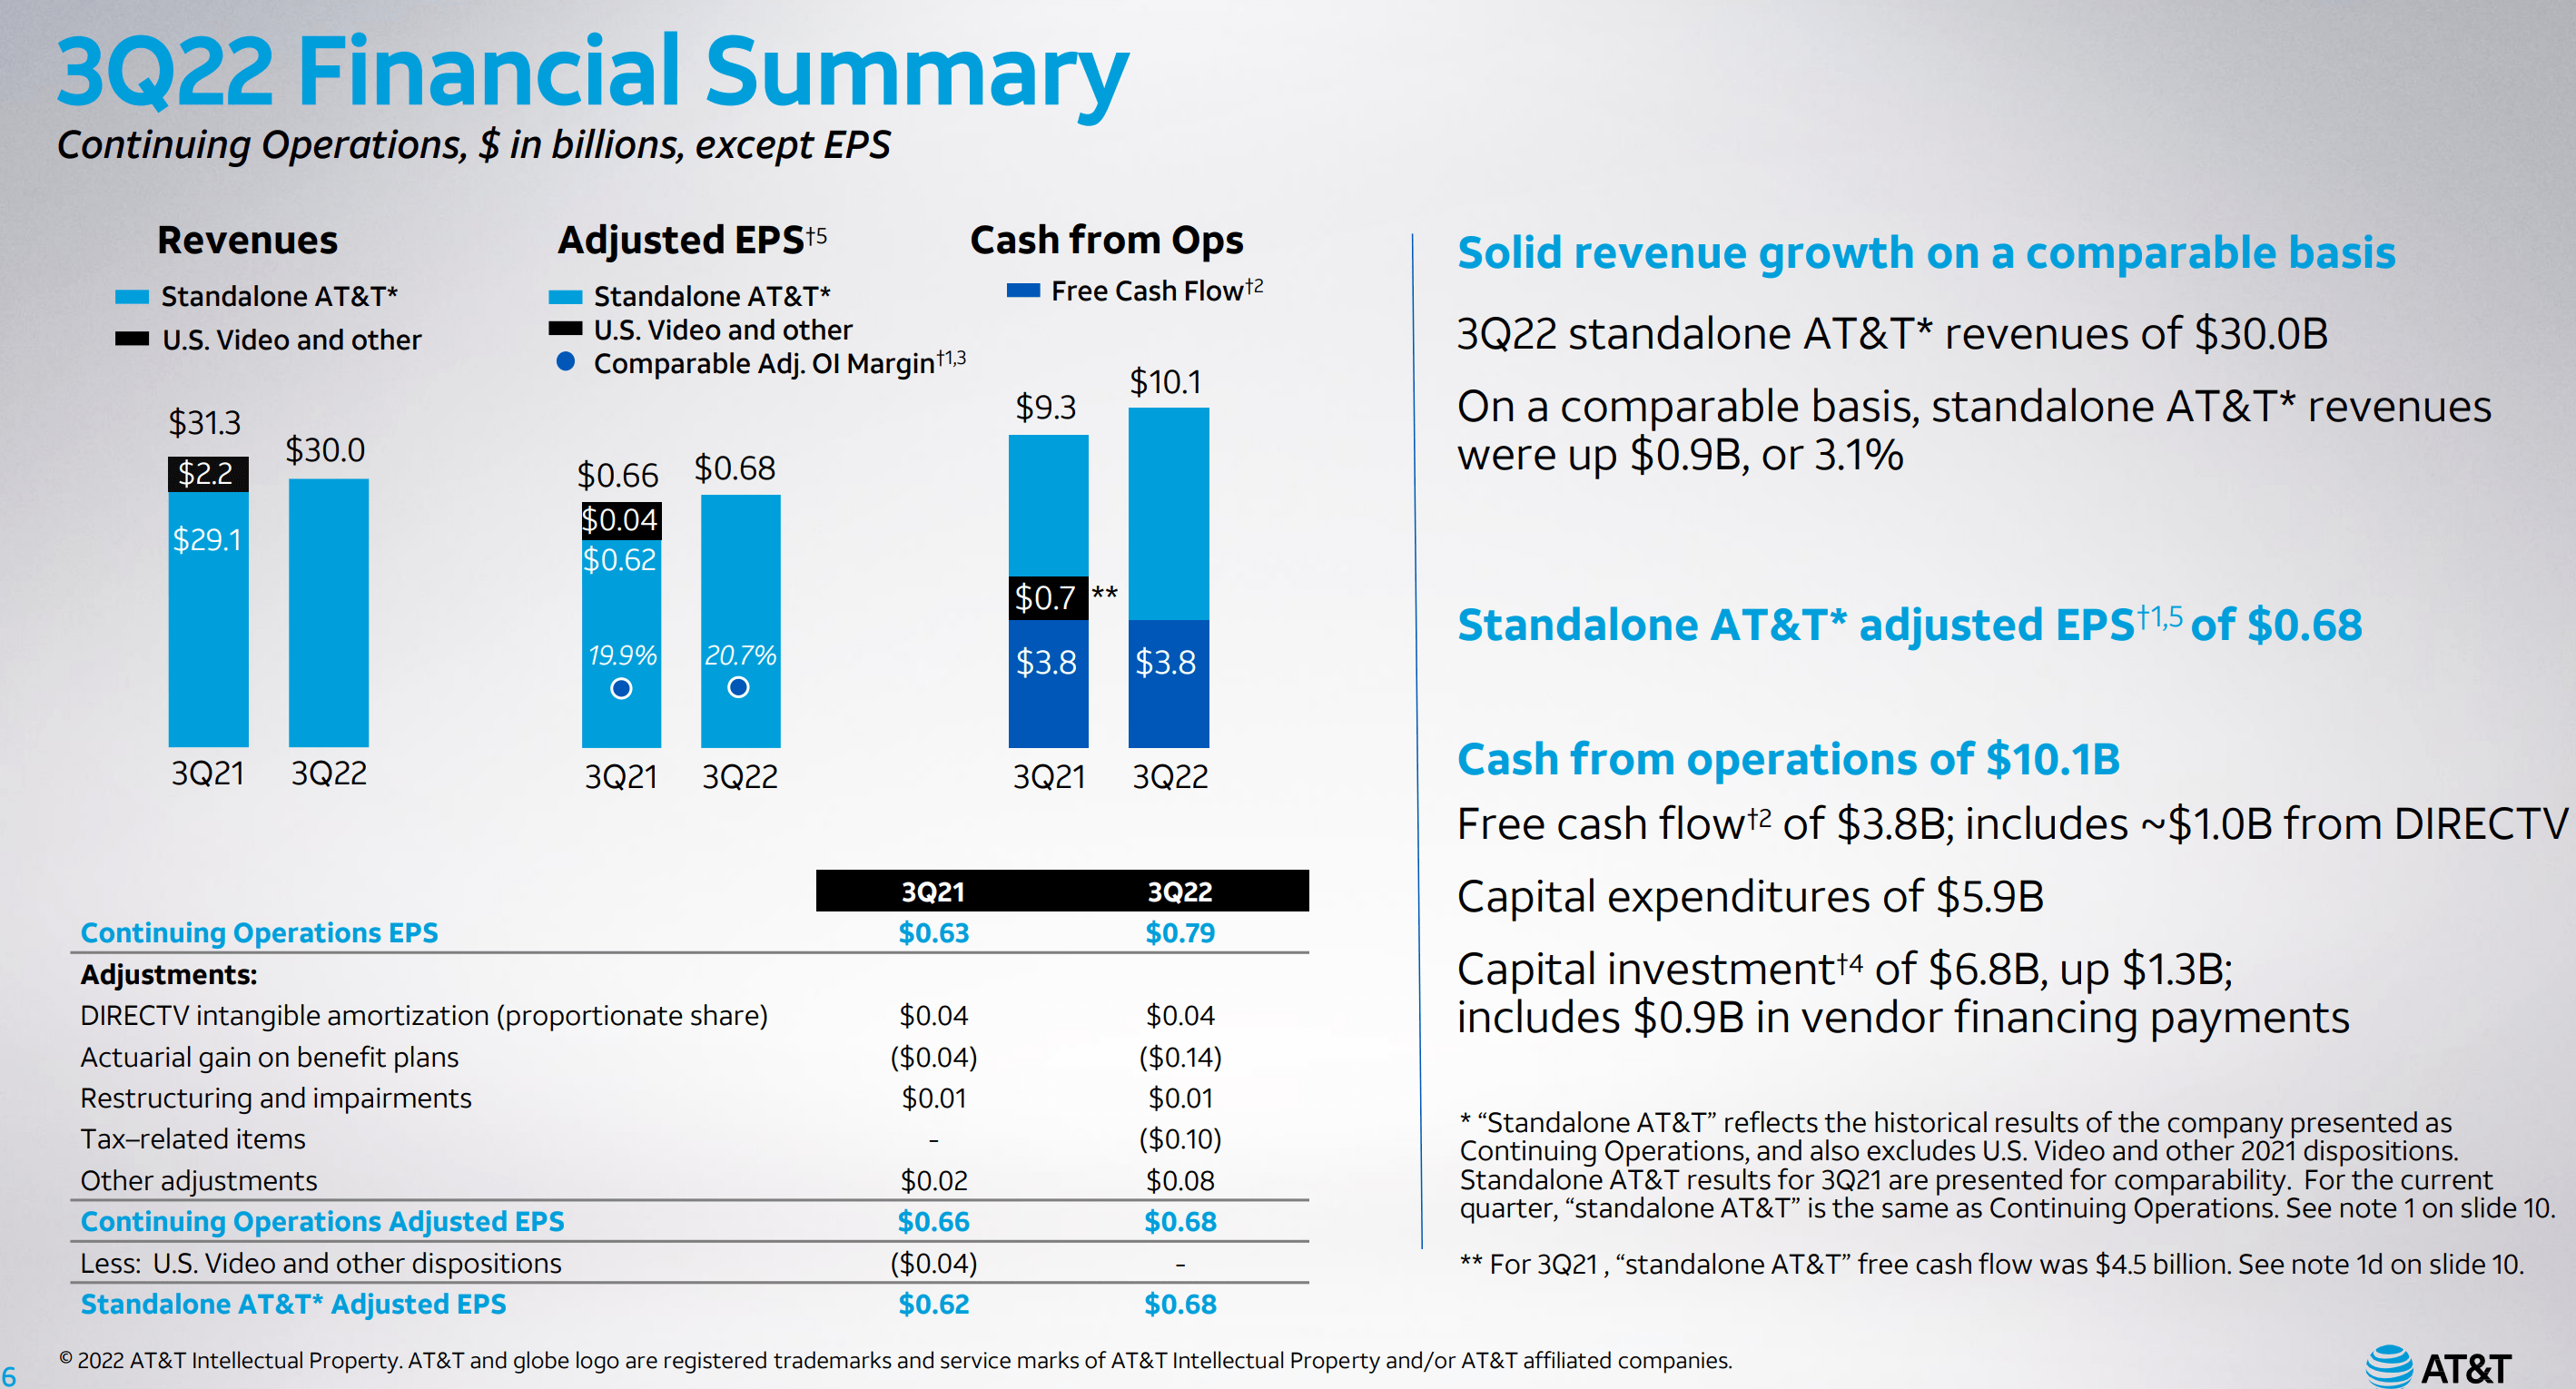
Dividend safety: a more holistic and broader view
The above simple FCF payout ratio addresses the immediate dividend safety issue. Besides the short timeframe, as explained in my earlier article, such simple payout ratios are also limited in other ways:
- The simple FCF payout ratio neglected the current asset. Obviously, for two firms with the same earning power, the one with more cash sitting on its balance sheet should have a higher level of dividend safety.
- The simple FCF payout ratio also neglected the upcoming financial obligations. Again, obviously, for two firms with the same earning power, the one with a lower level of obligations (pension, debt, CAPEX expenses, et al) should have a higher level of dividend safety.
The simple FCF payout ratios neglected all these important factors. For a more thorough analysis of dividend safety, we found the dividend cushion ratio a powerful method. An elaborated description of the method is provided in Brian M Nelson’s book entitled Value Trap. A summary is quoted below:
The Dividend Cushion measure is a ratio that sums the existing net cash (total cash less total long-term debt) a company has on hand (on its balance sheet) plus its expected future free cash flows (cash from operations less all capital expenditures) over the next five years and divides that sum by future expected cash dividends (including expected growth in them, where applicable) over the same period. If the ratio is significantly above 1, the company generally has sufficient financial capacity to pay out its expected future dividends, by our estimates. The higher the ratio, the better, all else equal.
Note that in my following analysis, I made one revision to Nelson’s method above. Instead of subtracting the total long-term debt, I subtracted the total interest expenses over a 5-year period. Mature businesses like VT and T probably never need to repay all of their debts at once. But they do need to cover the interest expenses on an ongoing basis.
Against this backdrop, the chart below displays the dividend cushion ratios (“DCR”) for VZ and T. I calculated their DCR on an annual basis since 2016 to provide a baseline. And starting in 2022, I calculated them on a quarterly TTM basis to keep track of the recent changes. As seen, in the case of T, it has been maintaining an average DCR of ~1.60x in the past. And in the case of VZ, its average DCR has been ~1.95x in the past. And the average DCR for both of them has been systematically above the threshold of 1 in the past. With the above historical baseline, you can see how bad things were in the 1H of 2022 and why I was concerned. T’s DCR plummeted from a super safe level of 1.97x to 1.39x from Q1 2022 to Q2 2022. Not only below its historical average by a good margin, but also getting nervously close to the 1.0x threshold level. VZ’s DCR took a wrong turn too, sharply declining from 2.0x in Q1 to 1.84x in Q2.
Now, the last data points show the DCR for both of them with the Q3 results. You may not be able to see the difference between the Q3 DCR versus the Q2 DCR on this chart. However, there is a slight improvement. In T’s case, its DCR has improved from 1.38x in Q2 to 1.40x this quarter on a TTM basis. And in VZ’s case, its DCR has improved from 1.84x in Q2 to 1.87x in Q3 again on a TTM basis.
It is a slight improvement admittedly. However, I’m very much relieved to see these improvements, for two reasons. Firstly, their DCRs are now moving in the right direction. And secondly, their current DCRs are still above the threshold of 1.0x by a good margin.
Source: Author based on Seeking Alpha data.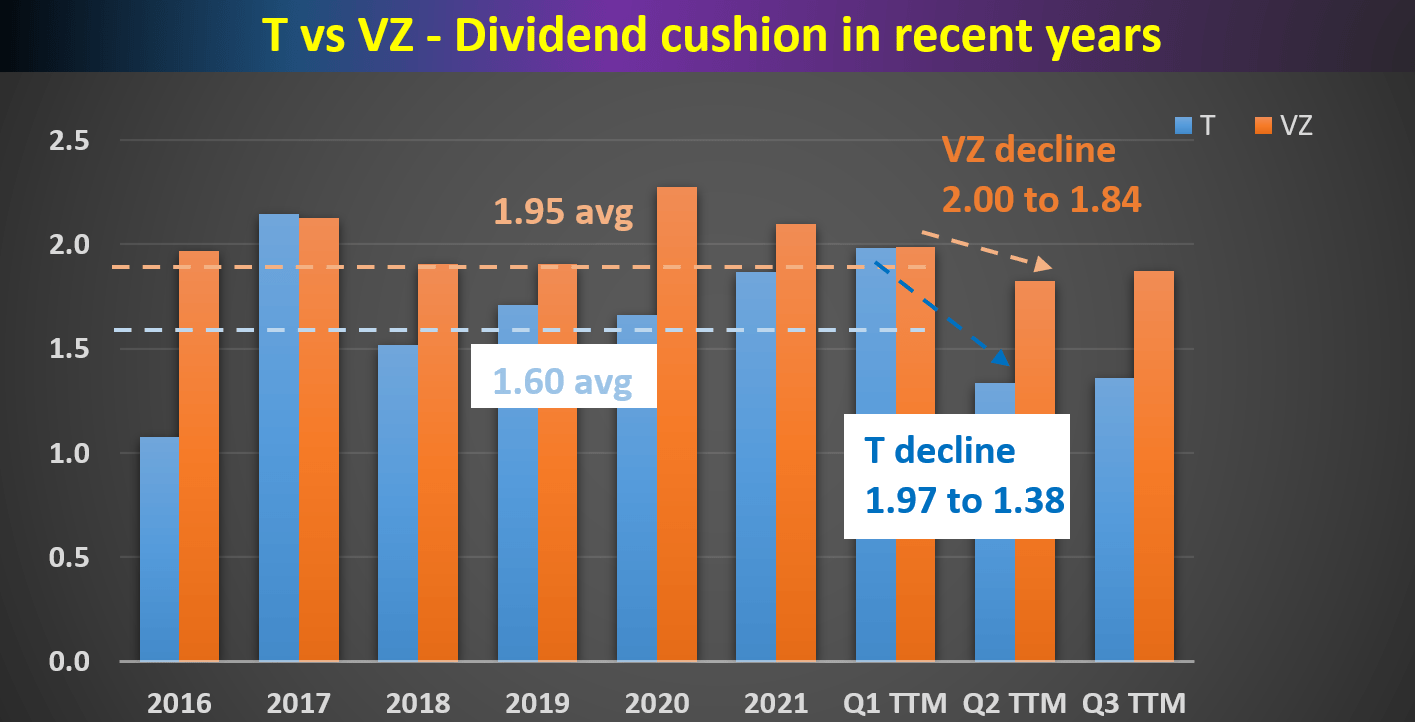
Other risks and final thoughts
Despite the more upbeat Q3 results, both T and VZ still face uncertainties. Besides the macroscopic risks such as inflation and a recession, I want to elaborate more on the issue of the CAPEX costs. Their guidance released in the Q3 ER shows that CAPEX expenditures are comfortably covered by their operating cash flow. However, investors have to bear in mind that given the duration of their capital projects, it is not uncommon for these projects to run over budget and therefore the actual CAPEX expenditure to exceed estimates. This issue is best captured in the Q&A session of the Q2 earnings report from T (again slightly edited with emphases added by me).
Questions from Tim Horan (from Oppenheimer): On the CapEx, we’re hearing CapEx equipment costs, labor costs are up 10%, 15%. I know you gave your guidance out quite a while ago for next year. I guess how are you offsetting those price increases that we’re hearing about out there in keeping your CapEx flat?
Answers from John Stankey (CEO of T): On the cost side, we’re certainly seeing some pressures as we move through. We’ve articulated that. We’re able to navigate it better than a lot, as we’ve shared with you previously. We have a lot of long-term contracts in place. I think those help us a lot. I won’t tell you they entirely insulate us.
To conclude, after their Q2 results, I was very concerned about the dividend safety of both T and VZ. And the market seemed to be concerned too given the brutal corrections their stock prices have suffered after the Q2 ER. However, I have no concerns about a dividend cut in the foreseeable future anymore after the Q3 ER. Both FCF payout ratios and more importantly, dividend cushion ratios, have staged an improvement at both places. Especially for T, its FCF should be able to cover its dividend obligations for the full year 2022 (with an FCF payout ratio of around 100% though), a dramatic improvement from the previous quarter when the FCF payout ratios were in the alarming range of 139% to 150%.
Looking forward, I see dividend safety continue improving in both places after the Q3 results. VZ announced a cost savings plan, which aims at slashing expenses by $2B to $3B per year by 2025 and would further improve its dividend cushion ratio. T also has an ongoing cost-savings campaign, which is on track to achieve more than $4B of $6B target by the end of 2022. And such a cost reduction would also further improve its dividend cushion ratio for the quarters to come.
Be the first to comment