

franckreporter
AT&T Inc. (NYSE:T) has agreed to pay $23 million in fines for its part in a bribery scheme in Illinois. A company executive there is accused of funneling more than $22,000 in bribes to the Illinois assembly’s Speaker of the House in return for a favorable bill that would eliminate a requirement that the telecommunications company provide landline service to every home in the state. Landlines can be costly to maintain, and homeowners are increasingly less likely to initiate and pay for the service.
Meanwhile, AT&T is trying to leverage new revenue opportunities created by the American Rescue Plan Act. The recently-passed stimulus package provides money to local governments to build broadband Internet access in rural communities. AT&T was given $9.9 million dollars in grants for a new project outside Evansville, Indiana and says it is actively seeking more opportunities.
Last month, AT&T announced it won a contract valued at up to $119 million to overhaul high-speed wired and wireless connectivity for the U.S. Customs and Border Protection. The 11-year contract includes the modernization of voice and data networks that help the law enforcement agency connect its 60,000 employees across the country.
When considering these current stories about AT&T, we need to determine which news topics will have a long-term and ongoing effect on the company and its share price. While the fines involved in the Illinois’ bribery scheme will not have a long-term impact on the company’s bottom line, extending its service footprint into new communities and generating new and lucrative government contracts should have a lasting impact on revenue.
While current news stories, good or bad, can sway our opinion about investing in a company, it’s good to analyze the fundamentals of the company and to see where it’s been in the past and in which direction it’s heading.
This article will focus on the long-term fundamentals of the company, which tend to give us a better picture of the company as a viable investment. I also analyze the value of the company versus the price and help you to determine if T is currently trading at a bargain price. I provide various situations which help estimate the company’s future returns. In closing, I will tell you my personal opinion about whether I’m interested in taking a position in this company and why.
Snapshot of the Company
A fast way for me to get an overall understanding of the condition of the business is to use the BTMA Stock Analyzer’s company rating score. T has high scores for 10 Year Price Per Share, Ability to Recover from a Market Crash or Downturn, and Gross Margin Percent. It has low scores for ROE, Earnings per share, ROIC, and PEG Ratio. A low PEG Ratio score indicates that the company may not be experiencing high growth consistently over the past 5 years. In summary, these findings show us that T seems to have mixed fundamentals, since the categories producing good and poor scores are split.
Before jumping to conclusions, we’ll have to look closer into individual categories to see what’s going on.
BTMA Stock Analyzer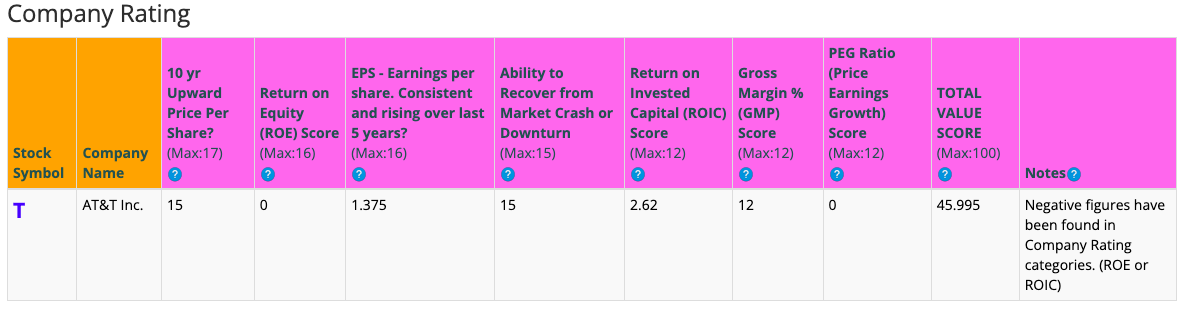
Fundamentals
Let’s examine the price per share history first. In the chart below, we can see that price per share showed strong growth from 2013 to 2016. After 2016, earnings have generally been flat with a small decline in 2018. Overall, share price average has grown by about 38.8% over the past 10 years, or a Compound Annual Growth Rate of 3.71%. To be frank, this is a terrible return for this time frame.
BTMA Stock Analyzer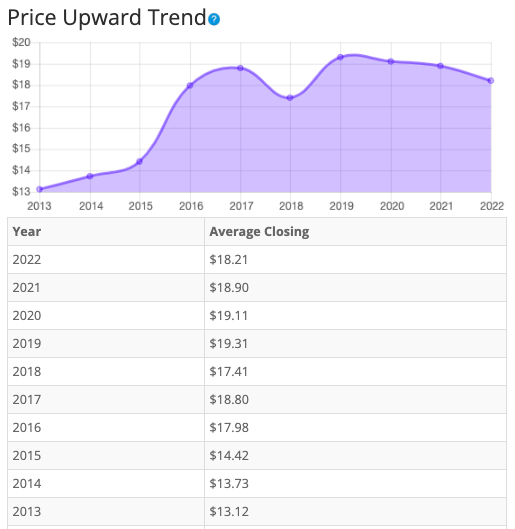
Earnings
Looking closer at earnings history, we see that earnings have been extremely inconsistent over the past 10 years. From 2012 to 2018 every year of increases in earnings was followed with a decline. Earnings further eroded in 2019 and 2020 before rebounding in 2021. It’s worth noting AT&T posted a loss in 2020.
Consistent earnings make it easier to accurately estimate the future growth and value of the company. So, in this regard, T is not a good example of a stock to accurately estimate future growth or current value.
BTMA Stock Analyzer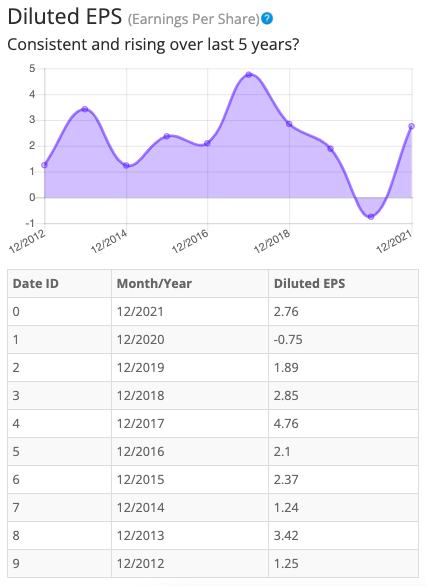
Since earnings and price per share don’t always give the whole picture, it’s good to look at other factors like the gross margins, return on equity, and return on invested capital.
Return on Equity
The return on equity has decreased fairly consistently between 2017 and 2021. ROE decreased every year during the period with the exception of 2021. Five-year average ROE is below expectations at around 10.16%. For return on equity (ROE), I look for a 5-year average of 16% or more. So, T fails to meet my requirements.
BTMA Stock Analyzer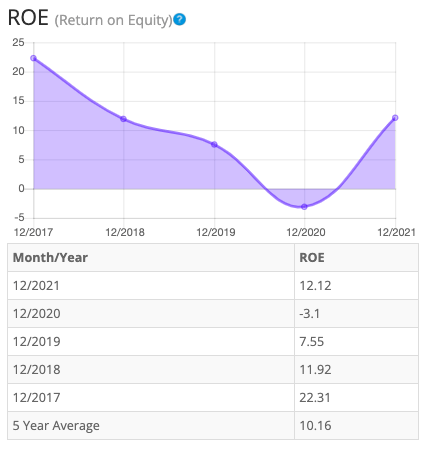
Let’s compare the ROE of this company to its industry. The average ROE of 42 Telecom Services companies is 10.41%.
Therefore, AT&T’s 5-year average of 10.16% and current ROE of 12.12 is near average for its industry. However, my view is that I prefer not to invest in companies or industries that provide undesirable fundamentals or performance.
Return on Invested Capital
The return on invested capital has also consistently decreased from 2017 to 2021. After falling each year between 2017 and 2020, ROIC increased in 2021. Five-year average ROIC is below expectations at around 6.55%. For return on invested capital (ROIC), I also look for a 5-year average of 16% or more. So, T fails this test as well.
BTMA Stock Analyzer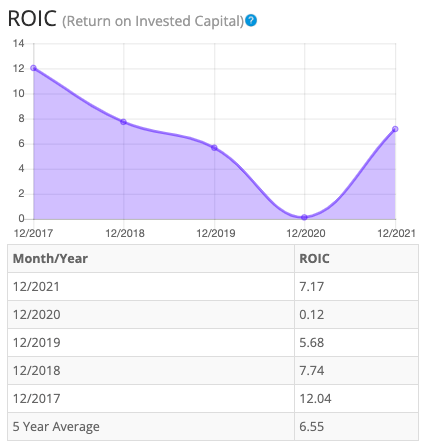
Gross Margin Percent
The gross margin percent (GMP) has fluctuated in a fairly small range over the last five years. GMP rose in 2018, was flat in 2019 and 2020, and then decreased in 2021. Even with the declines, overall gross margin percent is at very high levels. Five-year GMP is above expectations at around 53.02%. I typically look for companies with gross margin percent consistently above 30%. So, T has proven that it has the ability to maintain acceptable margins over a long period.
BTMA Stock Analyzer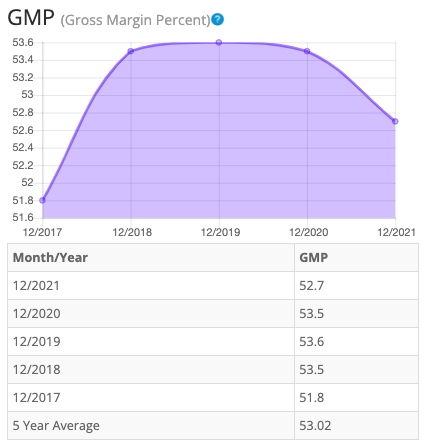
Looking at other fundamentals involving the balance sheet, we can see that the debt-to-equity is greater than 1. This is a negative indicator, telling us that the company owes more than it owns.
T’s Current Ratio of 0.93 is a cause for concern, indicating that it may not have an adequate ability to use its assets to pay its short-term debt.
Ideally, we’d want to see a Current Ratio of more than 1, so T does not meet this amount.
According to the balance sheet, the company appears to be in somewhat poor shape. There are indications that in the long term, the company does not have enough assets to cover its debts. In the short-term, the company could struggle to fulfill its obligations.
AT&T recently spun off Time Warner, the media and entertainment conglomerate that owns properties like HBO, CNN, TBS and Warner Brothers film and television studios. AT&T acquired Time Warner in 2016. The deal saddled AT&T with high amounts of debt that it is struggling to reduce. The Time Warner spin off and sale of its stake in DirecTV will help pay down some of the debt, but new debt is expected as AT&T refocuses its attention on its wireless business and plays catch-up with expensive investments in 5G technology. There’s little left for AT&T to leverage or sell and the highly competitive wireless business leads to some skepticism that AT&T can grow market share, increase cash flow and significantly pay down debt.
The Price-Earnings Ratio of 8.5 indicates that T might be selling at a low price when comparing T’s P/E Ratio to a long-term market average P/E Ratio of 15. The 10-year and 5-year average P/E Ratio of T has typically been between 8.3 and 7.3, so this indicates that T could be currently trading at a fair price when comparing to T’s average historical P/E Ratio range.
T currently pays a dividend of 7.59% (or 9.24% over the last 12 months).
BTMA Stock Analyzer
This analysis wouldn’t be complete without considering the value of the company vs. share price.
Value Vs. Price
For valuation purposes, I will be using a conservative diluted EPS of 5.63. I’ve used various past averages of growth rates and P/E Ratios to calculate different scenarios of valuation ranges from low to average values. The valuations compare growth rates of EPS, Book Value, and Total Equity.
In the table below, you can see the different scenarios, and in the chart, you will see vertical valuation lines that correspond to the table valuation ranges. The dots on the lines represent the current stock price. If the dot is towards the bottom of the valuation range, this would indicate that the stock is undervalued. If the dot is near the top of the valuation line, this would show an overvalued stock.
BTMA Wealth Builders Club BTMA Wealth Builders Club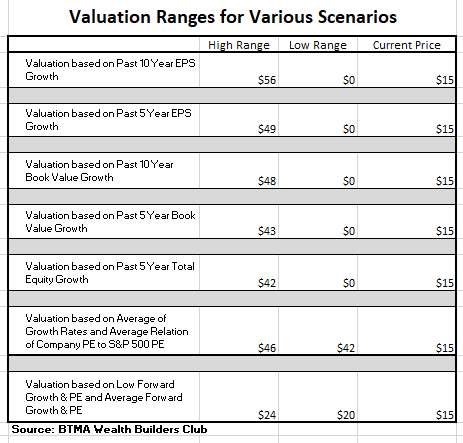
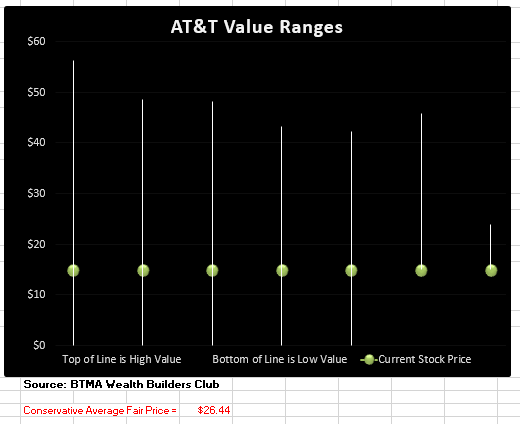
According to this valuation analysis, AT&T is undervalued.
- If T continues with a growth average similar to its past 10 years earnings growth, then the stock is undervalued at this time.
- If T continues with a growth average similar to its past 5 years earnings growth, then the stock is undervalued at this time.
- If T continues with a growth average similar to its past 10 years book value growth, then the stock is undervalued at this time.
- If T continues with a growth average similar to its past 5 years book value growth, then the stock is undervalued at this time.
- If T continues with a growth average similar to its past 5 years total equity growth, then the stock is undervalued at this time.
- According to T’s typical P/E ratio relation to the S&P 500’s P/E Ratio, T is undervalued.
- If T continues with a growth average as forecasted by analysts, then the stock is undervalued.
This analysis shows an average valuation of around $26 per share versus its current price of about $15, this would indicate that AT&T is undervalued.
Forward-Looking Conclusion
According to the facts, AT&T lacks financial health in a long-term sense of having enough equity as compared with debt. It also needs improvement in the short-term because the current ratio indicates that it doesn’t have enough cash to cover current liabilities.
Fundamentally, the company is weak. Earnings are inconsistent. Meanwhile, ROE and ROIC are at unacceptable levels and have been on a downward trend. Only Gross Margins have been acceptable over the past five years.
Lastly, my valuation analysis shows that the stock is significantly undervalued.
Another drawback is that this stock typically underperforms against the standard US benchmark of the S&P 500. Below, we can see how AT&T performed against the S&P 500 (VFIAX) from 2010 – 2022.
Morningstar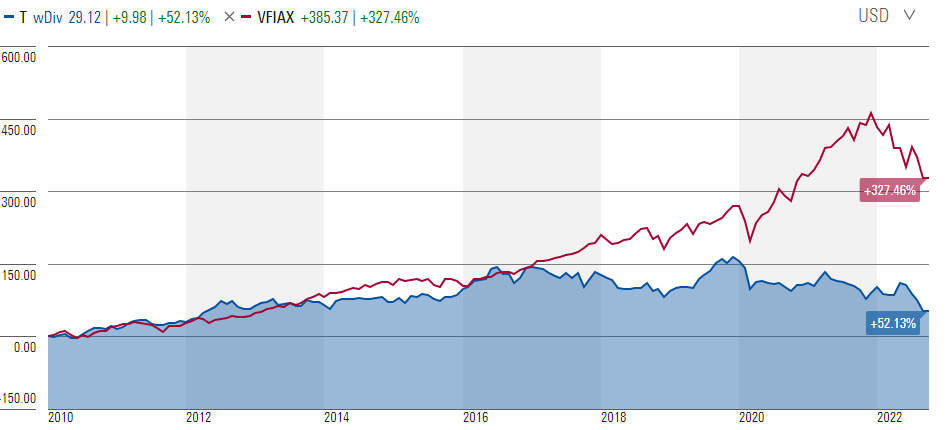
Predicted Growth
“Over the next five years, the analysts that follow this company are expecting its earnings to decrease at an average annual rate of -4.76%. This year, analysts are forecasting earnings decrease of -24% below last year. Analysts expect earnings to decrease next year by -28% under this year’s forecasted earnings” (Source: Forecast Earnings Growth).
In a nutshell, AT&T is significantly undervalued if focusing on past performance. However, if you consider its weak and inconsistent fundamentals along with its poor balance sheet, AT&T deserves its current low price.
After all, the future growth expectations are dim. Most analysts are expecting the company to produce negative growth. In addition, the overall stock market is facing a recession, which would pull AT&T’s share price down further.
AT&T has so much adversity to overcome, that it has slim chances to be a good potential investment anytime soon.
I see way too much risk in AT&T. I’m moving onto safer and stronger companies with more return potential.
Be the first to comment