

porcorex/iStock via Getty Images
The investment thesis
We use the following market sector dashboard to put our finger on the pulse of the market (BTW, feel free to download the Google sheet via the following link: Market Sector Dashboard). And as you can see, the Communication Services sector represented by the Communication Services Select Sector SPDR Fund (XLC) is the 2nd most attractive sector currently by dividend yield Z-Score. It is second only after small caps and even ahead of the energy sector. As a matter of fact, as you can see from the second chart, XLC’s current dividend yield of 1.14% is not only far above its historical average of 0.81% by a whopping 40%+ relatively, but also at a peak level since its inception.
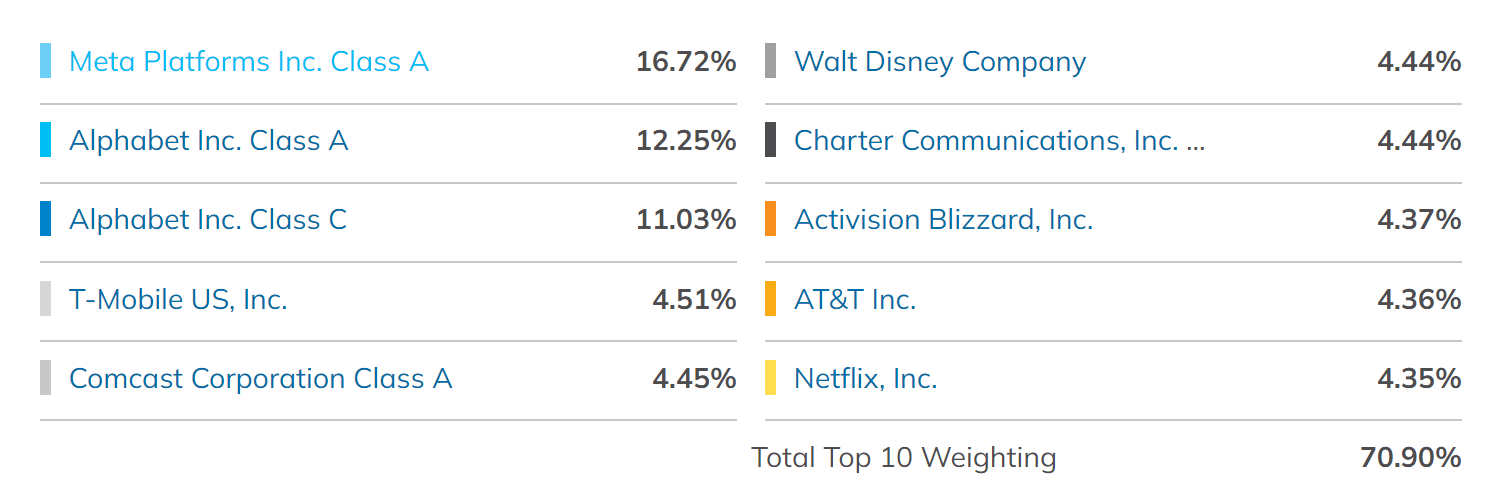
Sometimes, a sector is made attractive (or unattractive) by a few leading stocks that have disproportionate weights. However, it is not the case here with XLC. We have written about several of the leading stocks in XLC in our past articles, such as Meta Platforms (META), Google (GOOGL) (GOOG), and Verizon (VZ). And after closer examination, our these is that they are all attractive.
Source: Author based on Seeking Alpha data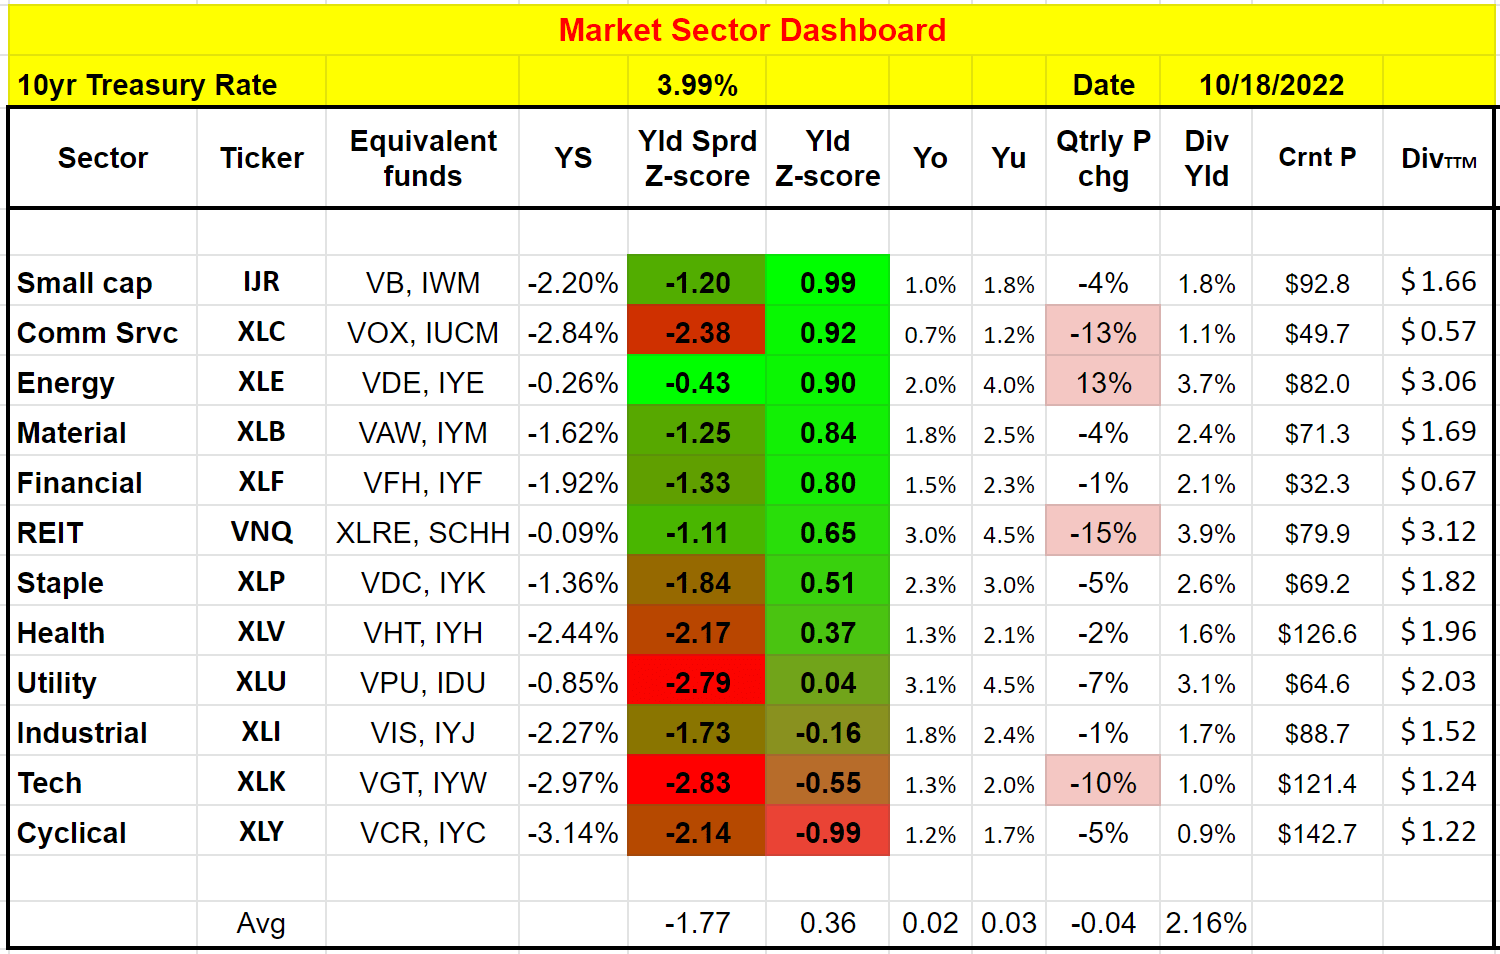
And as top-down investors, we like to examine more individual stocks once we find an attractive sector. And today, we will focus on two other leading stocks in the sector: AT&T (NYSE:T) and Comcast (NASDAQ:CMCSA). As you can see from the chart below, both are also at secularly attractively valuations. Judging by their dividends, T’s current dividend yield of 8.67% is on par with its historical average of 8.66%. However, as to be detailed next, its current dividend yield underestimated its valuation discount due to the recent dividend cut due to the Warner spinoff. In the case of CMCSA, its current dividend yield of 3.45% is at a level unseen in a decade. It is above its historical average of 1.98% by almost 74%, even more than the sector average itself.
In the remainder of this article, I will argue for a bull thesis for both T and CMCSA using what I call Buffett’s 10x pretax rule. And the key argument is really simple, both are equivalent to a 10%+ equity bond with coupon growth built in according to this rule.
Source: Seeking Alpha data. Source: ETF.com (top 10 holdings in XLC)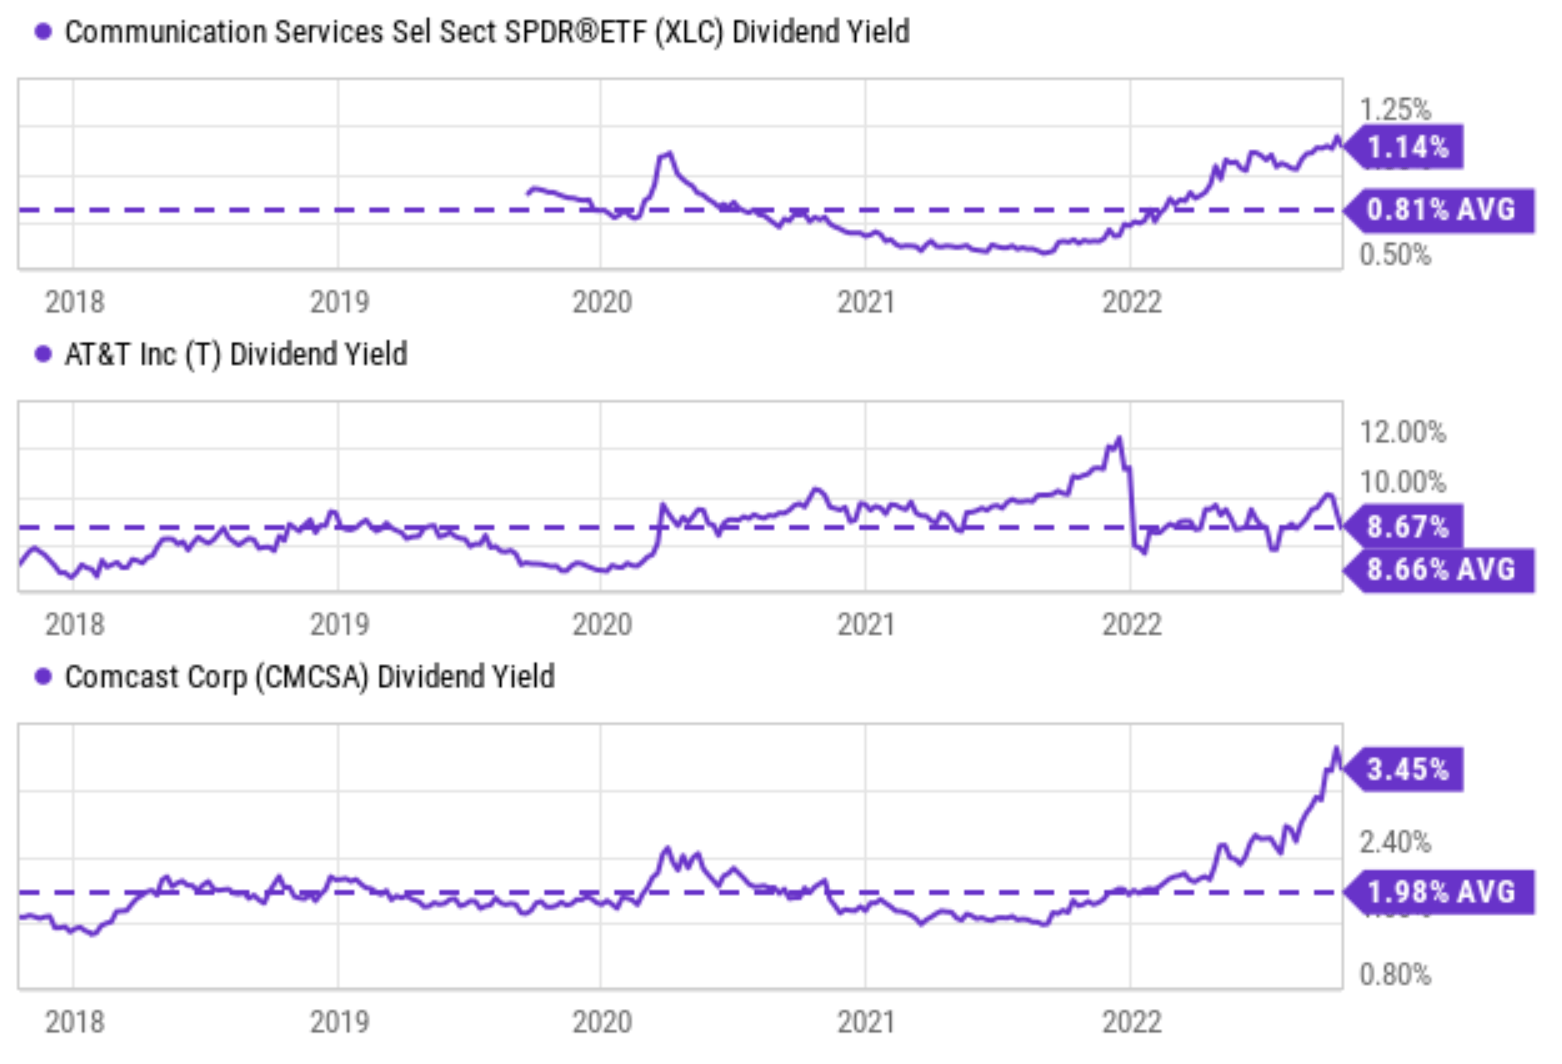
Buffett’s 10x Pretax Rule
In case you are new to Buffett’s 10xEBT rule, I have a free blog article to provide all the details plus all the Q&A I’ve received. I will use EBT (earnings before taxes) interchangeably with pretax earnings for the remainder of this article. A quick summary to facilitate the ease of reference:
- Buffett paid ~10x pretax earnings for many of his largest and best deals. The list is long, ranging from Coca-Cola, American Express, Walmart, Burlington Northern, and also the more recent AAPL purchase. It is hardly a coincidence because buying a business that stagnates forever at 10xEBT would already provide a 10% pretax earnings yield, directly comparable to a 10% yield bond. Any growth is a bonus.
- Also, after-tax earnings do not reflect business fundamentals. Taxes can change from time to time due to factors that have no relevance to business fundamentals, such as tax law changes and capital structure change.
- Finally, pretax earnings are easier to benchmark, say against bond earnings. The best equity investments are bond-like, and when we speak of bond yield, that yield is pretax. So a 10x EBT would provide a 10% pretax earnings yield, directly comparable to a 10% yield bond.
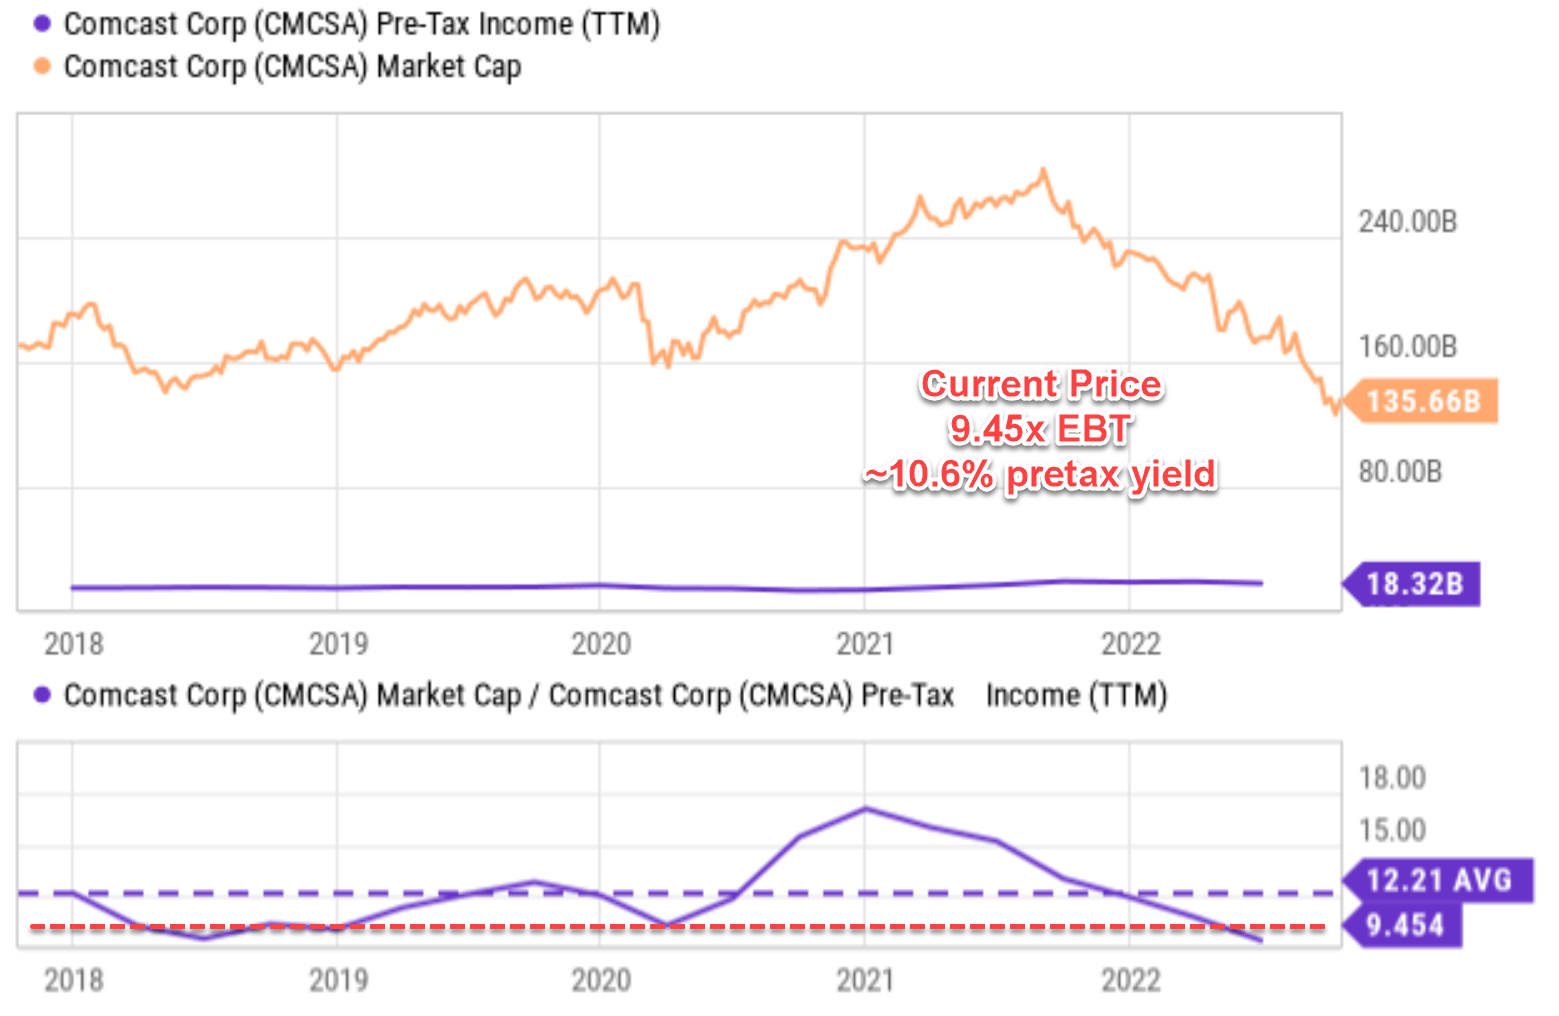
As seen from the chart below, the market now presents T as such an opportunity according to the 10x EBT rule. The current valuation of T is actually much lower than 10x EBT, only 4.74x FWD EBT at the price when I am writing this article. So T’s pretax earning yield is 21%, directly comparable to a bond yielding 21% because bond yields are quoted in pretax terms. And similarly, as you can see from the second chart below, CMCSA is in a similar situation, at its current prices, it’s valued at 9.45x EBT, translating into a 10.6% pretax earnings yield. And you can also see from both charts, historically, when their prices are substantially below the 10x EBT line, it has been good entry prices (and vice versa). Especially in the case of CMCSA, its prices only dipped below the 10x EBT line 2 or 3 times over the past decade (the red dotted line).
Source: author based on Seeking Alpha data Source: author based on Seeking Alpha data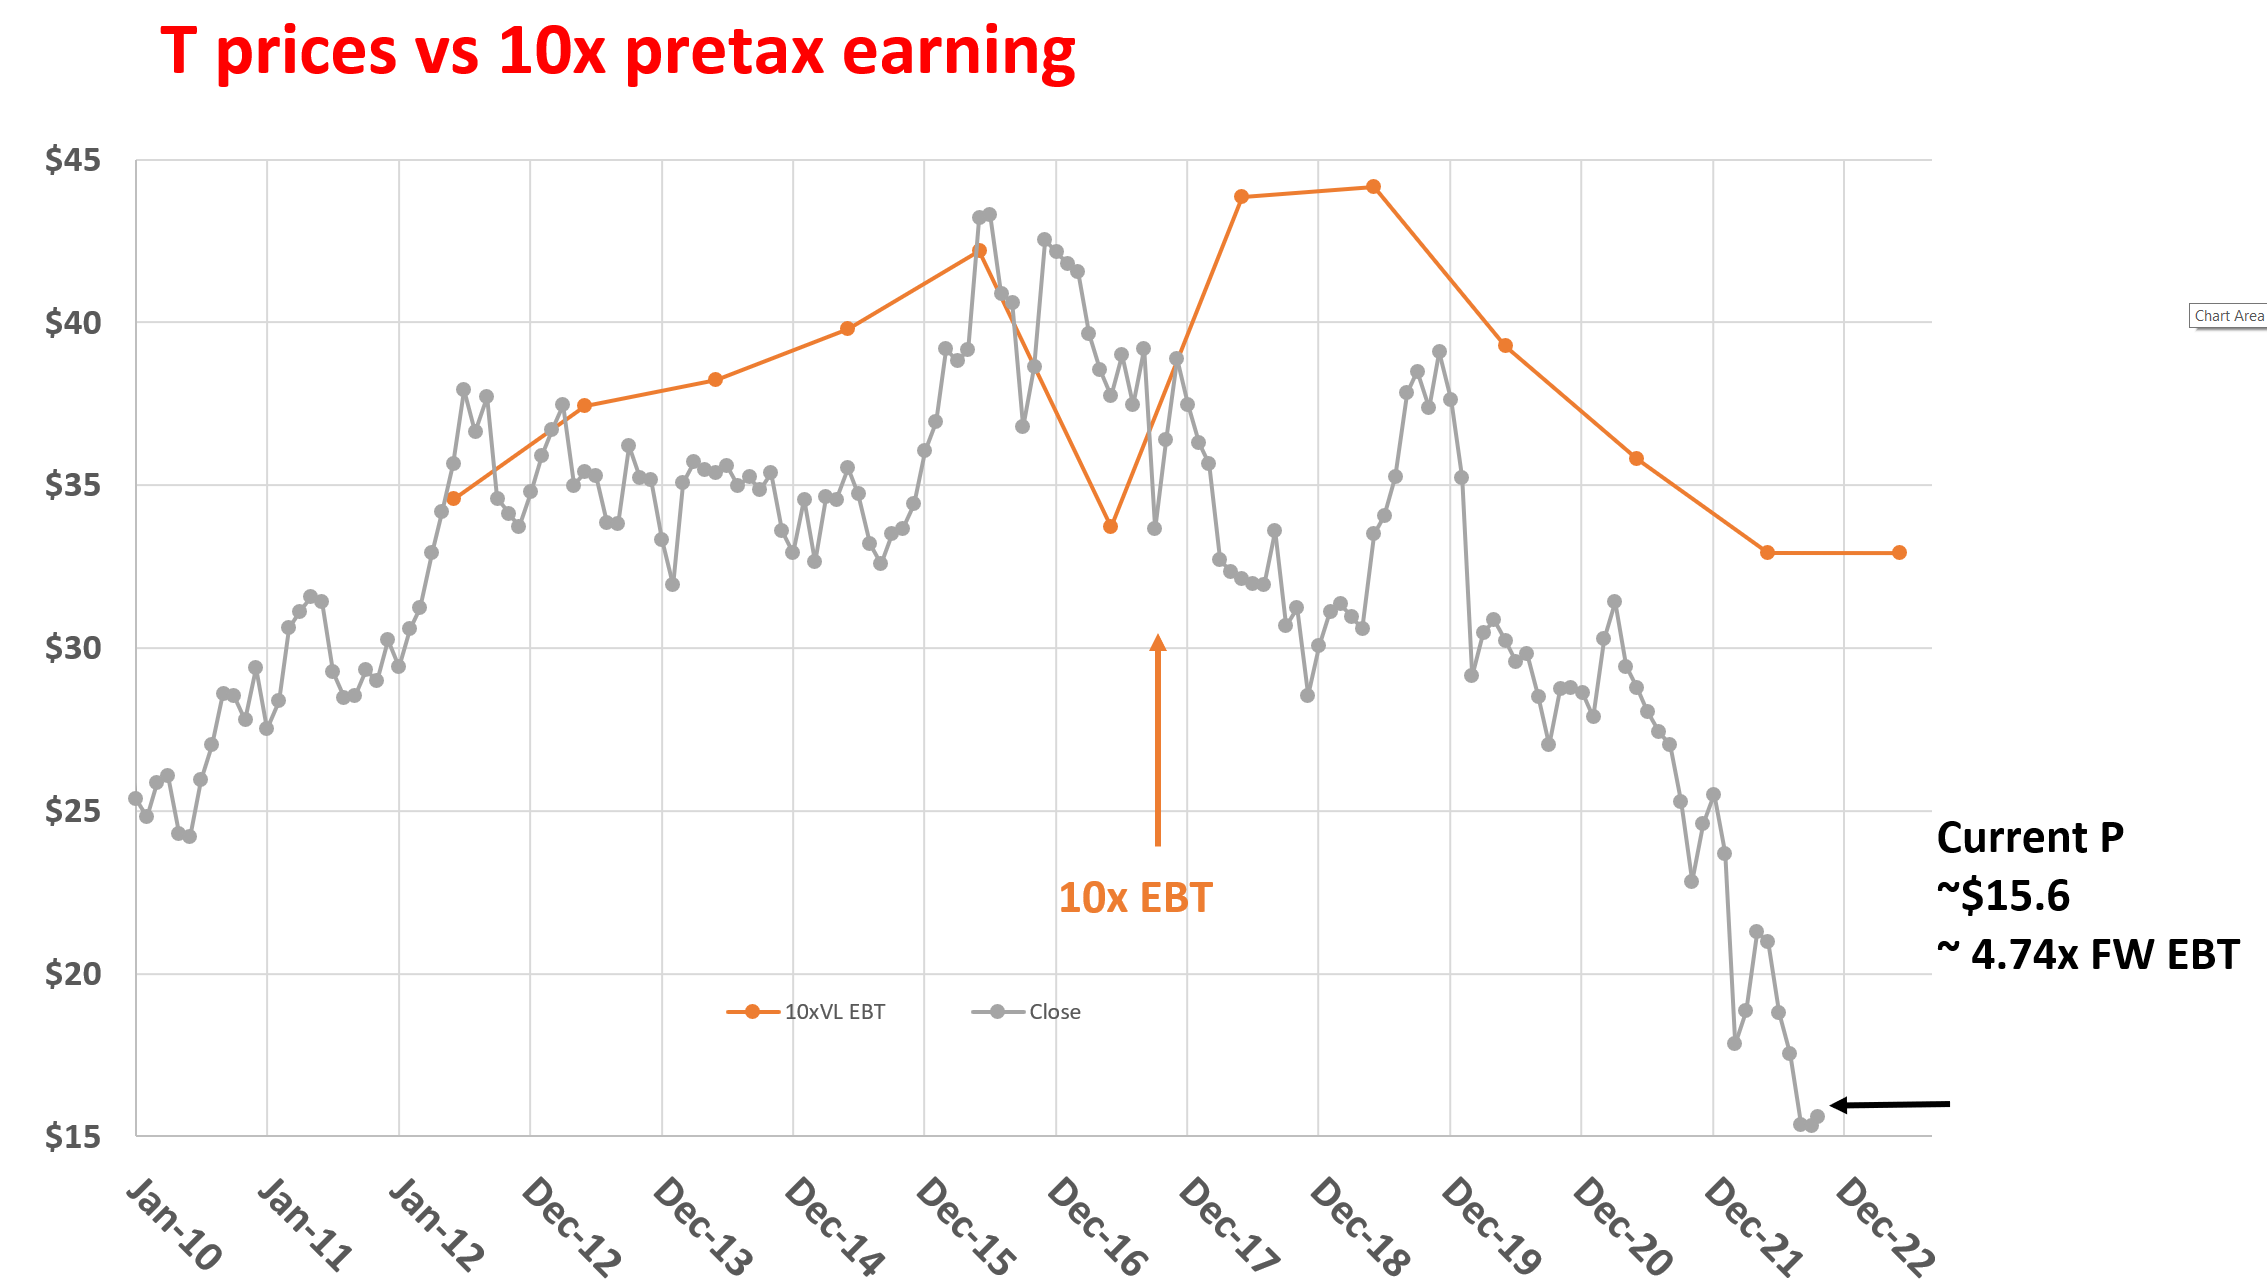
Admittedly, both companies (especially T) have relatively high leverage, and therefore it makes better sense to use a leverage-adjusted valuation metric instead of the simple PE. So the next chart shows EV/EBIT multiples. As seen, T is trading at about 7.7x EV/EBIT multiples, indeed higher than its PE substantially because of the leverage. And CMCSA is trading at about 10.0x EV/EBIT multiples, also a bit higher than its PE again due to the leverage. But both are still trading below 10x, and hence again providing a pretax yield of more than 10%.
Source: Seeking Alpha data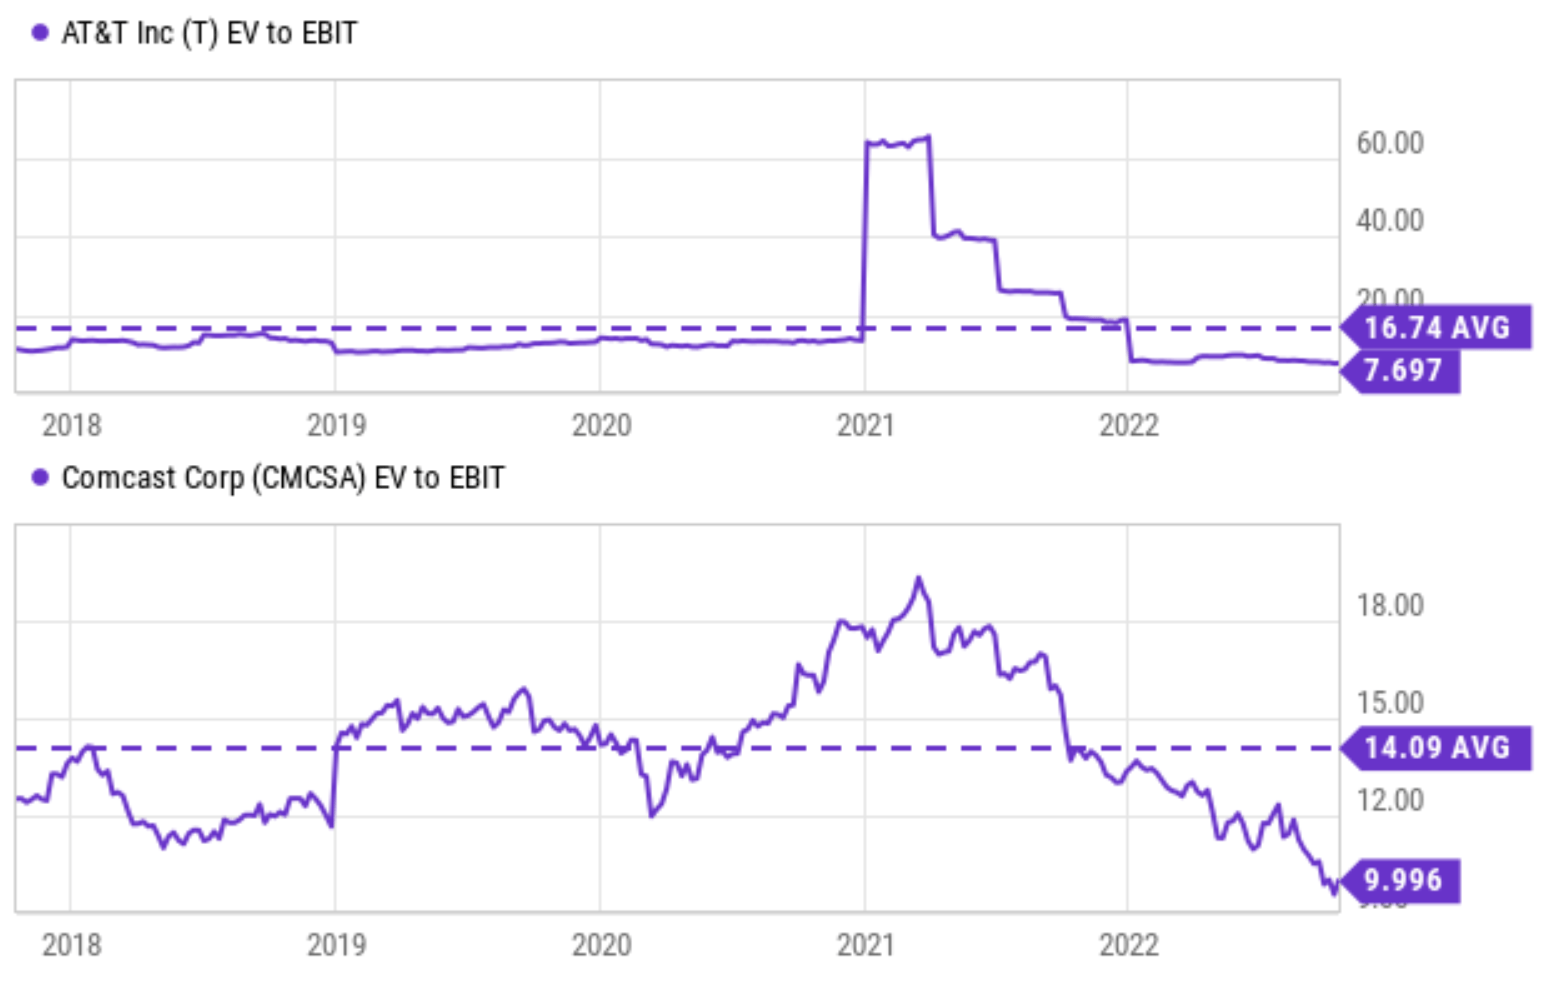
Warning and clarification
A strong warning is in order before we move on. As also detailed in our blog article,
The 10xEBT rule does NOT mean you should go out and buy every/any stock that is priced below 10xEBT. Investors face two primary risks: A) quality risk or value trap, and B) valuation risk, i.e., paying too much. The 10x pretax rule is mainly to avoid the type B risk AFTER the type A risk has been eliminated already.
Then how do we eliminate type A risks? I look for three things primarily. First and second, the business should have no existential issues in short term and the long term. And third, the business should have a decent chance to grow (at the so-call perpetual growth rate). This will be a plus.
I see both T and CMCSA near the optimal trade-off zone now. And between T and CMCSA, I see that T is more toward the lower-valuation and high-risk end, and CMCSA is more toward the other end – but only in relative terms. The major reasons for such an assessment are CMCSA’s more diverse revenue sources and also its lower leverage. Just like T, CMCSA derives the bulk of its income from cable communications services and high-speed Internet (more than 54% of adjusted ’21 revenues). But it also has significant exposure to a multitude of other income streams ranging from pay-TV, NBCUniversal, streaming networks, and TV/film studios (Universal Pictures, DreamWorks).
Source: author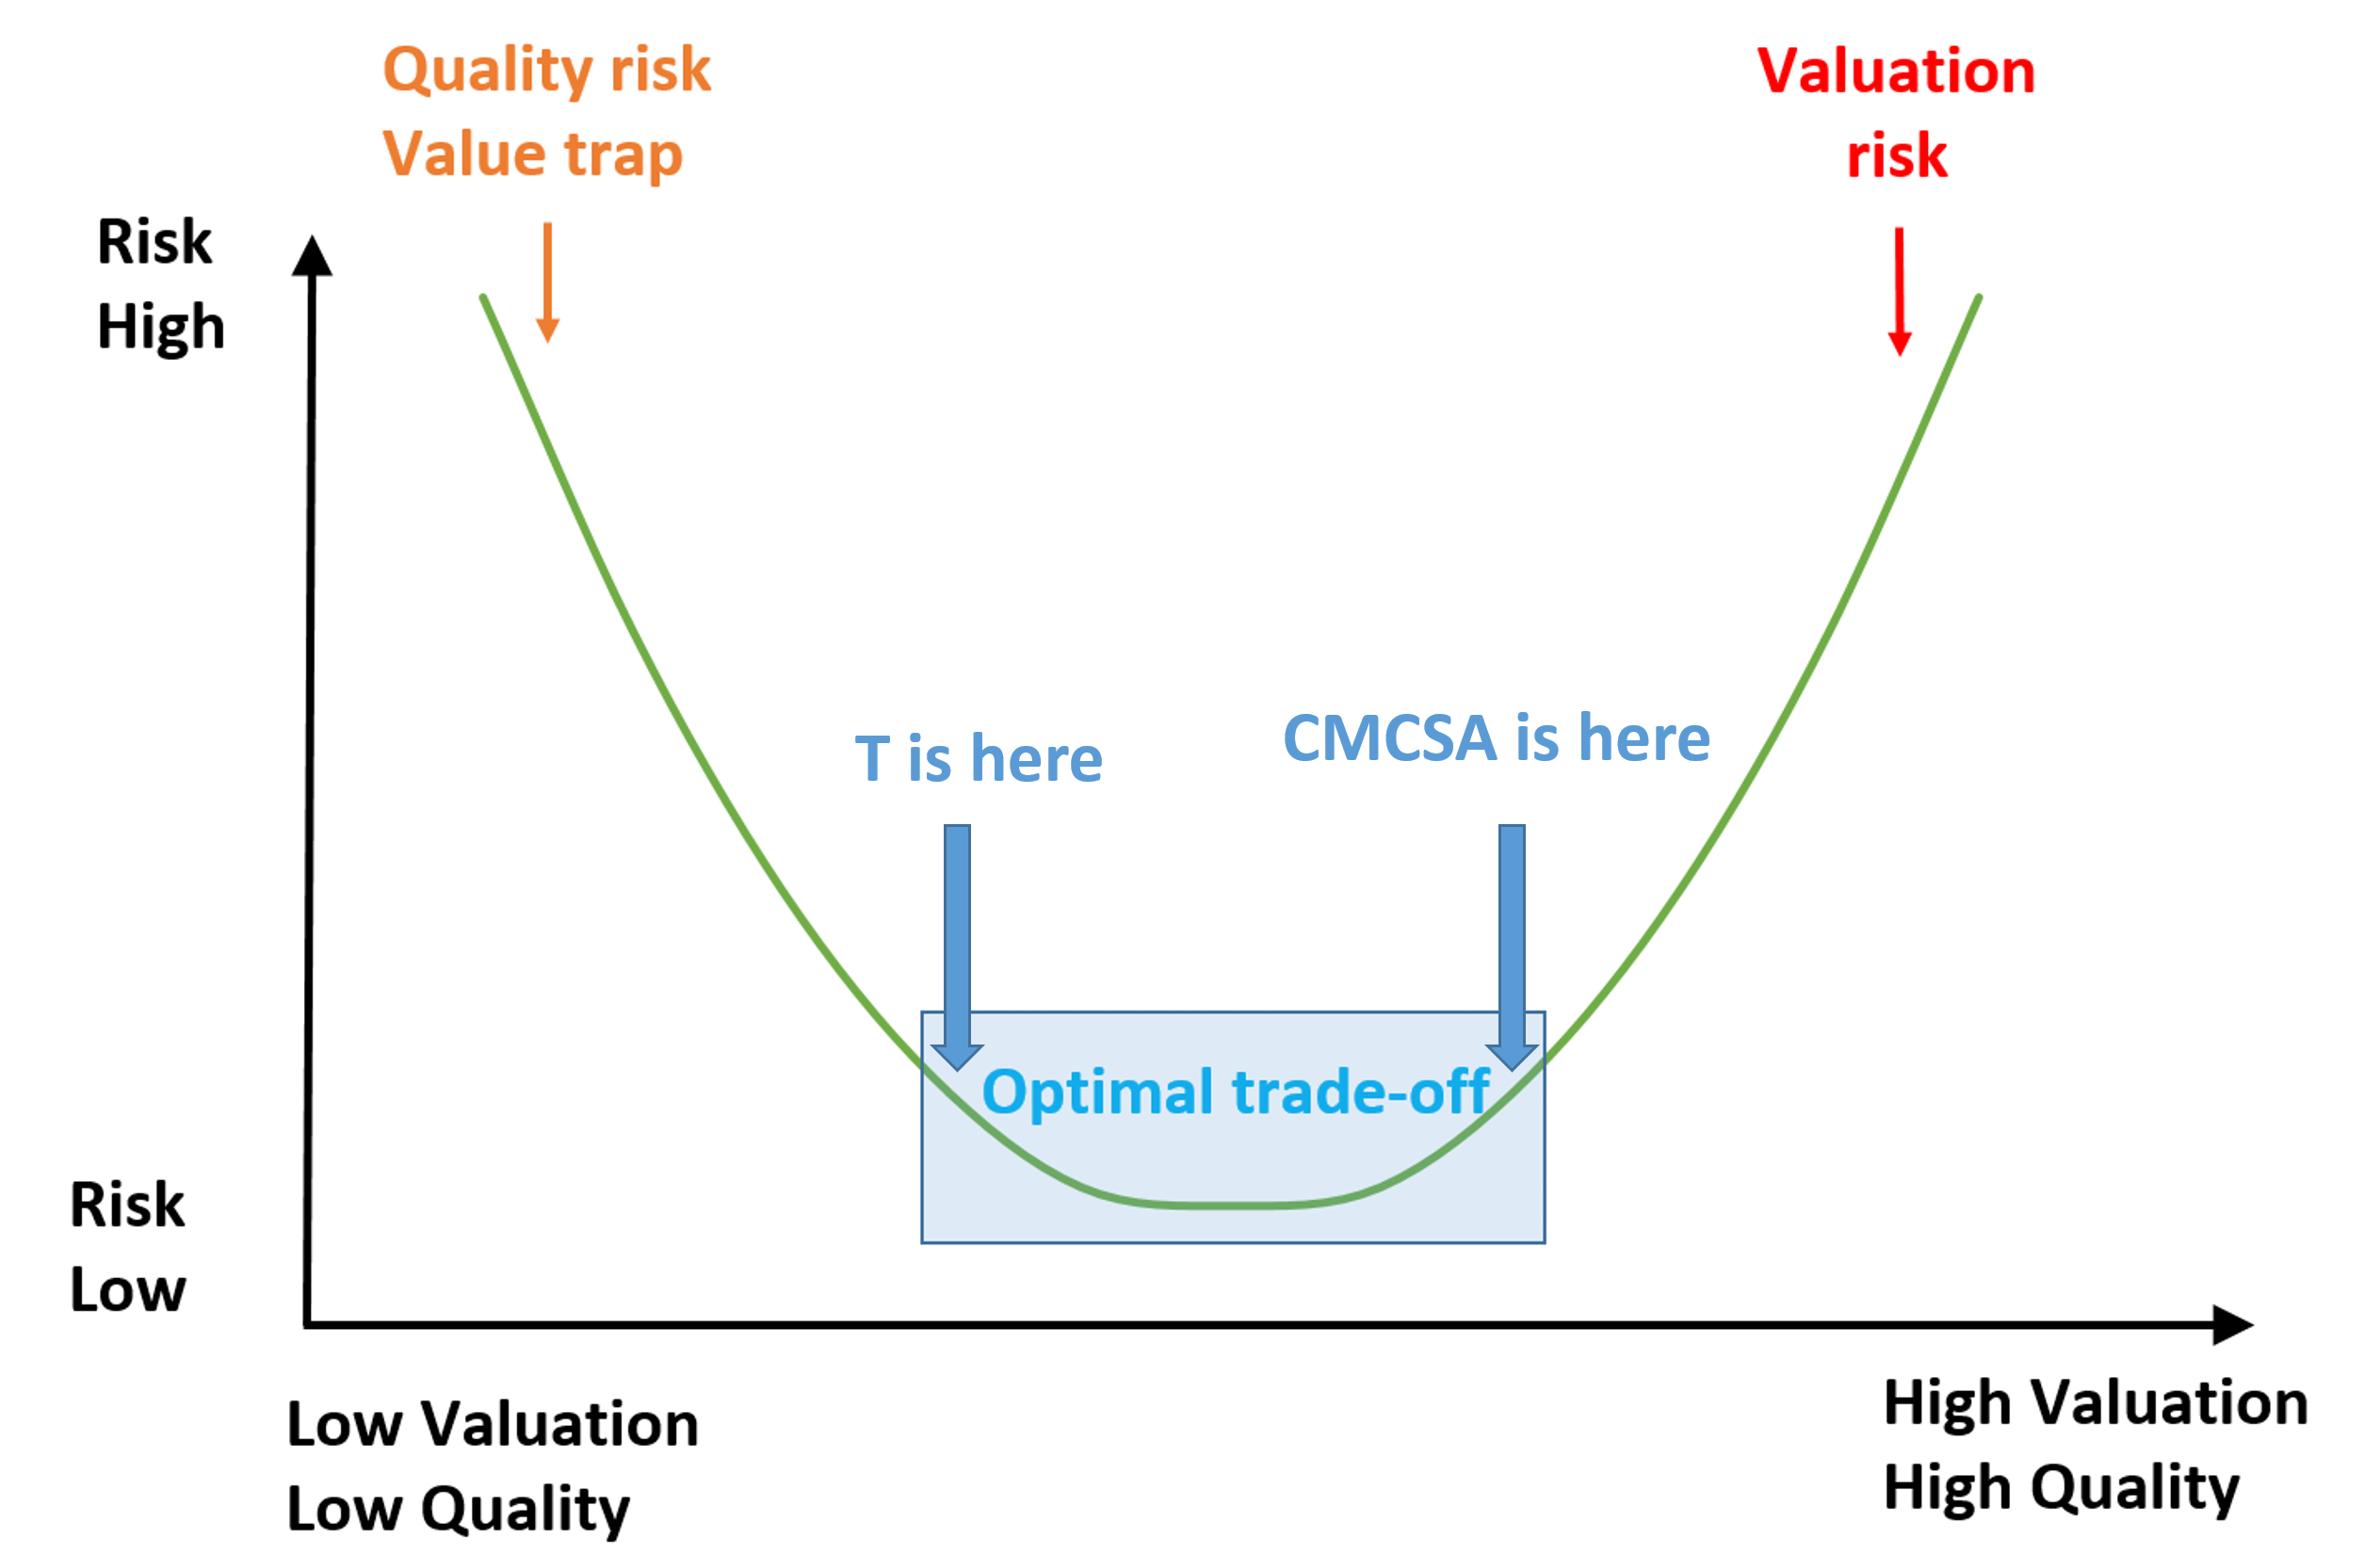
Do they have existential issues?
Now let’s examine if they have existential issues. I really do not see any existential issue for either T or CMCSA either in the short run or the long run. As argued in my earlier article:
With their market-leading position, scale, and management, I do not see any survivability issues for either of them at all. And a shortcut to looking into this issue is the dividend. The dividend is one of the most reliable and indicative metrics of a business.
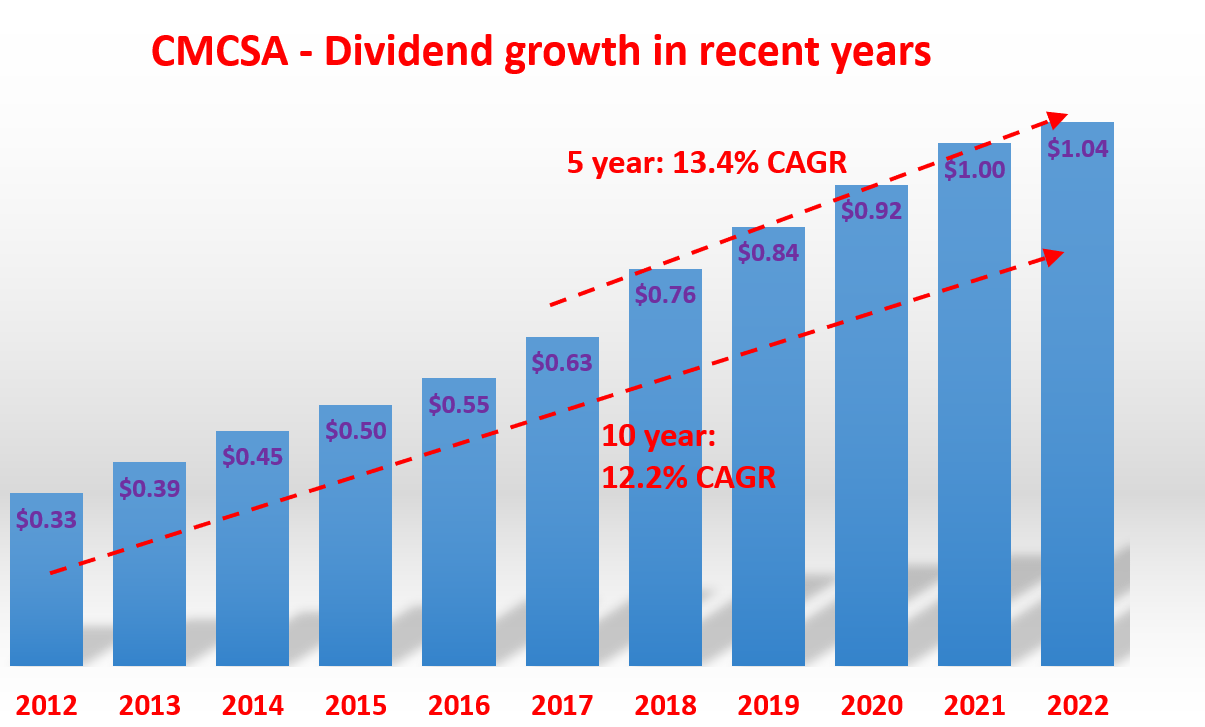
To wit, as shown below, T has been growing dividends consistently and consecutive for more than 25 years and is a dividend champion (if the dividend cut due to the Warner spinoff is excluded). It has been growing its dividend in the past 10 years at ~1.6% CAGR and ~1.4% in the past 5 years. CMCSA has been growing dividends consecutively for more than 15 years by now, a respectable track record. And it has been growing its dividends more rapidly as seen. Its growth rate during the past 10 years has been a remarkable double-digit 12.2% CAGR and an even higher 13.4% in the past 5 years.
Source: author based on Seeking Alpha data Source: author based on Seeking Alpha data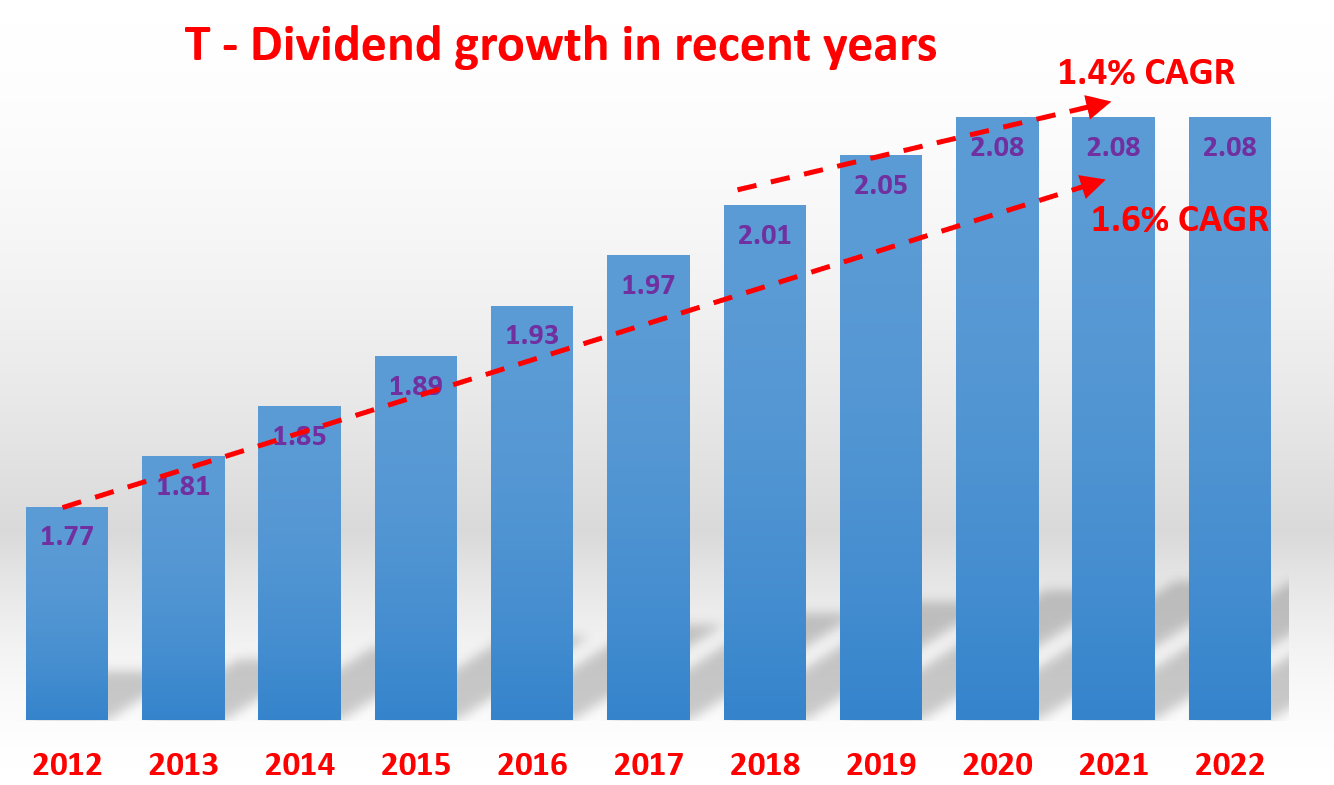
What are their perpetual growth prospects?
With no existential issues, a quality business like T or CMCSA purchased at 10x EBT already provides a 10% long-term pre-tax return according to the 10x EBT rule EVEN IF it stagnates forever. But for both T and CMCSA, there are good growth prospects too the way I see things. In the long term (like 10 years or more), the growth rate is governed by:
Longer-Term Growth Rate = ROCE * Reinvestment Rate
ROCE stands for the return on capital employed. And the ROCE of T and CMCSA are shown below. As seen, the ROCE for T has been stable and averaged around 30.3% in the past. The ROCE for CMCSA is equally consistent and even higher, on average about 50.9% (which explains faster dividend growth rates as shown above).
Source: author based on Seeking Alpha data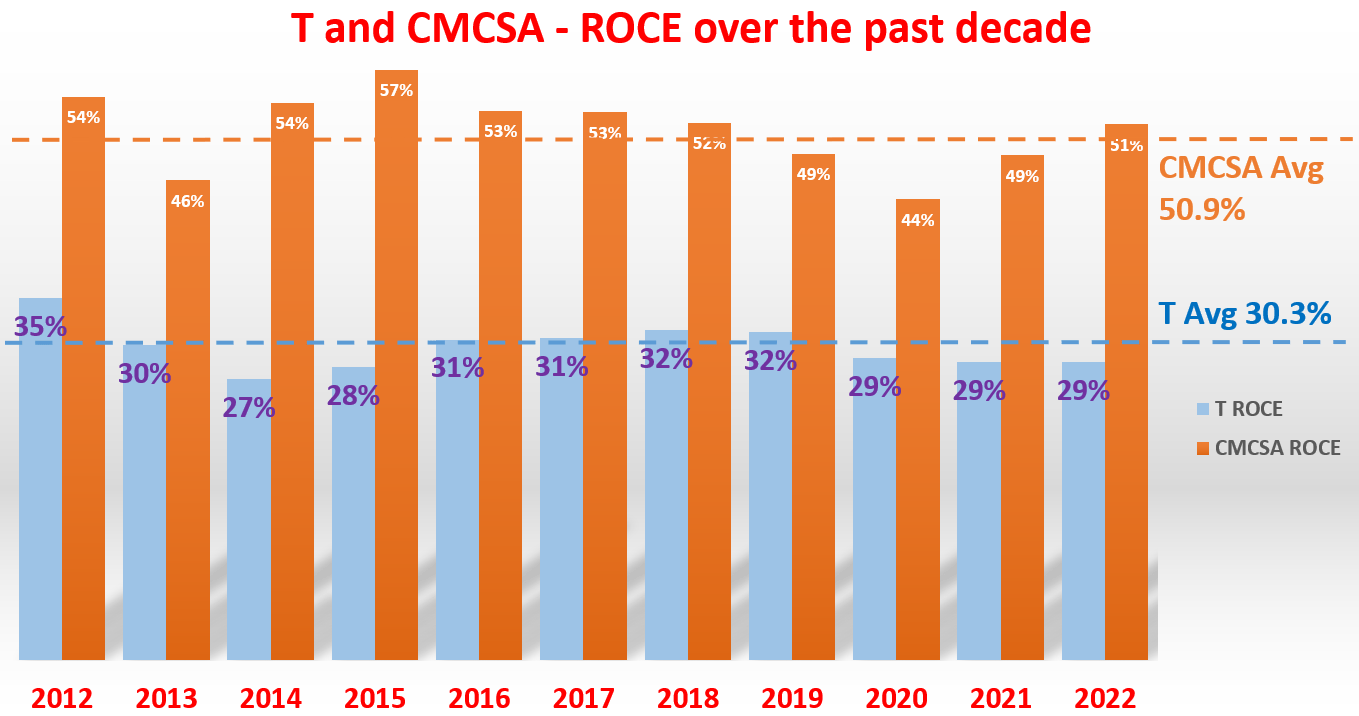
And for the reinvestment rate, my estimate is that both T and CMCSA have been maintaining a reinvestment rate of around 7.5% in recent years. Now with both ROCE and reinvestment rate estimated, we can estimate the long-term growth rate, as shown in the next chart. The mechanics of the chart was detailed in my earlier article. Just to point out a few highlights:
The numbers highlighted in red are the most likely scenario given my projected ROCE and reinvestment rates. Note that, I also added 2% of inflation to the growth rate. So as a result, even when they reinvest 0%, they would still have a growth rate of 2% because of inflation. I think this is justified as both have demonstrated in the past it has the pricing power to adjust for inflation.
As seen, under these assumptions (rather conservative assumptions in my mind), the long-term growth rate is in the lower single-digit range for T (about 4.0% to 4.5%) and the mid-single digit for CMCSA (about 5.0% to 5.5%). Now to put the pieces together and conclude:
- Paying 10x EBT for a business that will stagnate forever is like owning a bond with a 10% yield.
- In T’s case here, the current valuation is somewhere between 4.74x FWD EBT and 7.7x EV/EBIT. In either case, it is equivalent to purchasing a bond yielding 10%+ (about 13% using the EV/EBIT multiple). In CMCSA’s case, its valuation is 9.45x EBT or 10.0x EV/EBIT), again making it equivalent to an equity bond yielding 10%+ (exactly 10.0% if based on the EV/EBIT multiple).
- At the same time, there is a good prospect of a lower- to mid-single-digit organic growth rate for both (about 4% for T and about 5.5% for CMCSA
Source: author. 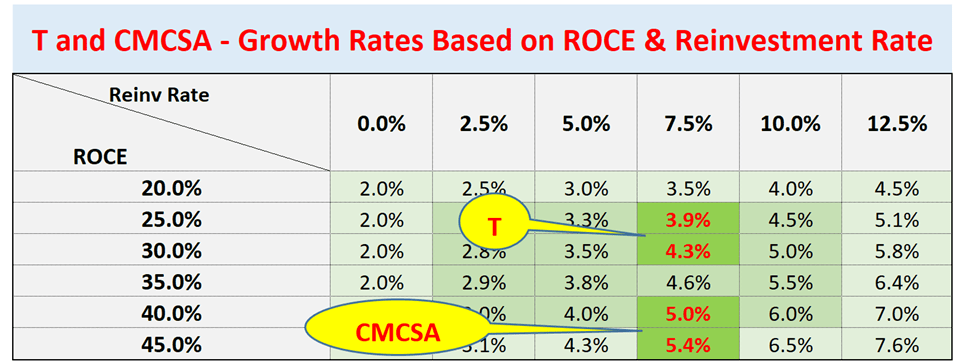
Risks and final thoughts
Investment in T and CMCSA involves both some common risks and their own specific risks. The telecom space is notorious for its intensive capital spending and neither T nor CMCSA is an exception. Also, T and CMCSA compete directly against each other and also compete with other major players like Verizon and T-Mobile. And as you can see from the next chart, some of their competitors have better profitability or larger scale than them. For example, VZ is larger than CMCSA in terms of total revenues and net income. And both VZ and TMUS have better gross margins than T. In particular, CMCSA’s high-speed Internet service segment reported a soft patch last quarter. On a net basis, Comcast added no new broadband subscribers in the June quarter. And management attributed the slowdown partially due to the increased competition from fixed wireless offered by the likes of Verizon and T-Mobile.
Source: Seeking Alpha data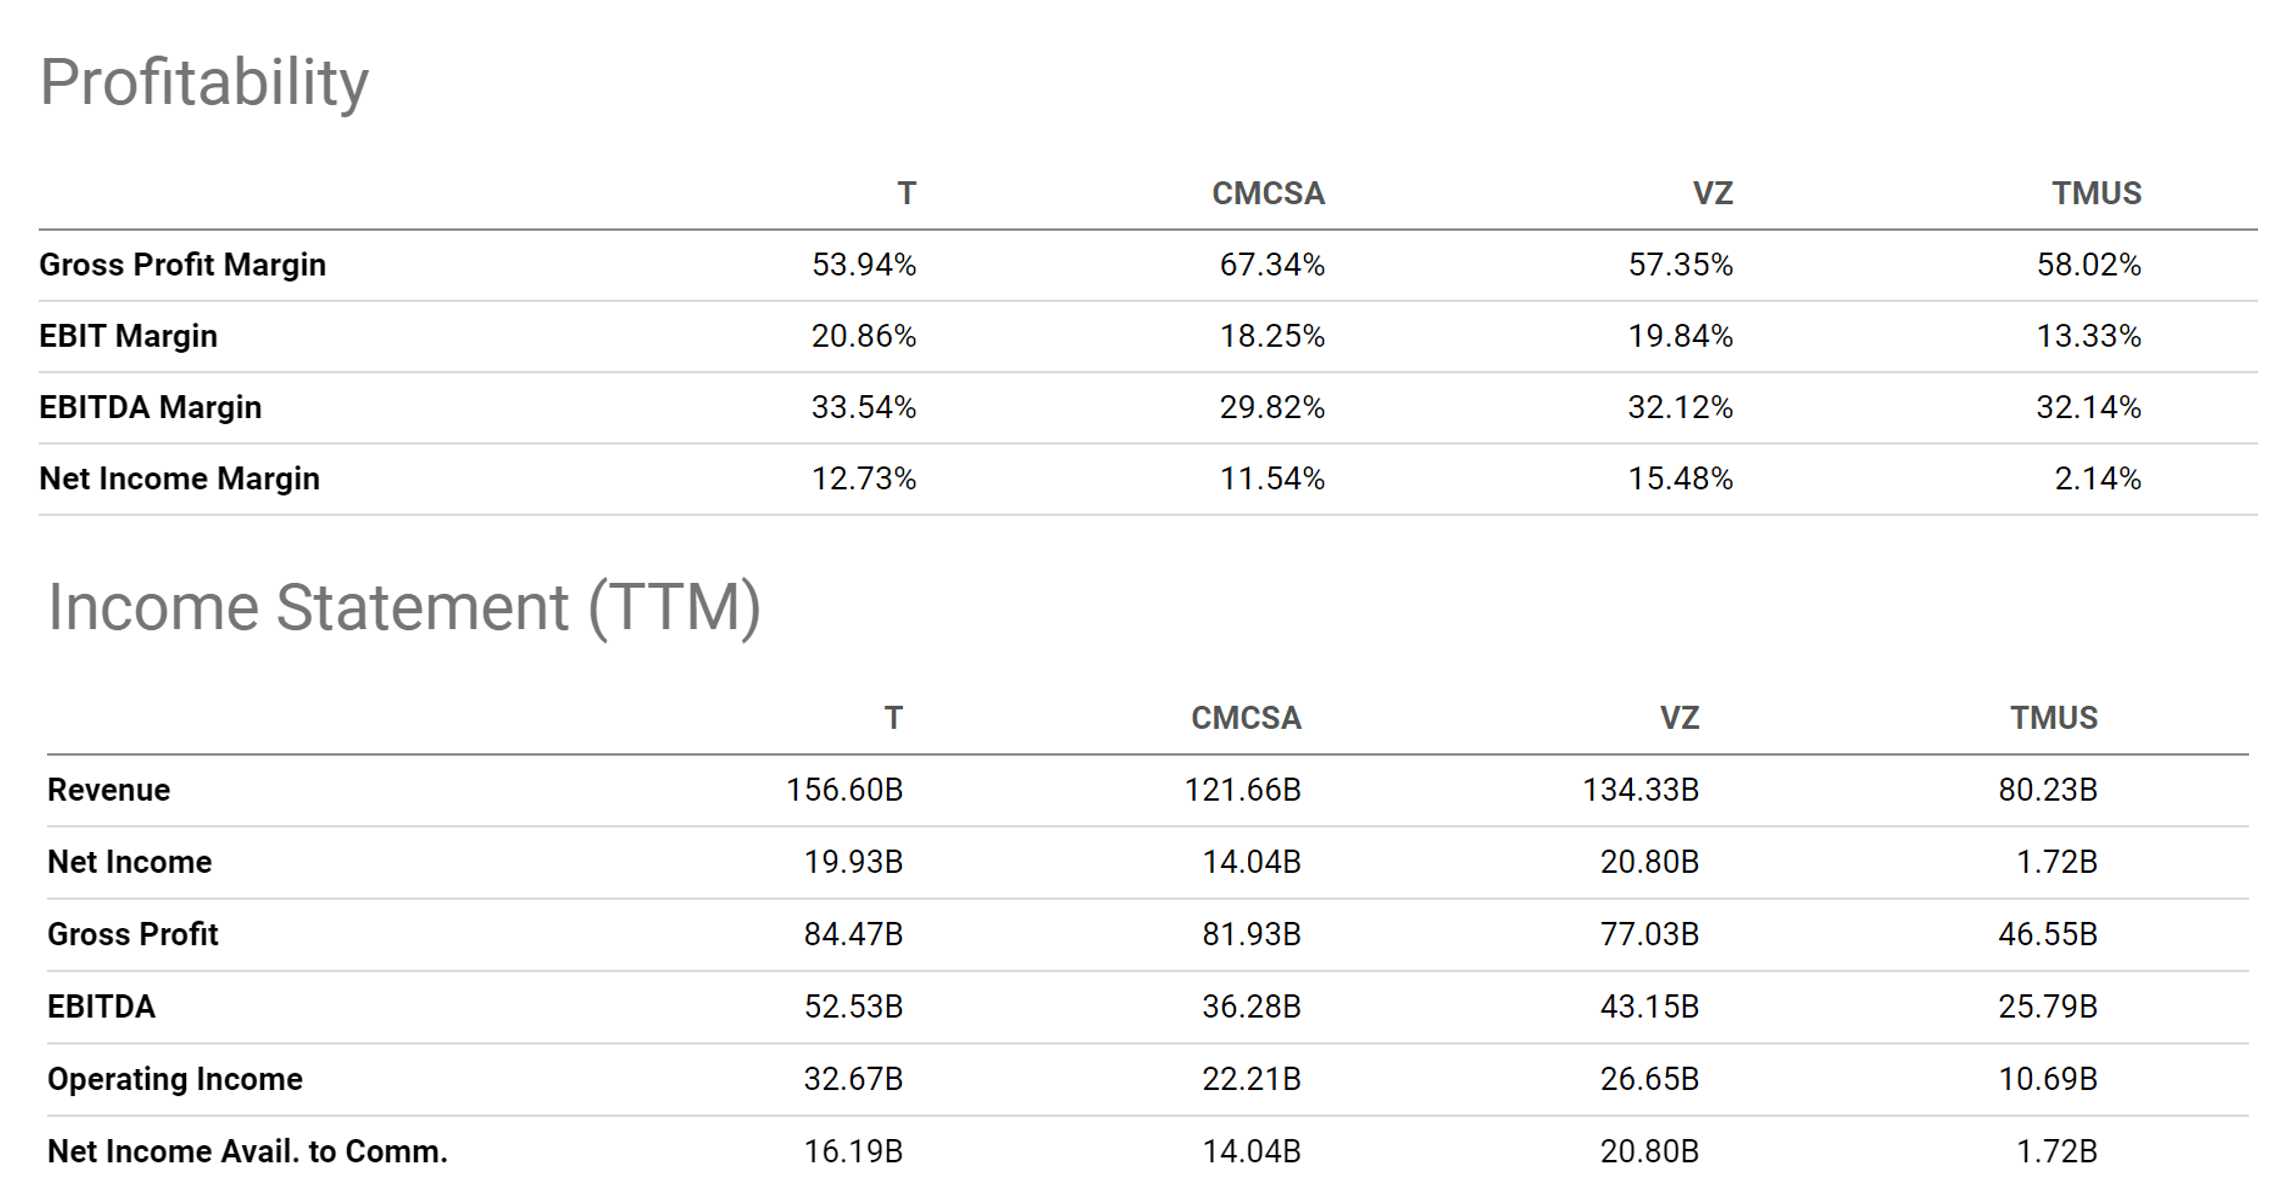
To conclude, the thesis of this article is really simple. Currently, both T and CMCSA are highly discounted in a sector that is already discounted by itself. And stocks with staying power, scale, and secular support like T or CMCSA should not trade below 10x EBT according to what I call Buffett’s 10x pretax rule. However, T’s current valuation is only 4.47x FWD EBT or 7.7x EV/EBIT. And CMCSA is trading at 9.45x EBT or 10.0x EV/EBIT. Paying 10x EBT for a business that will stagnate forever is already like owning a bond with a 10% yield. Any growth is a bonus. And I view both T and CMCSA as having favorable growth curves ahead, given the secular support and their consistent and healthy ROCE. These valuation discounts are too large to sustain the way I see it and the valuation gap could be narrowed by a range of catalysts (such as stronger free cash flow due to CAPEX tapering or stock buybacks, et al).
Be the first to comment