


Dilok Klaisataporn/iStock via Getty Images
The Chart of the Day belongs to the software company Aspen Technology (AZPN). I found the stock by sorting Barchart’s Top Stocks to Buy list first by the closest percentage to its 52-week high, then used the Flipchart feature to review the charts for consistent price appreciation. Since the Trend Spotter signaled a buy on 7/29, the stock gained 2.41%.
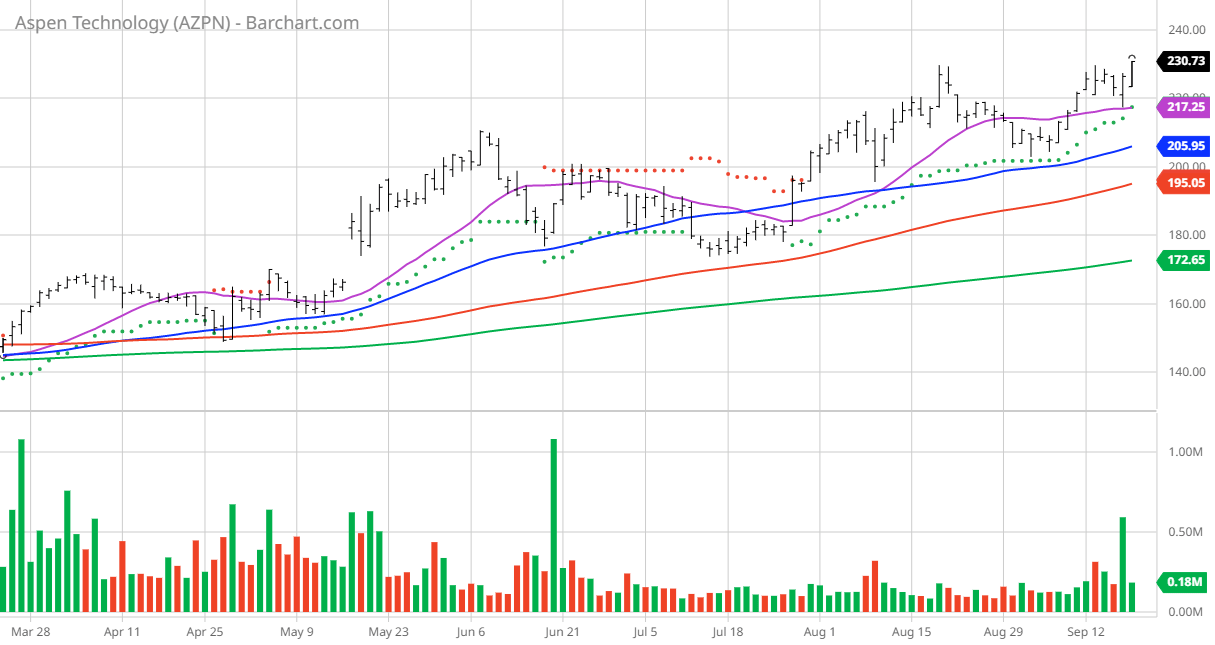
AZPN vs. Daily Moving Averages
Aspen Technology, Inc. provides enterprise asset performance management, asset performance monitoring, and asset optimization solutions worldwide. The company’s solutions address complex environments where it is critical to optimize the asset design, operation, and maintenance lifecycle. It offers artificial intelligence of things, aspen hybrid models, asset performance management, OSI digital grid management, and performance engineering; production optimization for commodity polymers, olefins, refining, and specialty chemicals; subsurface science and engineering; and value chain optimization for energy and polymers and specialty chemicals solutions.
The company serves bulk chemicals, consumer packaged goods, downstream, food and beverage, metals and mining, midstream and LNG, pharmaceuticals, polymers, pulp and paper, specialty chemicals, transportation, upstream, and water and wastewater industries; power generation, transmission, and distribution industries; and engineering, procurement, and construction industries. Aspen Technology, Inc. was incorporated in 2021 and is headquartered in Bedford, Massachusetts.
Barchart’s Opinion Trading systems are listed below. Please note that the Barchart Opinion indicators are updated live during the session every 20 minutes and can therefore change during the day as the market fluctuates. The indicator numbers shown below therefore may not match what you see live on the Barchart.com website when you read this report.
Barchart Technical Indicators:
- 100% technical buy signals but increasing
- 85.77+ Weighted Alpha
- 80.51% gain in the last year
- Trend Spotter buy signal
- Above its 20, 50 and 100-day moving averages
- 4 new highs and up 2.41% in the last month
- Relative Strength Index 65.42%
- Technical support level at 220.05
- Recently traded at 230.99 with 50-day moving average of 205.92
Fundamental factors:
- Market Cap $14.68 billion
- Revenue predicted to increase by 59.60% this year and another 9.50% next year
- Earnings estimated to increase 16.80% this year, an additional 13.20% next year and continue to compound at an annual rate of 18.20% for the next 5 years
Analysts and Investor Sentiment – I don’t buy stocks because everyone else is buying but I do realize that if major firms and investors are dumping a stock it’s hard to make money swimming against the tide:
- Wall Street analysts gave 4 strong buy and 4 buy recommendation on the stock.
- Analysts’ price targets from $182.00 to $255.00 with an average of $214.67.
- The individual investors on Motley Fool voted 82 to 32 for the stock to beat the market with the most experienced investors voting 15 to 2 for the same result.
- 5,020 investors are monitoring the stock on Seeking Alpha.
Ratings Summary
Factor Grades
Quant Ranking
Sector
Industry
Ranked Overall
Ranked in Sector
Ranked in Industry
Be the first to comment