

Sundry Photography
In this analysis, we analyzed ASML Holding N.V. (NASDAQ:ASML) following the company’s weaker-than-expected H1 revenue growth of -2% and guidance by management of 0.2% growth in Q3 2022. We firstly analyzed the semiconductor market and its growth in Q2 2022 among the top 10 largest semiconductor companies. Moreover, we analyzed the semiconductor equipment market and the performance of the top 5 equipment makers. Lastly, we analyzed ASML’s top customers’ capex outlook and compiled our projections of their capex in 2023 to update our forecast of ASML.
Positive Semiconductor Market Growth Outlook
Company Data, Khaveen Investments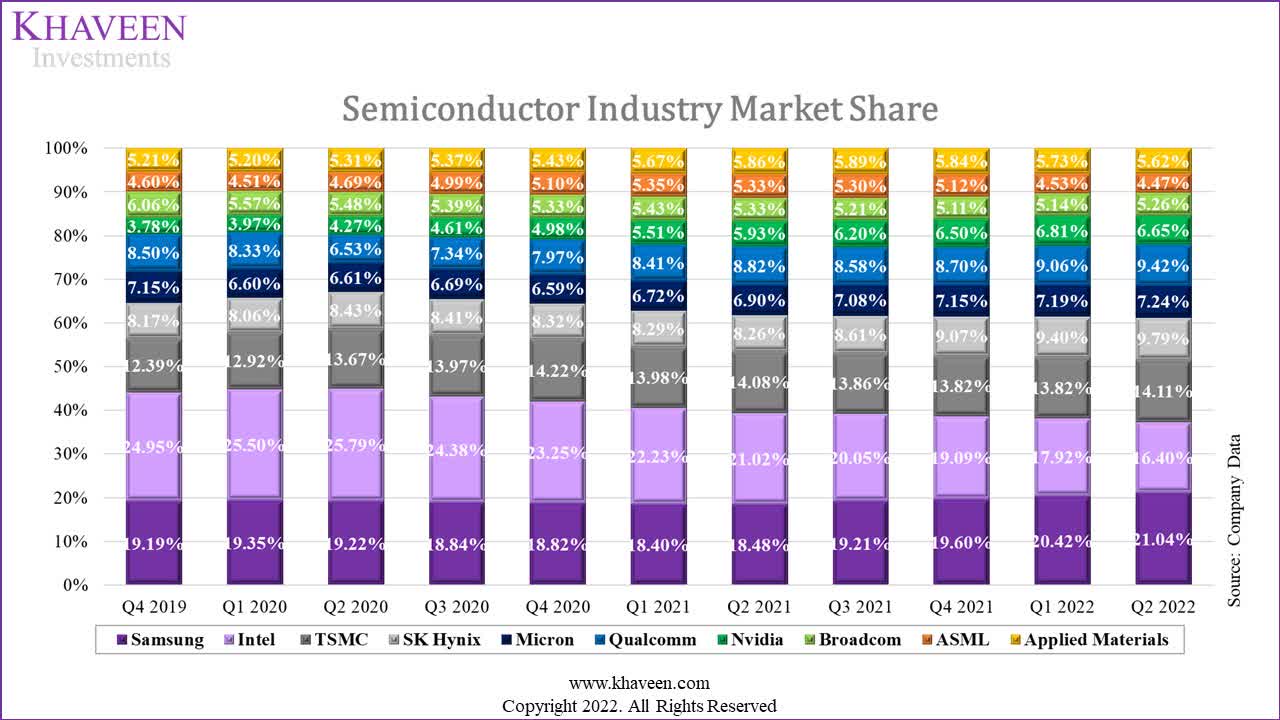
We compiled the top 10 semiconductor companies based on their TTM revenues in the market share chart above. In Q2 2022, Samsung (OTCPK:SSNLF) held its lead in the semiconductor industry as the market leader with a 21% market share followed by Intel (INTC) which maintained its place despite losing some share while TSMC (TSM) continued to catch up with Intel as it gained share. Besides Intel, which was the only logic chipmaker to lose market share among the top 10, the two equipment makers also lost market share during the quarter.
We compared the top 10 semiconductor companies and their performance in Q2 2022 based on their revenue growth (‘TTM’) and the % difference between each company’s actual revenue and estimated revenue. Also, we compiled and compared the company’s stock price change in Q2 2022.
|
Semiconductor Market |
Q2 2022 Revenue (‘TTM’) |
QoQ Growth % (Q2 2022) |
Analyst Consensus Difference % |
Revenue Guidance YoY (Q3 2022) |
Stock Price Change % (Q2 2022) |
Type (Subindustry) |
Market |
|
Samsung Semiconductor |
94.2 |
6.4% |
0.68% |
N/A |
-17.5% |
Chipmaker/ Foundry |
Memory, Foundry |
|
Intel |
73.4 |
-5.5% |
-14.51% |
-15.8% |
-22.5% |
Chipmaker |
Logic |
|
TSMC |
63.2 |
5.4% |
1.89% |
35.6% |
-18.6% |
Foundry |
Foundry |
|
SK Hynix |
43.8 |
7.5% |
-1.25% |
N/A |
-21.6% |
Chipmaker |
Memory |
|
Micron (MU) |
32.4 |
3.9% |
-0.12% |
5.1% |
-26.5% |
Chipmaker |
Memory |
|
QUALCOMM (QCOM) |
42.1 |
7.3% |
0.74% |
22.1% |
-11.4% |
Chipmaker |
Logic |
|
NVIDIA (NVDA) |
29.7 |
0.7% |
0.00% |
-16.9% |
-41.8% |
Chipmaker |
Logic |
|
Broadcom (AVGO) |
23.5 |
5.6% |
0.59% |
20.2% |
-21.8% |
Chipmaker |
Analog, Logic |
|
ASML |
20.0 |
1.9% |
5.24% |
0.2% |
-27.4% |
Equipment |
Equipment |
|
Applied Materials (AMAT) |
25.2 |
1.3% |
3.99% |
8.6% |
-27.8% |
Equipment |
Equipment |
|
Average |
44.7 |
3.4% |
-0.27% |
7.37% |
-23.69% |
Source: Company Data, Khaveen Investments
Based on the table, the average growth of the top 10 semicon companies was positive at 3.4% QoQ based on TTM revenues in Q2 2022. However, the average difference between the companies’ actual and average revenue was -0.27%, largely due to Intel with a negative difference of 14.51%.
Among the top 10 companies, all memory chipmakers had positive growth and were the best performing with an average growth of 5.92%. This is as the DRAM grew by 6.5% QoQ driven by server growth and the NAND market grew by 1.1% QoQ in Q2 2022 as
NAND Flash contract pricing increased by approximately 3-8% in 2Q22 due to Kioxia’s raw material contamination incident according to Trendforce. However, Micron previously provided low guidance of only 5.1% growth YoY and cited that select market weakness and macroeconomic uncertainty are impacting our near-term outlook and visibility while expecting bit shipments for NAND and DRAM to decline whereas Samsung and SK Hynix did not provide guidance.
Moreover, Qualcomm had the second-best growth in Q2 2022 despite the slowdown in the smartphone market. According to Counterpoint Research, Qualcomm’s share had
grown 56% YoY in Q2 2022 driven by the higher premium mix which has led to growth in the ASPs.
On the other hand, Intel and Nvidia, market leaders of CPUs and GPUs respectively, were the two lowest-performing companies following the weakness in the PC market and were the only two companies that provided negative guidance as the PC market is expected to decline by 12.8% in 2022 according to the IDC.
Equipment makers among the top 10 performed the worst but still had a positive average growth of 1.6% for ASML and Applied Materials. This is as the ASML’s management stated that the company was faced with
increasing supply chain constraints, which resulted in delayed system starts.
ASML provided flattish guidance as ASML’s management stated that it
expects sales in Q3 to be in a similar guided range as Q2 as increasing supply constraints drive more fast shipments and delay revenue recognition to subsequent quarters.
When comparing the average stock price change, all of the top 10 companies had negative stock price change with an average of -23.69% in Q2 2022. This is despite the positive growth of the companies at an average of 3.4%. Thus, we believe that the decline in the stock price at an average of 23.69% does not reflect the resilient semiconductor market whose average growth was nearly in line with analyst consensus with an average difference of only -0.27%. Moreover, despite the negative guidance of Intel and Nvidia, we believe the average guidance of 7.37% in Q3 2022 indicates the continued positive growth outlook of the semiconductor industry.
Strong Guidance in Semiconductor Equipment Market
Company Data, SEMI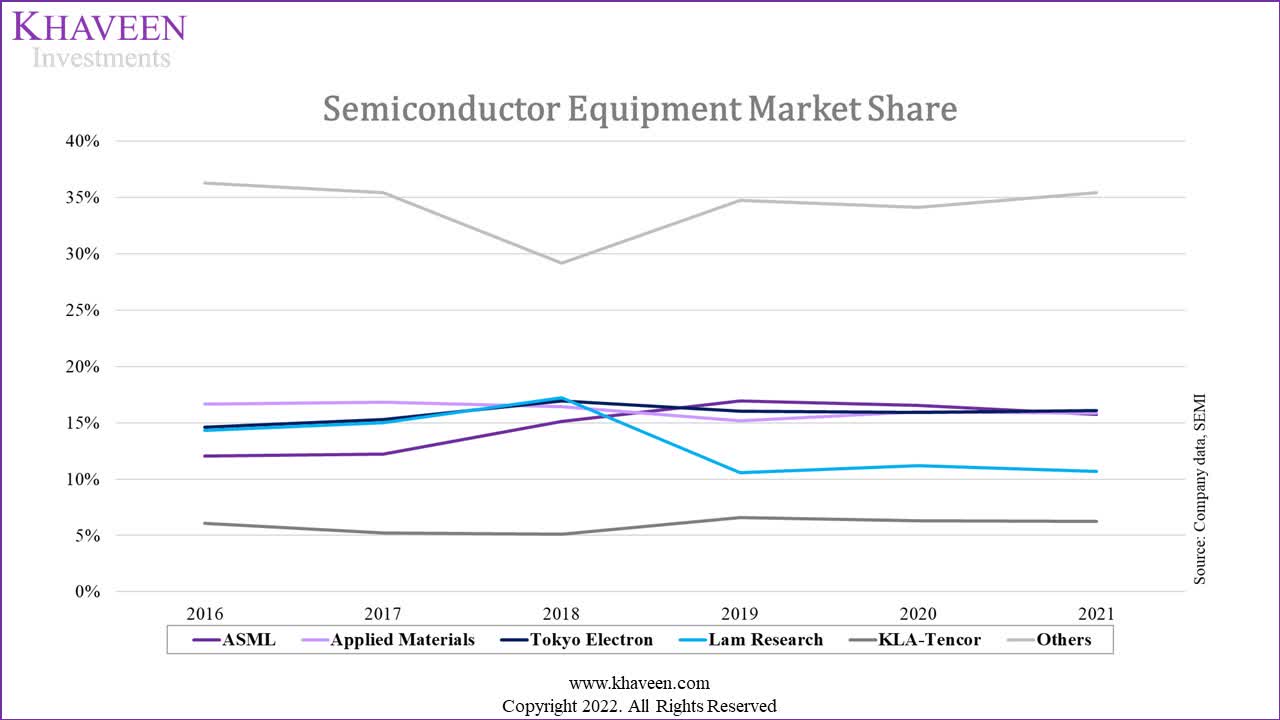
Moreover, we analyzed the semiconductor equipment market based on the top 5 semicon equipment companies as seen in the chart above and their performance in Q2 2022 based on their revenue growth (‘TTM’) and the % difference between each company’s actual revenue and estimated revenue.
|
Semiconductor Equipment Market |
Q2 2022 Revenue (‘TTM’) |
Q2 2022 Growth % |
Analyst Revenue Consensus Difference % |
Guidance Q3 |
Stock Price Change % (Q2 2022) |
|
ASML |
20,010 |
1.9% |
10.2% |
0.2% |
-27.4% |
|
Tokyo Electron (OTCPK:TOELF) |
14,927 |
-9.3% |
-10.5% |
17.3% |
-28.2% |
|
Applied Materials |
25,159 |
1.3% |
4.0% |
8.6% |
-27.8% |
|
Lam Research (LRCX) |
17,227 |
2.9% |
10.2% |
14.0% |
-18.9% |
|
KLA (KLAC) |
9,212 |
6.5% |
2.9% |
25.0% |
-11.4% |
|
Average |
17,307 |
0.7% |
3.4% |
13.0% |
-22.8% |
Source: Company Data, Khaveen Investments
As seen in the table above, the average revenue growth in Q2 2022 was 0.7% among the top 5 semicon equipment makers. ASML performed above the average at 1.9%. Also, it was tied with Lam Research with the highest revenue consensus beat at 10.2% which is above the average of 3.4%.
The company which performed the worst was Tokyo Electron whose revenue growth declined by 9.3%. The company growth was also below analyst expectations with the highest % difference between its revenue and analyst consensus of -10.5% in Q2. Tokyo Electron’s management has indicated in their recent Q1 FY2023 earnings briefing that
some sales were recognized in Q4 by putting forward the shipment because of high demand.
Its management also stated
on the other hand, there are some shipments shifted to the second quarter as well
which is likely due to
component supply shortage, disruption to logistics and customer clearance issues.
Despite the average growth of the top 5 semicon equipment makers of only 0.7%, the average guidance of the top 5 companies was 13% for Q3 2022. According to Lam Research’s earnings briefing, the company highlighted that it had increased its headcount to manage its supply chain.
We had headcount growth, primarily in the factory and field organizations to address the higher output levels, to manage supply chain constraints as well as to support increasing customer delivery and installation. – Doug Bettinger, Lam Research Executive Vice President and Chief Financial Officer
For KLA, the company had the highest growth in Q2 at 6.5%. However, its % difference with analyst consensus was only 2.9% and below the average of 3.4%. Though, management provided strong guidance in its latest earnings briefing at 25% YoY in Q3 2022 as it adds capacity.
We are strategically adding capacity across our global manufacturing footprint to support our customers’ growing process control requirements our near-term outlook and our long-term through-cycle growth thesis. – Rick Wallace, KLA CEO
Overall, in Q2 2022, the semicon equipment companies were not spared with an average stock price decline of 22.8% as its average revenue growth was flat at 0.7%. However, this was still above analyst expectations with an average difference of 3.4% with analyst consensus revenues. Moreover, we believe the strong revenue guidance in Q3 indicates a positive outlook for the semicon equipment market players with an average of 13%. In comparison with the average revenue growth guidance of the top semicon companies in the previous point of 7.37%, the average revenue growth guidance for the top semicon equipment makers is higher at 13% which we believe is because the equipment makers’ guidance is forward-looking whereas the semicon chipmakers guidance is lagging as the semicon equipment needs to be installed first before production can begin and incremental revenue for chipmakers should only be reflected in the next quarter at least. Thus, we expect the Q4 growth for the semicon chipmakers to be better than Q3 with strong guidance from the equipment makers. For ASML, we believe that its stock price decline of 27.4% does not reflect its performance with above-average revenue growth in Q2 2022 of 1.9% and a difference with analyst consensus of 10.2%.
ASML Impacted by Top Customers Capex Cuts
|
Company Revenue Breakdown |
Logic |
Memory |
|
ASML |
70.2% |
29.8% |
|
Applied Materials |
60.0% |
40.0% |
|
Tokyo Electron |
48.7% |
51.3% |
|
Lam Research |
39.0% |
61.0% |
|
Average |
54.5% |
45.5% |
Source: Company Data, Khaveen Investments
In the table above, we compiled the revenue breakdown by memory and logic segments by the top semicon equipment companies to analyze and determine which company could be impacted more by the capex cuts by the memory chipmakers. As seen above, ASML’s memory segment accounted for nearly 30% of revenues while its logic segment was 70% of revenues. This makes it the company with the lowest breakdown % from memory. In contrast, Lam Research derived 61% of its revenue from its memory segment was the largest segment for the company with logic at 39% of revenue. This is followed by Tokyo Electron as the second largest memory company at 51.3% of revenue.
We compiled the company’s top customers’ capex projections from our previous analyses to forecast ASML’s revenue growth. For SK Hynix, we projected the company’s capex based on its historical revenue as a % of capex at a 5-year average of 36.4% with analyst revenue estimates.
|
Memory Capex Projections ($ mln) |
2021 |
2022F |
2023F |
2024F |
2025F |
|
Samsung |
16,060 |
13,435 |
13,435 |
13,435 |
13,435 |
|
Micron |
10,589 |
12,000 |
8,273 |
16,677 |
17,513 |
|
SK Hynix |
10,905 |
12,874 |
12,651 |
15,726 |
17,859 |
|
Total |
37,554 |
38,309 |
34,359 |
45,837 |
48,807 |
|
Growth |
2.0% |
-10.3% |
33.4% |
6.5% |
Source: Company Data, Khaveen Investments
From the table, we expect memory total capex from Samsung, Micron, and SK hynix to grow by 2% in 2022 before declining by 10.3% in 2023. In our previous analysis of Micron, we highlighted management’s plan to reduce its capex in 2023 due to market uncertainty.
In addition, SK hynix planned to cut its capex by 25% to $12.16 bln next year according to Bloomberg. This is in line with our forecast of the company’s capex based on a 5-year average capex as a % of the revenue of 36.4% with analyst revenue estimates. Whereas for Samsung, we estimated its semiconductor capex previously of $230 bln assumed over the next 10 years.
|
Logic Capex Projections ($ mln) |
2021 |
2022F |
2023F |
2024F |
2025F |
|
TSMC |
30,153 |
40,000 |
45,581 |
53,226 |
61,277 |
|
Samsung |
4,730 |
3,957 |
3,957 |
3,957 |
3,957 |
|
Intel |
25,167 |
23,000 |
28,000 |
30,370 |
31,979 |
|
Total |
60,050 |
66,957 |
77,538 |
87,553 |
97,213 |
|
Growth |
11.5% |
15.8% |
12.9% |
11.0% |
Source: Company Data, Khaveen Investments
Moreover, from our previous analysis of TSMC, we updated our projection of the company’s capex as management stated in its earnings briefing in Q2 2022 that it expects its capex to be around the low-end of its guidance of between $40 bln to $44 bln in 2022. Moreover, we forecasted its capex in 2023 with our revenue estimates and a capex as a % of revenue of 52.9% based on its 2021 figure which is an increase compared to 2022 as management highlighted that some of its 2022 capex is expected to be pushed next year due to supply chain issues.
Additionally, from our previous analysis of Intel, we based our 2022 capex projection on management’s guidance in its earnings briefing where it reduced its capex target by $4 bln to $23 bln. However, we expect Intel’s capex to recover beyond 2022 as indicated by management that it aimed to spend around 30% of capex as a % of revenue until 2024.
|
Capex Projections ($ mln) |
2021 |
2022F |
2023F |
2024F |
2025F |
|
Micron |
10,589 |
12,000 |
8,273 |
16,677 |
17,513 |
|
TSMC |
30,153 |
40,000 |
45,581 |
53,226 |
61,277 |
|
Samsung |
27,500 |
23,005 |
23,005 |
23,005 |
23,005 |
|
Intel |
25,167 |
23,000 |
28,000 |
30,370 |
31,979 |
|
SK hynix |
10,905 |
12,874 |
12,651 |
15,726 |
17,859 |
|
Total |
104,314 |
110,879 |
117,510 |
139,004 |
151,634 |
|
Growth |
6.3% |
6.0% |
18.3% |
9.1% |
Source: Company Data, Khaveen Investments
As seen in the table, we projected the overall total capex for Micron, TSMC, Samsung, Intel, and SK hynix to grow by 2.5% in 2022 and slow down to 1.5% in 2023 before recovering in 2024 at 13.3%.
All in all, based on our compilation of ASML’s customers’ capex projections through 2025, we expect its logic customers including Intel, TSMC and Samsung capex to increase with higher growth in 2023 compared to 2022 where Intel had reduced its capex and TSMC guided its capex to be in the low range of its guidance. Conversely, we expect its memory customers’ capex growth to slow in 2023 with Micron and SK hynix’s management only guiding for capex cuts in 2023. Thus, we expect memory chipmakers’ capex to decline in 2023 while logic chipmakers’ capex to recover in 2023 based on our forecasts. Though, as we analyzed the breakdown of logic and memory among the top 5 semicon equipment makers, we expect ASML to be impacted less compared to its competitors as its memory segment revenue breakdown is the lowest at only 29.8% compared to Applied Materials, Lam Research and Tokyo Electron with a higher % of revenue from their memory segments. Based on our capex growth projections of ASML’s top customers, we expect a net 8% growth in 2023 despite the expected memory capex decline.
Risk: Prolonged Market Weakness
According to management, the company highlighted in its earnings briefing that its customers have indicated slowing demand in some consumer markets such as PCs and smartphones.
Some customers are indicating they are seeing signs of slowing demand in certain consumer-driven market segments, primarily PCs and smartphones. – Peter Wennink, CEO
According to the IDC, the PC market is forecasted to decline by 12.8% in terms of unit shipments in 2022 in its latest forecast. However, the IDC also forecasted the PC market to decline in 2023 by 2.6%. Thus, we believe this could pose a threat to ASML’s growth should the market slowdown continue in 2023.
Further contraction is also expected in 2023 as consumer demand has slowed, the education demand has been largely fulfilled, and enterprise demand gets pushed out due to worsening macroeconomic conditions. – IDC
Valuation
We updated our revenue projections of the company based on the company’s revenue breakdown by logic, memory, and service revenue. For its logic segment, we projected its growth based on our capex forecast of Intel, TSMC and Samsung Foundry. Moreover, we forecasted its memory growth based on our capex projections of Samsung, SK hynix, and Micron. For its service revenue, we based our forecast on its historical service revenues as a % of logic and memory revenue of 35.9% on a 2-year average. Overall, we forecasted its revenue growth to slow down to a 5-year average of 12% compared to our previous analysis of 13.2% due to the expected slowdown in memory capex growth.
|
ASML Revenue Projections (EUR mln) |
2019 |
2020 |
2021 |
2022F |
2023F |
2024F |
2025F |
|
Logic |
6,565 |
7,393 |
9,589 |
10,692 |
12,382 |
13,981 |
15,523 |
|
Growth % |
12.6% |
29.7% |
11.5% |
15.8% |
12.9% |
11.0% |
|
|
Memory |
2,431 |
2,923 |
4,064 |
4,146 |
3,718 |
4,960 |
5,282 |
|
Growth % |
20.2% |
39.0% |
2.0% |
-10.3% |
33.4% |
6.5% |
|
|
Service and field options |
2,824 |
3,662 |
4,958 |
5,328 |
5,781 |
6,801 |
7,470 |
|
Growth % |
29.7% |
35.4% |
7.5% |
8.5% |
17.6% |
9.8% |
|
|
Service revenue as % of total logic and memory revenue |
35.5% |
36.3% |
35.9% |
35.9% |
35.9% |
35.9% |
|
|
Total |
11,820 |
13,978 |
18,611 |
20,165 |
21,881 |
25,742 |
28,276 |
|
Growth % |
18.3% |
33.1% |
8.4% |
8.5% |
17.6% |
9.8% |
Source: ASML, Khaveen Investments
We valued the company with a DCF analysis and based our terminal value on the semicon equipment industry average EV/EBITDA of 12.37x.
Seeking Alpha, Khaveen Investments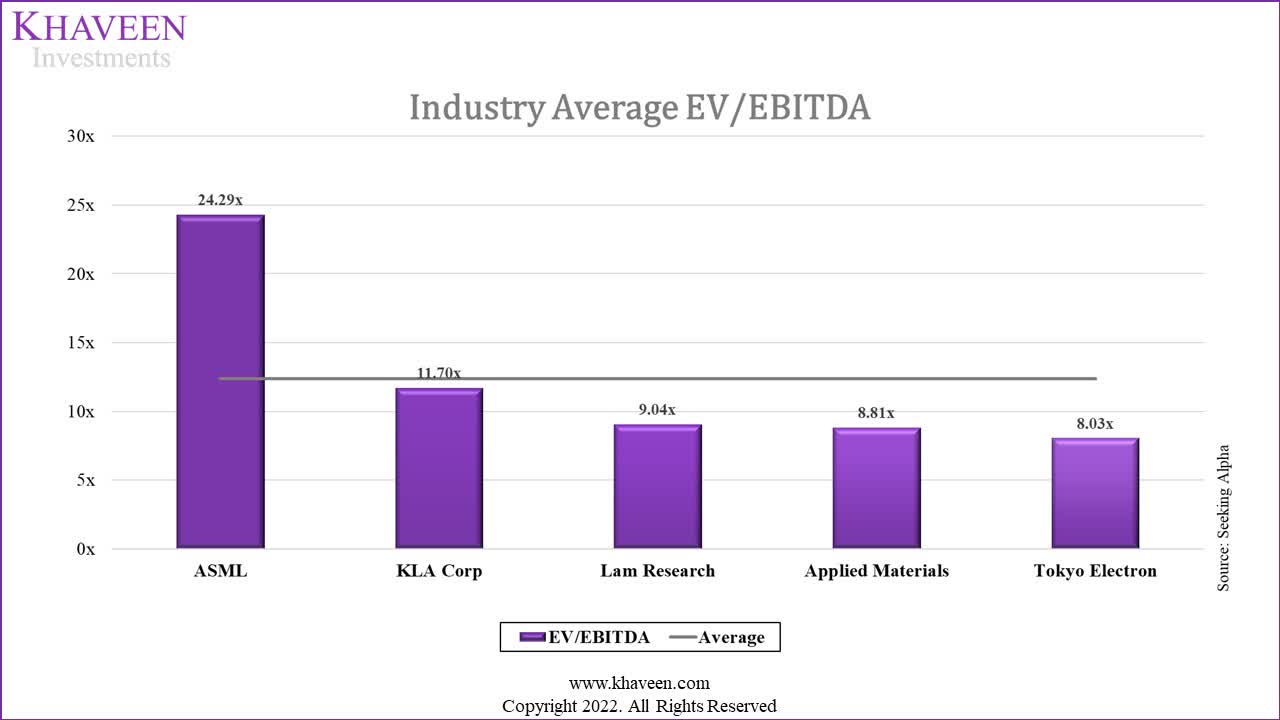
Based on a discount rate of 4.7% (company’s WACC), we obtained an upside of 17.21%.
Khaveen Investments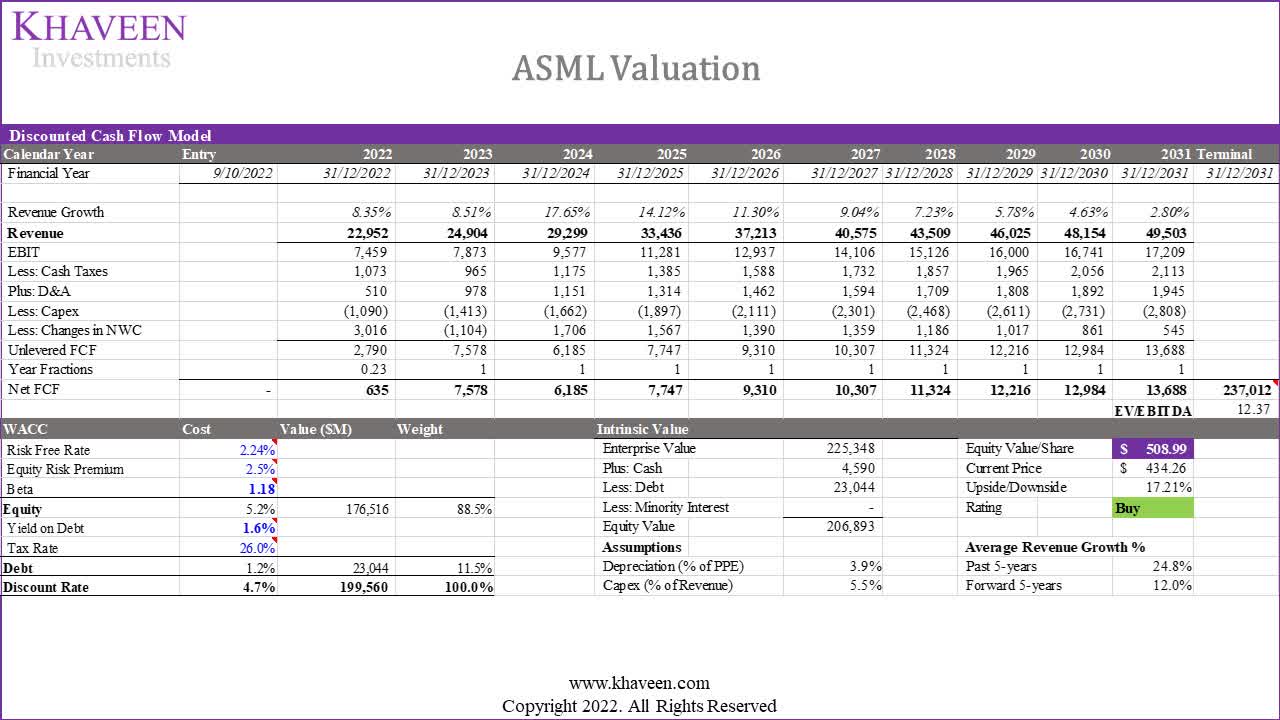
Verdict
All in all, we believe that the decline in the stock price at an average of 23.69% does not reflect the semiconductor market which had an average growth that was nearly in line with analyst consensus with an average difference of only -0.27% and we believe the average guidance of 7.37% in Q3 2022 indicates the continued positive growth outlook of the semiconductor market. Moreover, we believe the strong revenue guidance in Q3 indicates a positive outlook for the semicon equipment market players with an average of 13%. However, we expect ASML’s memory customers’ capex growth to slow in 2023 with Micron and SK Hynix’s management guiding for capex cuts in 2023 but we expect ASML to be relatively impacted less by the slowdown compared to its competitors as its revenue breakdown by its memory segment only accounted for 29.8% of its revenue and calculated a net 8% growth in 2023. Overall, we rate the company as a Buy with a lower price target of $508.99 with a reduced revenue growth forecast.
Be the first to comment