


Pgiam/iStock via Getty Images
Investment Thesis
Expectations for stock prices by institutional investment organizations in managing their multi-billion-dollar stock portfolios require the negotiating help, and often temporary liquid capital assist, of Market-Makers [MMs] in the prompt, low-disturbance round-up of desired shares of identified promising companies.
MM risk-avoidance requirements continually drive derivative market prices, revealing in the limited-life legal contracts traded there the underlier stocks’ price-range extremes regarded likely by the well-informed sellers and buyers of the related risk protections. They are informed by over 100,000 world-wide wide-eyed, wide–eared MM employees on a 24x7x365 watch for change in competitive circumstances. Changes which get immediately communicated to the home-base trading desks.
Following an unchanging risk-minimizing portfolio management discipline, we keep records of how insightful the maintained intelligences flow has been on each of thousands of subject stocks over decades of daily observations. Those records provide the basis for making intelligent transactions about likely coming prices of specific securities, near-term.
Among the best potentials for price increases at this point in time is Ascendis Pharma A/S (ASND).
Company description
“Ascendis Pharma A/S, a biopharmaceutical company, focuses on developing therapeutics for unmet medical needs. The company offers SKYTROFA for treating patients with growth hormone deficiency (GHD). It also develops Growth Hormone (HGH) for pediatric GHD in Japan; for adults with GHD; parathyroid hormone for adult hypoparathyroidism; and CNP for pediatric achondroplasia. In addition, the company develops toll like receptors agonist for intratumoral delivery; and for systemic delivery. The company was incorporated in 2006 and is headquartered in Hellerup, Denmark.”
Source: Yahoo Finance
Yahoo Finance
The big picture: Risks vs. Rewards
Investment portfolio candidate competitors to ASND include many companies in the Health Care industry.
Figure 1
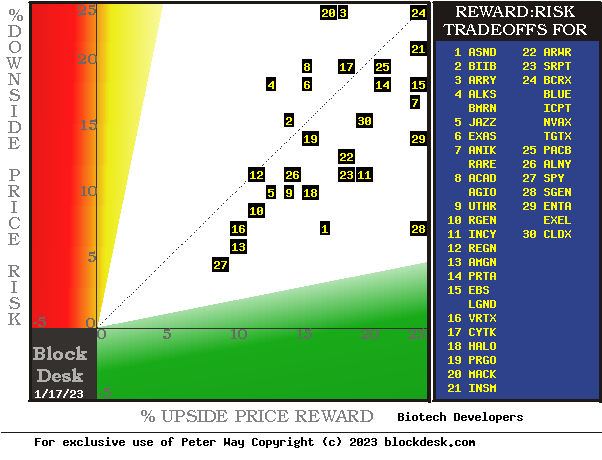
blockdesk.com (used with permission)
The tradeoffs here are between near-term upside price gains (green horizontal scale) seen worth protecting against by Market-makers with short positions in each of the stocks, and the prior actual price drawdowns experienced during holdings of those stocks (red vertical scale). Both scales are of percent change from zero to 25%.
The intersection of those coordinates by the numbered positions are identified by the stock symbols in the blue field to the right.
The dotted diagonal line marks the points of equal upside price change forecasts derived from Market-Maker [MM] hedging actions, and the actual worst-case price draw-downs from positions that could have been taken following prior MM forecasts like today’s.
This map of price change potentials places better-tradeoff candidates in the directions of down and to the right. The “frontier” of currently most-capable stocks for near-term gains begins with a “market index” norm of the S&P 500 index ETF (SPY) at [27]. It continues with AMGN at [13], and ASND at [1] and SGEN at [28]. Our principal interest is in ASND.
Those current forecasts are implied by the self-protective behaviors of MMs who must usually put firm capital at temporary risk to balance buyer and seller interests in helping big-money portfolio managers make volume adjustments to multi-billion-dollar portfolios. Their protective actions define daily the extent of likely expected price changes for thousands of stocks and ETFs.
This map is a good starting point, but it can only cover some of the investment characteristics that often should influence an investor’s choice of where to put his/her capital to work. The table in Figure 2 covers the above considerations and several others.
Comparing Alternative Investments
Figure 2
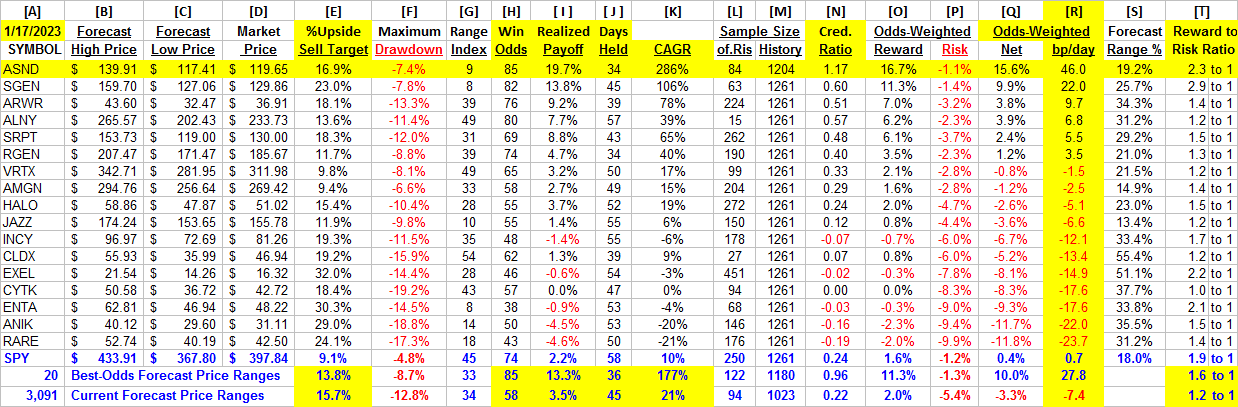
blockdesk.com (used with permission)
The price-range forecast limits of columns [B] and [C] get defined by MM hedging actions to protect firm capital required to be put at risk of price changes from volume trade orders placed by big-$ “institutional” clients.
We then use market actions subsequent to the prior appearances of up-to-down balance prospects like those of this day.
[E] measures potential upside risks for MM short positions created to fill such orders, and reward potentials for the buy-side positions so created. The buy-side risks actually encountered from prior forecasts like the present are in [F], as the most severe loss moments encountered during holding periods in effort to reach [E] gains. Those are where buyers are most likely to accept losses.
[H] tells what proportion of the [L] sample of prior like forecasts have earned gains by either having price reach its [B] target, or be above its [D] entry cost at the end of a 3-month max-patience holding period limit. [ I ] gives the net gains-losses of those [L] experiences and [N] suggests how credible [E] may be compared to [ I ].
Further Reward~Risk tradeoffs involve using the [H] odds for gains, with the 100 – H odds as loss weights for N-conditioned [E] and for [F], for a combined-return score [Q]. By using the typical position holding period [J] on [Q] we have a figure of merit [fom] ranking measure [R] useful in portfolio position preferencing. Figure 2 is row-ranked on R among candidate securities, with ASND in top rank.
No other alternatives than ASND have better raw Reward to Risk ratios (3.9 to 1) nor have stronger odds-weighted current stock price expectations. That is further evidenced in Compound Annual Growth Rates [K] of 286% for ASND and only 10% for SPY.
On the same standards of comparison the only one of the alternative stocks approaching the 46.0 fom [R] of ASND is SGEN with an average gain of 22.0 bp/day.
Among the 20 best-ranked of all 3,091 of today’s MM price-range forecasts, their higher realized payoffs (13.8%), Win Odds (85 of 100) and holding periods (36 days) boost their average annual CAGRs to 177%.
Recent MM price-range forecast trends
The current week’s combined easing in market quotes and modes expansion of coming-price expectations provide ASND with improved competitive investment comparisons to alternatives. Figure 3, unlike “technical analysis charts” shows daily forecasts of coming likely price ranges, rather than past actual days’ prices.
Those forecast price ranges are split into upside and downside prospects by the issue’s closing price of the current-day forecast. The Range Index tells what percentage of that range lies below the current market price. This clear definition of expected price risk in relation to prospective upside price for all stocks makes comparisons between alternative portfolio candidates much easier to evaluate than most nebulous references to “risk” when what may be referred to is merely poorly-defined “uncertainty” of the future.
Figure 3
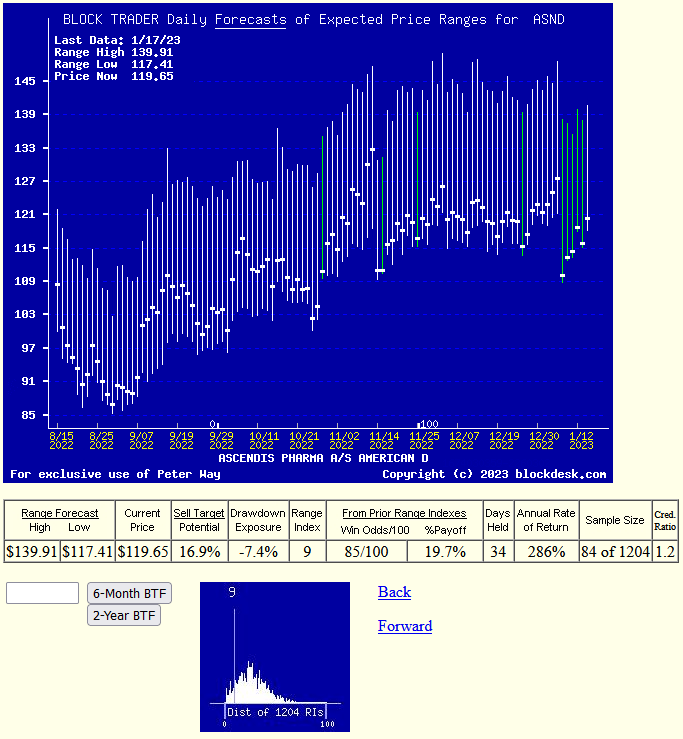
blockdesk.com (used with permission)
The “thumbnail” lower picture in Figure 3 shows the distribution of the past 5 years of daily MM forecasts in terms of the market’s then current price quote for ASND relative to its upper and lower limits. The current 9 indicates that only 9% of the full forecast range is to the downside, while the remaining 91% is to the upside, many times that to the downside.
The frequency of the past 5 years’ daily Range Index value provides a clear visual idea of the odds for higher coming prices in coming weeks and months.
Conclusion
Ascendis Pharma A/S, as seen by the market-making community, appears to be a currently most attractive medical health care stock for near-term capital gain among many leading competitors.
Be the first to comment