

imaginima/E+ via Getty Images
In the REIT market, there are many different areas of concentration, with these areas based on either geography, asset type, ownership structure, or some combination of these items. One player in the integrated REIT market that has a variety of asset types and that also boasts a construction component to it, is Armada Hoffler Properties (NYSE:AHH). Although recent revenue for the company has taken a step back, the overall cash flow picture of the business has been generally positive. Current guidance calls for continued growth for the enterprise. And on the whole, shares don’t look overly priced. Although the company’s stock might be closer to being fairly valued relative to similar firms, the stock is cheap enough that I could understand why some investors might want to purchase shares.
A multi-faceted REIT
Today, Armada Hoffler Properties describes itself as a full-service real estate company that is dedicated not only to owning multiple types of assets, but that also provides certain construction functions. On the asset ownership side, the business owns high-quality office, retail, and multifamily properties in its portfolio. Generally speaking, these assets are spread between the Mid-Atlantic and Southeastern portions of the US. On the retail side, the company currently owns 36 properties that make up nearly 4.07 million square feet in all. As of the end of the company’s 2021 fiscal year, this particular portion of its portfolio boasted a 96% occupancy rate and generated $17.13 in annualized base rent per leased square foot each year.
Armada Hoffler Properties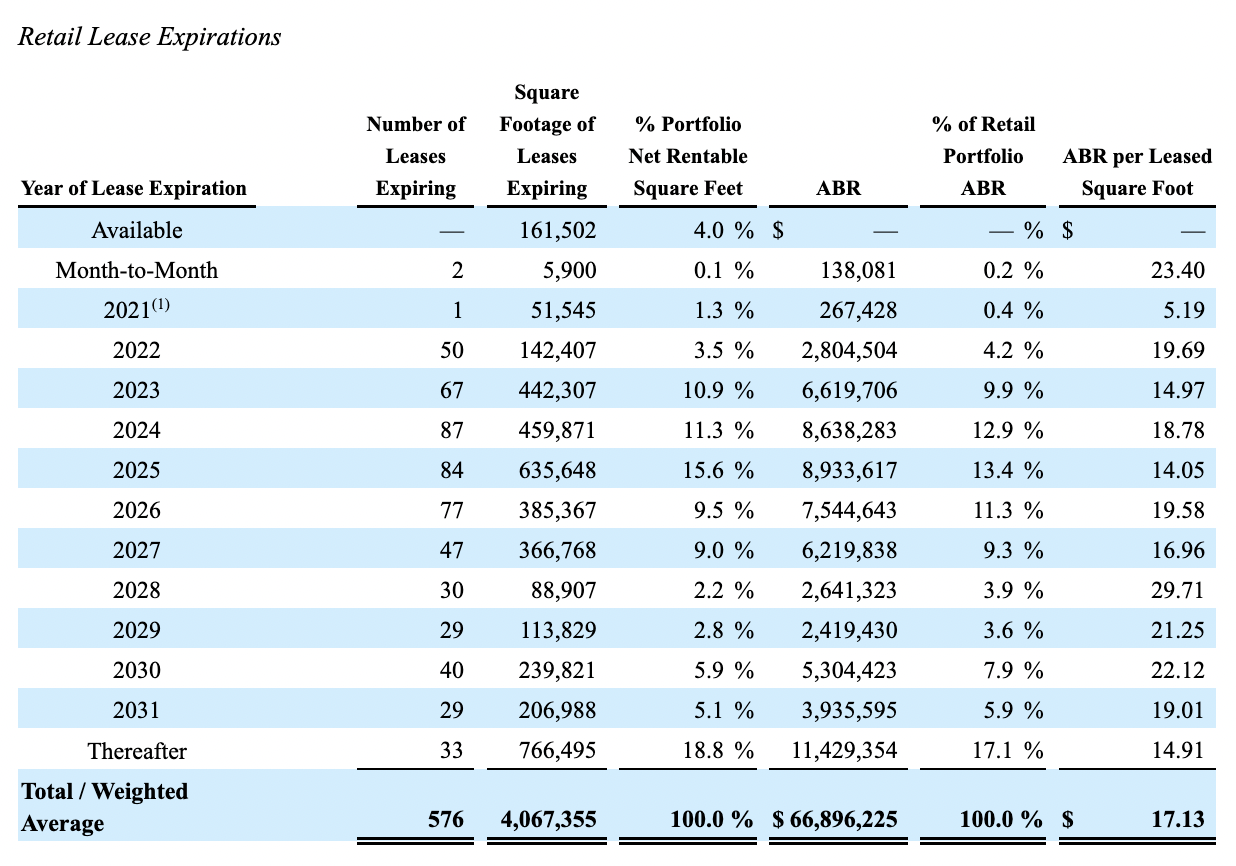
There are, of course, other assets the company has. According to management, the firm also has 7 office properties with a combined 1.30 million square feet. As of the end of its 2021 fiscal year, these properties were 96.8% occupied and generated annualized base rent of $28.21 per leased square foot. The company also owns 11 multifamily properties that have a combined 2,959 units to them. These assets have a rather solid 97.4% weighted average occupancy rate and they generate average monthly rent per unit of $1,680. On the asset side, it is also worth noting how the company’s lease expirations are structured. Between the time of this writing and the end of the company’s 2025 fiscal year, it will have just 32.2% of its office portfolio leases come due. For its retail properties, this figure comes out to 40.8%.
Armada Hoffler Properties
On top of the aforementioned assets, the company also has a development pipeline and it has been engaging in various asset changes. For instance, as of the end of its latest fiscal year, the company had four different properties under development for a combined $287 million in costs. On top of this, it also had another property that was not yet stabilized and that was being redeveloped that should cost investors $407 million. Based on the data available, the business is doing some investment in the office space, but the bulk of its recent investments have been focused on either multifamily properties or mixed-use developments. As part of its effort to grow, the company is also dedicated to acquiring assets when it finds ones that it deems to be appropriate. In January of this year, for instance, the business completed the purchase of a 90% interest in the Exelon building, a mixed-use property in Baltimore that is 23 stories of Class A office space and that has 444,000 square feet on top of 103 multifamily units and 38,500 square feet of retail space. The asset also comes with 750 parking spaces to it. This particular transaction cost the company $246 million. Some of this was funded with $59.3 million in gross proceeds from a share offering that was closed in January of this year. The company also sold off a student housing property in Baltimore for $75 million.
Outside of the ownership of these assets, the company also has a segment called General Contracting and Real Estate Services. Through this segment, the company develops and builds properties for its own account, plus it provides construction and development services to both related parties like joint ventures, as well as to third parties. While the asset leasing portion of the business generates stable revenue and cash flows over time, this portion of the enterprise can see some rather significant volatility from year to year. For instance, back at the end of the firm’s 2020 fiscal year, backlog for this segment was just $71.26 million. But due to strong orders, this number increased to $215.52 million by the end of its 2021 fiscal year.
Author – SEC EDGAR Data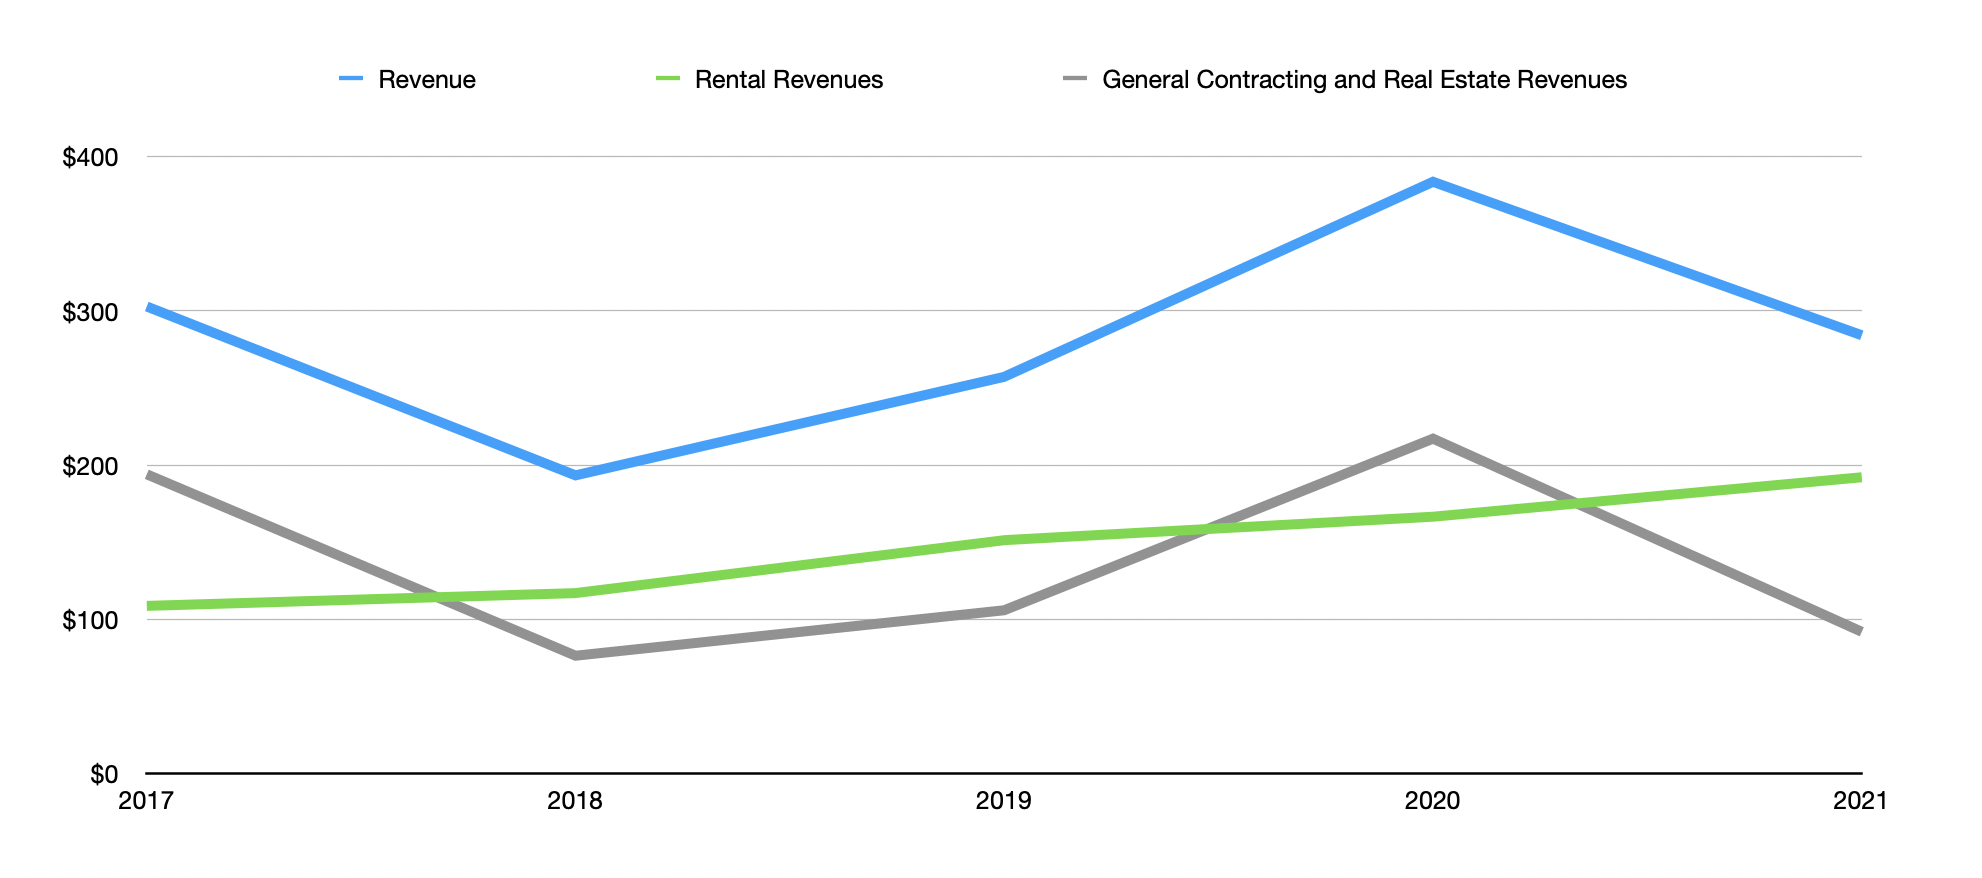
In recent years, the top line performance of the business has been rather mixed. As the chart above illustrates, this is not because of poor asset quality. In fact, the volatility is due entirely to the General Contracting and Real Estate Services segment. While this number has bounced all over the map, ranging from a low of $76.4 million in 2018 to a high of $217.1 million in 2020, the rental revenue climbed consistently, rising from $108.7 million to $192.1 million over the same timeframe. On top of this, the company is also benefited, generally speaking, from a rise in its stabilized occupancy rate. Between 2017 and 2019, this number rose from 94.2% to 96.5%. It then dropped to 94.4% in 2020 before rebounding to 96.7% by the end of the company’s 2021 fiscal year.
Author – SEC EDGAR Data
Author – SEC EDGAR Data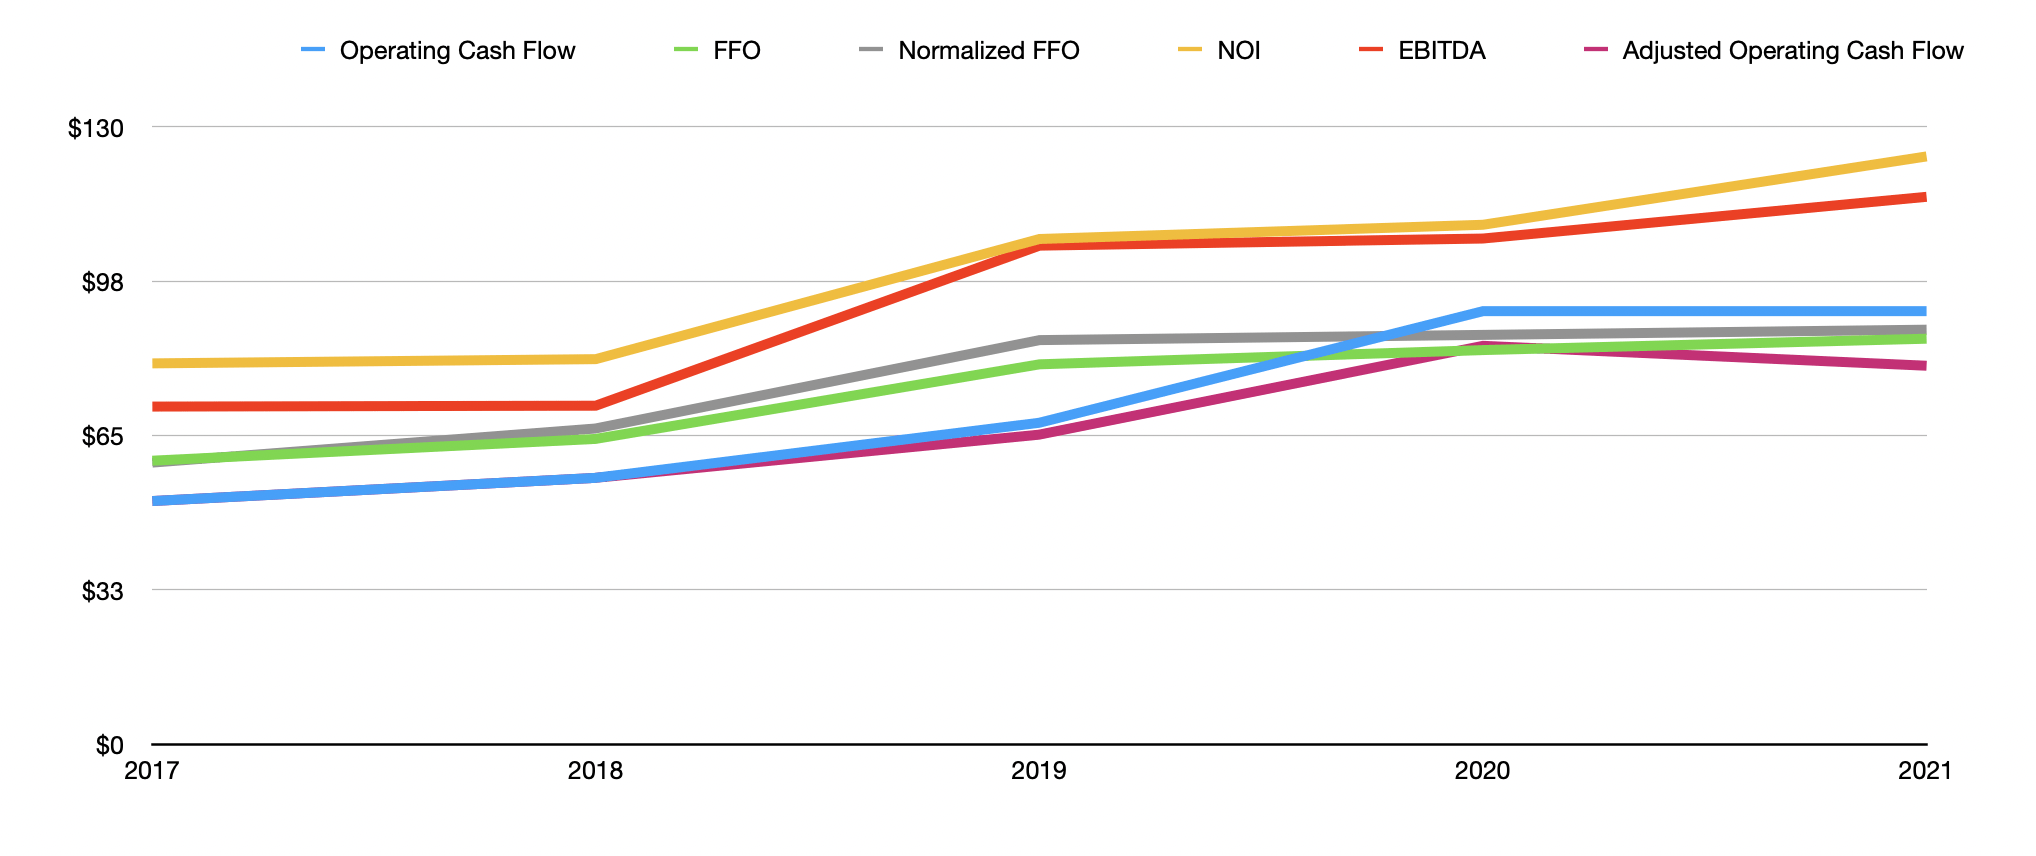
Revenue is important, but profitability is even more important. And as the leasing revenue for the company rose, so too did profits. Operating cash flow over the past five years increased from $51.2 million to $91.2 million. Stripping out preferred distributions, this number would have risen from $51.2 million to $79.7 million, with the only year better than what the company saw in 2021 being its 2020 fiscal year when the metric totaled $83.9 million. FFO, or funds from operations, as well as the adjusted equivalent of this, also increased in recent years. And the same can be said of EBITDA. Last year, this metric peaked at $115.3 million.
Author – SEC EDGAR Data
For the company’s 2022 fiscal year, the only valuable guidance management offered involved the firm’s NOI, or net operating income. This should be between $146.4 million and $147.4 million. This implies, at the midpoint, a year-over-year growth rate of 18.7%. Applying this same growth to the other profitability metrics would yield a price to adjusted operating cash flow reading of $94.6 million, FFO of $101.3 million, an adjusted FFO reading of $103.6 million, and EBITDA of $136.8 million. Taking this data, we can effectively price the company. The results of this data can be seen in the chart above, which focuses on both 2021 results and estimated 2022 figures.
To put the pricing of the company into perspective, I decided to compare it to five similar firms. On a price to operating cash flow basis, these companies range from a low of 12 to a high of 17.5. Three of the five companies were cheaper than Armada Hoffler Properties. I also did the same thing using the EV to EBITDA approach. This gave me a range of between 8.5 and 21.3. In this case, four of the five companies were cheaper than our prospect.
| Company | Price / Operating Cash Flow | EV / EBITDA |
| Armada Hoffler Properties | 15.9 | 20.5 |
| W. P. Carey (WPC) | 16.1 | 18.7 |
| PS Business Parks (PSB) | 14.9 | 8.5 |
| Alpine Income Property Trust (PINE) | 12.0 | 16.4 |
| Essential Properties Realty Trust (EPRT) | 17.5 | 21.3 |
| CTO Realty Growth (CTO) | 13.8 | 11.0 |
Takeaway
Based on the data provided, it seems to me as though Armada Hoffler Properties is an interesting company that has done generally well for itself and its investors from a fundamental perspective. Shares do look to be more or less fairly valued relative to the competition. In the grand scheme of things, it seems to me as though the business is likely fairly valued or perhaps slightly underpriced on an absolute basis. This is backed by the company’s track record, the likelihood that attractive growth will continue as management makes more investments, and in light of how shares are priced today.
Be the first to comment