

JoeLena
There’s been much criticism surrounding Catherine Wood’s ARK Invest. The fund’s ARK Fintech Innovation ETF (ARKF) has been in the firing line this year after losing over two-thirds of its market value.
Seeking Alpha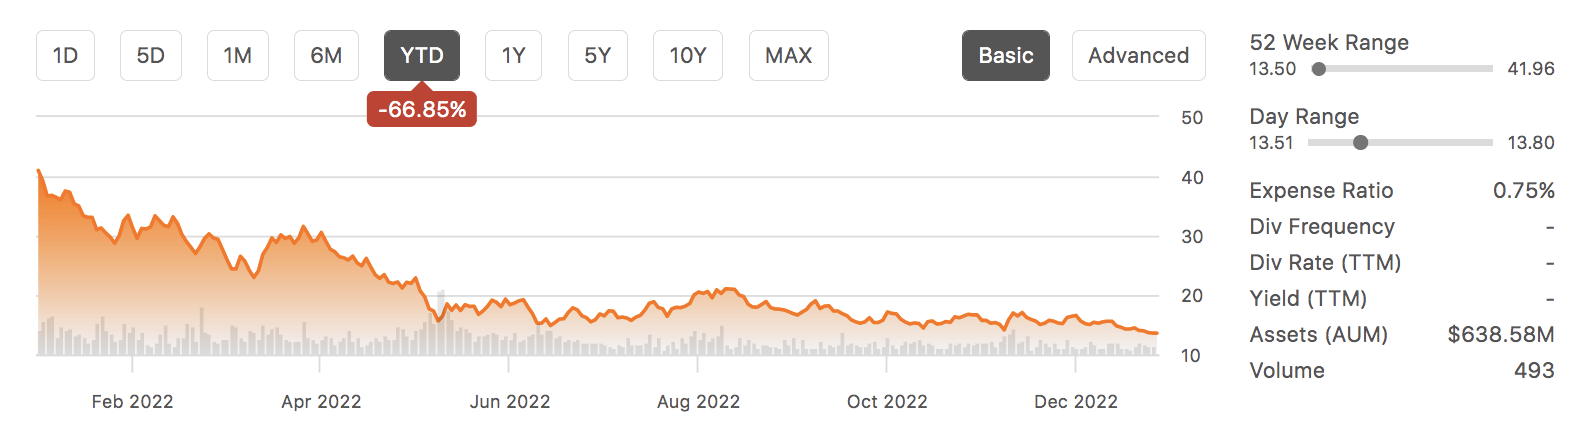
Billionaire Daniel Loeb recently criticized Wood’s funds, calling them ‘stonk holders’. Whether you believe in ARK’s mandate probably depends on your investment philosophy and understanding of risk attribution.
Today’s article analyzes the ARK Fintech Innovation ETF’s quantitative attributes. Additionally, a cross-sectional analysis is performed to explain the fund’s returns relative to various market circumstances.
Enjoy, and I look forward to any form of debate in the comments section!
Quantitative Measures
Management Skills
As mentioned, Catherine Wood’s management team has faced loads of subjective criticism this year because investors have suffered tremendous losses. However, we decided to assess matters quantitatively to keep things objective.
Overall, the fund needs more managerial prowess. I attached a workbook at the end of the section, displaying our findings. But let’s run through a few of them for context.
Firstly, the fund’s Sharpe and Sortino ratios are in tatters, both displaying negative numbers. The prior measures upside gains relative to volatility, while the latter observes downside losses concerning volatility. Even though the fund has experienced negative returns since its inception, its excess volatility is of concern.
Furthermore, ARKF’s information ratio is tremendously disappointing. A negative information ratio implies that the fund has onboarded more risk than the broader equity market while displaying worse returns. It doesn’t matter how you slice it; this isn’t something to overlook–for example, they could’ve hedged with derivatives to phase out growth stock headwinds. The IR ratio is often referred to as the “skill ratio,” and ARKF’s negative IR displays a lack of quality management.
Lastly, we think the fund’s conditional value-at-risk is extremely disappointing. Conditional VaR provides a summation of the value-at-risk per additional asset added to the portfolio. ARKF’s holdings are highly correlated, which means diversification is hard to come by.
Cross-Sectional Smart Beta Analysis
Smart Beta analysis is built to explain an asset’s returns during various stages of the economy. Keep in mind that ARKF is predominantly invested in growth stocks and that growth stock-centric portfolios are conviction plays. Growth stocks typically do well during low-interest rate environments and last into late-stage bull markets due to “investor herding”. Many believe growth stocks to be superior; however, long-term return distributions are often negatively skewed, meaning the upside potential is large, yet, the downside risk is even larger. Thus, holding a pure growth portfolio will underperform the broader stock market in the longer term.
Our smart beta analysis of ARK’s Fintech Innovation ETF delivered the following results.
- SMB: ARKF outperforms whenever small caps outperform the broader market.
- HML: ARKF has a positive relationship with value stock performance. Nonetheless, it will likely underperform the broader value segment during such circumstances.
- MOM: ARKF lacks late-stage bull market momentum as it exhibits negative sensitivity to momentum markets.
- ST-Rev: Sharp Short-Term mean revision is present.
- LT-REV: Negative correlation to a long-term stock market mean reversion.
- QMJ: Negative relationship whenever the market favors “quality stocks”. Quality stocks are characterized by high profitability and low reinvestment rates.
- BAB: ARKF underperforms during risk-off markets.
Author in Portfolio Visualizer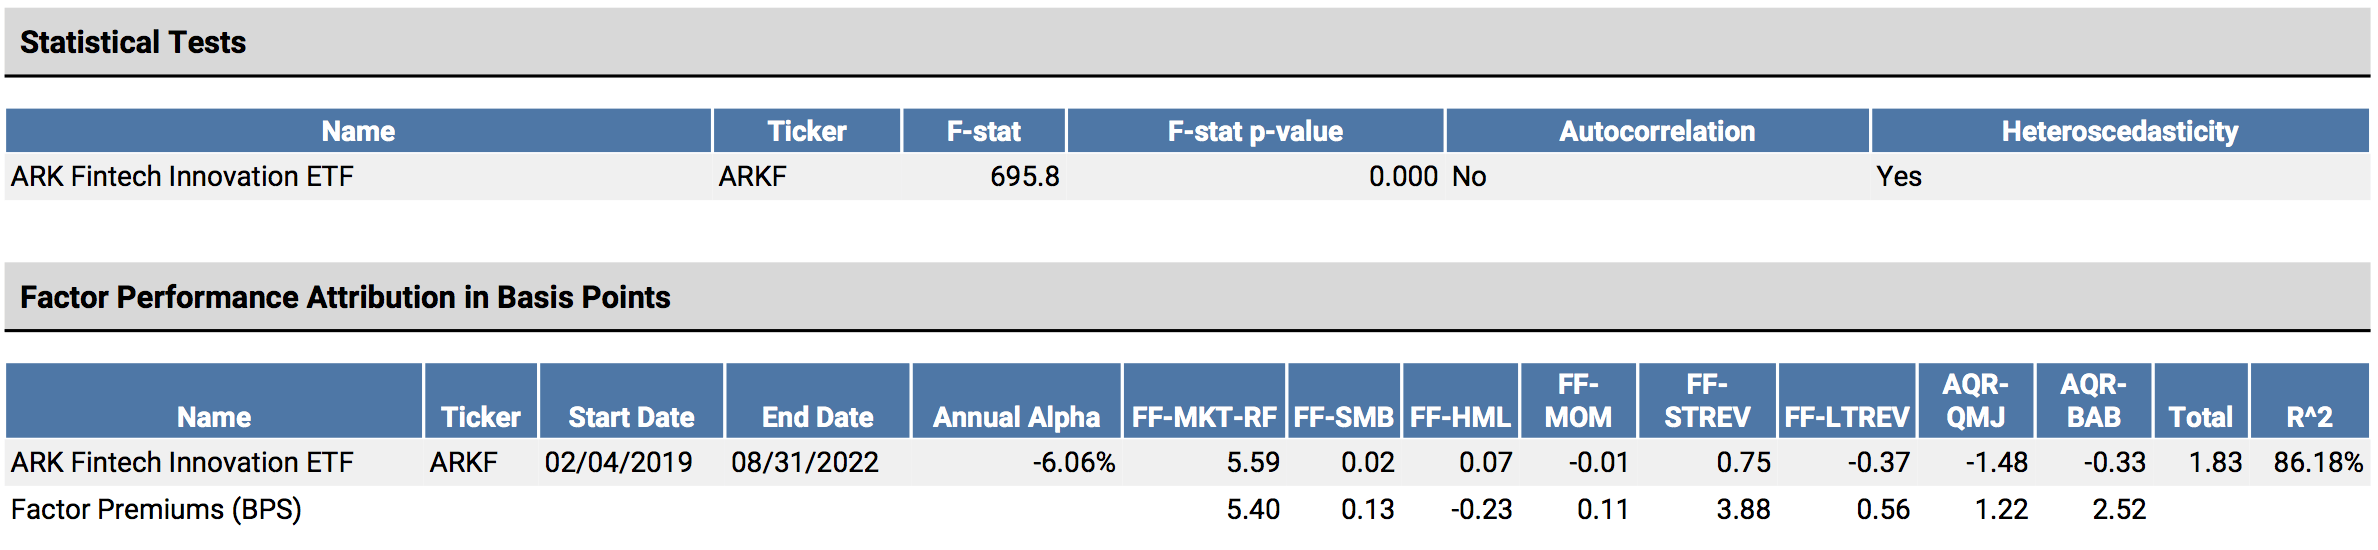
Based on the diagram below, value, low volatility, high dividend, and dividend growth have outperformed the market. The likely cause of their cross-sectional outperformance is the risk-off market sentiment, which caused higher beta stocks to capitulate.
Given ARKF’s smart beta analysis, it’s clear that it’s a risk-on asset. It’s unlikely that economic circumstances will radically improve in 2023 as we think inflation remains too elevated for the Federal Reserve to stop raising interest rates.
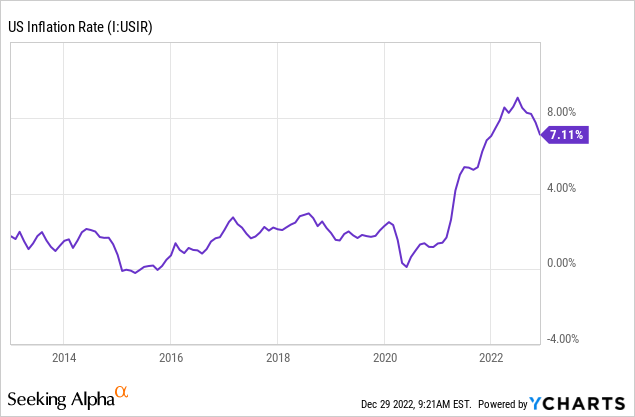
Furthermore, features such as geopolitical risk relating to China and Russia are at multiyear highs, and emerging markets are struggling in general, which has led to supply-chain concerns.
Thus, it’s unlikely that growth assets, and ARKF in particular, will rebound.
Seeking Alpha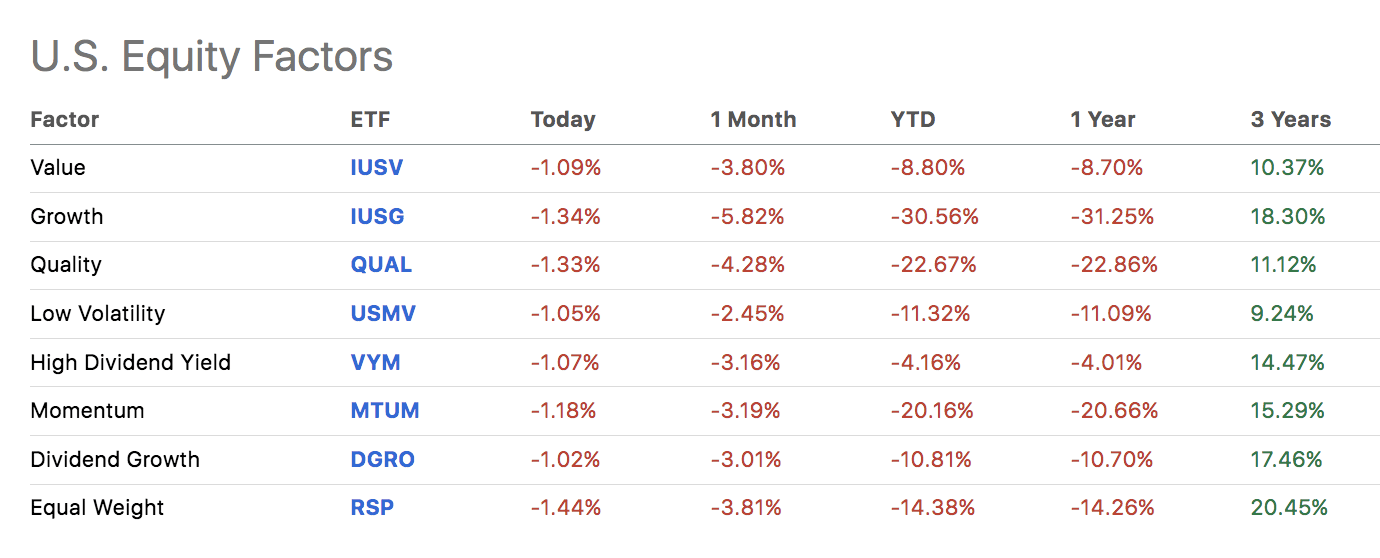
Holdings
Key metrics illustrate that this ETF is essentially a bet that the underlying assets’ growth trajectories will translate into future residual value. There’s no doubting the fact that the crypto market’s recent slump has influenced the ETF’s growth profile. However, most of its top holdings are on tremendously strong growth trajectories.
As said earlier, by investing in this ETF you’re betting on future residual value. Most of the ETF’s holdings don’t provide much residual value, which is a concern if you’re a value-driven investor.
| Stock | ROE | 3-Y CAGR |
| Shopify (SHOP) | -31.98% | 54.69% |
| Block (SQ) | -5.18% | 57.60% |
| MercadoLibre (MELI) | 30.94% | 67.68% |
| Coinbase Global (COIN) | -22.08% | -14.90% (y/y) |
| Discovery Ltd (OTCPK:DCYHF) | 11.02% | 5.14% |
| Twilio (TWLO) | -12.20% | 53.51% |
| Robinhood Markets (HOOD) | -17.92% | -24.21% (Y/Y) |
| DraftKings (DKNG) | -89.63 | 86.67% |
Source: Seeking Alpha
Collectively, the ETF’s holdings are highly secular and could rebound sharply in the event that growth stocks make a comeback. Thus, examining the ETF’s established portfolio provides a potential counterargument to our bearish outlook.
Final Word
The buy low, sell high theory doesn’t apply to all financial assets; in fact, looking at price in isolation can be dangerous. Even after its more than 60% year-to-date drawdown, we consider ARK Fintech Innovation ETF a Strong Sell based on our macroeconomic outlook, quantitative measures, and cross-sectional regression analysis.
Be the first to comment